

A few lines of code and your application generates metrics, wow!
To understand how prometheus_ works,flask_exporter requires a minimal example:
from flask import Flask
from prometheus_flask_exporter import PrometheusMetrics

app = Flask(__name__)
metrics = PrometheusMetrics(app)

@app.route('/')
def main():
    return 'OK'
That's all you need to get started! By adding the import and the line for initialization PrometheusMetrics, you will get metrics request durations and request counters, displayed at the endpoint /metrics of the Flask application where it is registered, as well as all the default metrics you receive from the base .
You can find in the GitHub repository, which runs an instance and together with a demo application to generate metrics that will look something like this:
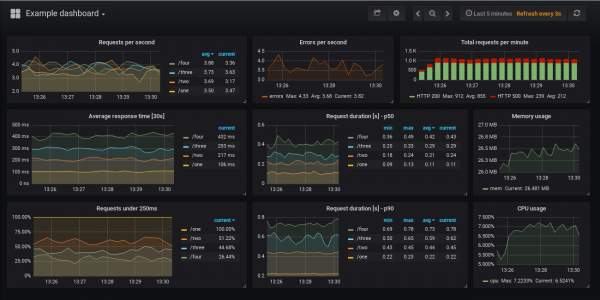
You will also find a list of metrics in the example, displayed on the dashboard, along with the Prometheus queries that populate the panels.
Settings
The library has many configuration options, check out the project for their examples with brief explanations.
The basic configuration is shown at the top. Just create an instance PrometheusMetrics, let's call it metrics, and then use it to define additional metrics that you want to collect by decorating functions:
@metrics.counter(..)@metrics.gauge(..)@metrics.summary(..)@metrics.histogram(..)
Counters count invocations, while the others collect metrics based on the duration of those invocations. You can define labels for each of them, potentially using request or response properties. For example:
from flask import Flask, request
from prometheus_flask_exporter import PrometheusMetrics

app = Flask(__name__)

# group by endpoint rather than path
metrics = PrometheusMetrics(app, group_by='endpoint')

@app.route('/collection/:collection_id/item/:item_id')
@metrics.counter(
    'cnt_collection', 'Number of invocations per collection', labels={
        'collection': lambda: request.view_args['collection_id'],
        'status': lambda resp: resp.status_code
    })
def get_item_from_collection(collection_id, item_id):
    pass
In the example above, hitting the endpoint /collection/10002/item/76 will increment the counter, for example cnt_collection{collection = "10002", status = "200"}, plus you will get the default metrics (for each endpoint in this example) from the default library:
flask_http_request_duration_seconds— Duration of HTTP requests in seconds for all Flask requests by method, path, and statusflask_http_request_total— Total number of HTTP requests by methods and statuses
There are options to skip tracking certain endpoints, register additional default metrics, or skip those mentioned above, or apply the same customizable metric to multiple endpoints. Refer to the project to see what's available.
app = Flask(__name__)
metrics = PrometheusMetrics(app)

@app.route('/')
def main():
    pass  # requests tracked by default

@app.route('/skip')
@metrics.do_not_track()
def skip():
    pass  # default metrics are not collected

# custom metric to be applied to multiple endpoints
common_counter = metrics.counter(
    'by_endpoint_counter', 'Request count by endpoints',
    labels={'endpoint': lambda: request.endpoint}
)

@app.route('/common/one')
@common_counter
def endpoint_one():
    pass  # tracked by the custom and the default metrics

@app.route('/common/two')
@common_counter
def endpoint_two():
    pass  # also tracked by the custom and the default metrics

# register additional default metrics
metrics.register_default(
    metrics.counter(
        'by_path_counter', 'Request count by request paths',
        labels={'path': lambda: request.path}
    )
)
The library includes convenient extensions for popular multi-process libraries, such as uWSGI and Gunicorn. You can also find small examples of targeting use cases, including multi-process ones.
Metric Collection
As previously mentioned, the library by default provides an endpoint /metrics in the Flask application, which can serve as a target for .
In the example above with the dashboard, you can point your Prometheus to the Flask app with default settings using the following configuration:
scrape_configs:
  - job_name: 'example'

    dns_sd_configs:
      - names: ['app']
        port: 5000
        type: A
        refresh_interval: 5s
See the full example in . This assumes that Prometheus can find your Flask application instances at http://app:5000/metrics, where the application domain name can potentially resolve to multiple IP addresses, such as when operating in or .
If such exposure of the metrics endpoint is not suitable for you because you do not wish to allow external access to it, you can easily disable it by passing path=None when creating an instance PrometheusMetrics.
from flask import Flask, request
from prometheus_flask_exporter import PrometheusMetrics

app = Flask(__name__)
metrics = PrometheusMetrics(app, path=None)

...

metrics.start_http_server(5099)
You can then use start_http_server(port)to open this endpoint on a different HTTP port, 5099 in the example above. Alternatively, if you're okay with the endpoint being in the same Flask application but need to change its path from /metrics, you can either pass a different URI as a path parameter or use register_endpoint(..), to set this later.
Links
— This Flask exporter for Prometheus
— Usage, examples, and configuration parameters
— Examples of monitoring Flask applications in various ways
— This project on PyPI
— The official Prometheus client library for Python
If you decide to give it a try, feel free to open an issue on GitHub or leave your comments, feedback, and suggestions!
Thank you!
Source: habr.com
