

Since 2008, our company has primarily focused on infrastructure management and 24/7 technical support for web projects: we have over 400 clients, accounting for about 15% of e-commerce in Russia. Consequently, the support involves a highly diverse architecture. If something fails, we are obligated to fix it within 15 minutes. However, to understand that an incident has occurred, one needs to monitor the project and respond to incidents. But how should this be done?
I believe that a disaster occurs when there is no proper monitoring system in place. If there were no disasters, my pitch would consist of one point: "Please install Prometheus + Grafana and plugins 1, 2, 3." Unfortunately, it doesn't work that way anymore. The main issue is that everyone continues to believe in something that existed back in 2008 regarding software components.
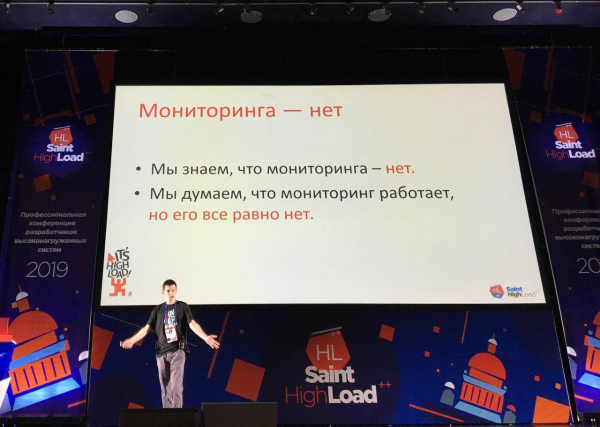
Regarding the organization of a monitoring system, I dare say that… there are no projects with competent monitoring. The situation is so dire that if something goes down, there is a risk it will go unnoticed — everyone believes that "everything is being monitored."
Perhaps everything is being monitored. But how?
We all have encountered a story like the following: a devops engineer or an admin is approached by a development team that says — "we've released, now monitor it." What to monitor? How does it work?
Okay. Let's monitor the old-fashioned way. But it has already changed, and it turns out that you were monitoring service A, which has become service B, which interacts with service C. Yet the development team tells you: "Install the software; it should monitor everything!"
So, what has changed? — Everything has changed!
2008. Everything was great.
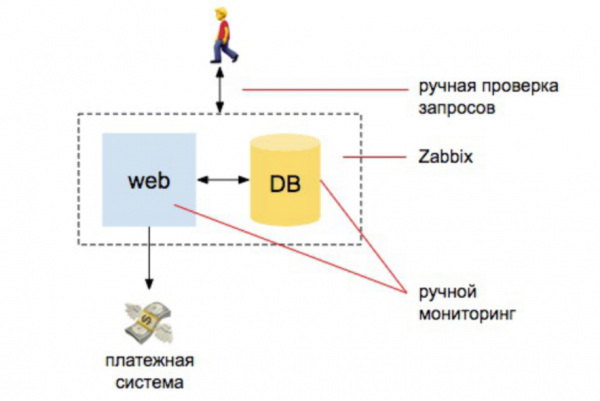
There are a couple of developers, one server, one database server. This is where it all begins. We have some information; we install Zabbix, Nagios, Cacti. Then we set up clear alerts for CPU usage, disk activity, and disk space. We also perform a few manual checks to ensure the site is responsive and that orders are being received in the database. And that's it— we're more or less protected.
Comparing the amount of work that the admin did at that time to ensure monitoring, 98% of it was automatic: the person responsible for monitoring needed to understand how to set up Zabbix, configure it, and set up alerts. Only 2% was for external checks: ensuring the website is responsive and querying the database, and confirming that new orders have come in.
2010. Load is increasing.
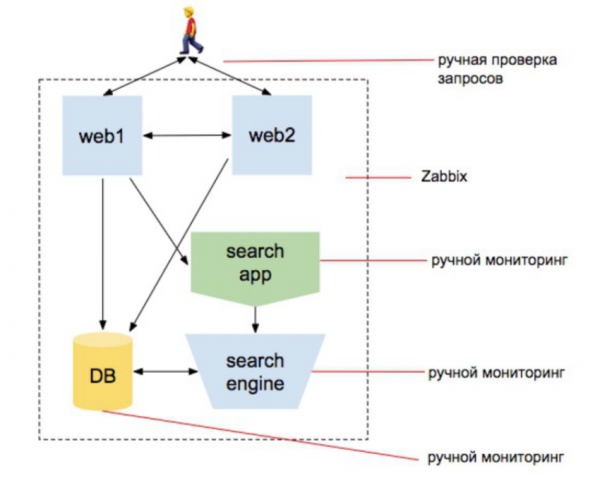
We are starting to scale the web services, adding a search engine. We want to be sure that the product catalog contains all the items. And that the product search functions properly. That the database is operational, that orders are being processed, that the site is responsive externally, and it supports users without kicking them off while they are being rebalanced to another server, etc. More entities are being created. servers Moreover, the entity related to infrastructure still remains the largest concern for the manager. The idea persists that the person responsible for monitoring is someone who will set up Zabbix and be able to configure it.
However, new tasks arise regarding external checks, creating a set of scripts for search indexer requests, a set of scripts to verify that searches change during indexing, and a set of scripts that check that products are being delivered correctly, and so on.
Notice: I mentioned 'set of scripts' three times. Thus, the person responsible for monitoring is no longer just the one who installs Zabbix. This is someone who starts coding. But the team's mindset has not changed yet.
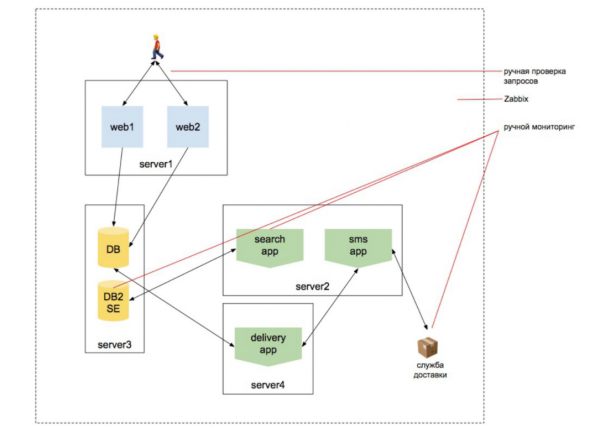
Meanwhile, the world is changing, becoming more complex. A layer of virtualization is added, along with several new systems. These systems begin to interact with each other. Who said it smells like microservices? Yet each service still looks like a separate site. We can access it and understand that it provides the necessary information and operates on its own. And if you are an admin who has been working on a project that has been evolving for 5-7-10 years, this knowledge accumulates: a new level appears — you recognize it, another level emerges — you recognize it...
But rarely does anyone follow a project for 10 years.
Summary of monitoring expertise.
Summary of the monitoring expert.
Imagine you join a new startup that immediately hires 20 developers, creates 15 microservices, and you are the admin told: "Build CI/CD. Please!" You set up CI/CD and suddenly hear: "We find it hard to work with production in the 'cube' without understanding how the application will function in it. Create a sandbox in this same 'cube.'"
You create a sandbox in this cube. You are immediately told: "We want a staging database that is updated daily from production so we can check that it works with the database without damaging the production database."
You live with all of this. With 2 weeks left until the release, you are told: "Now we need to monitor all of this..." That is, to monitor the clustered infrastructure, monitor the microservices architecture, monitor interactions with external services...
And colleagues pull out a familiar scheme and say: "It's all clear here! Just install a program that monitors all of this." Yes, indeed: Prometheus + Grafana + plugins.
And they add: "You have about two weeks, make sure everything is reliable."
In the multitude of projects we see, monitoring is assigned to one person. Imagine that we want to hire someone to focus on monitoring for 2 weeks, and we prepare a resume for that person. What skills should this person have, considering everything we mentioned earlier?
- They must understand monitoring and the specifics of hardware infrastructure.
- They should grasp the specifics of monitoring Kubernetes (everyone wants to use 'the cube' because it allows for abstraction, hiding away, as the admin will handle the rest) — by itself, its infrastructure, and know how to monitor applications within.
- They need to understand that services communicate in unique ways and know the specifics of service interactions. It's quite common to see a project where some services communicate synchronously because there’s no other way. For example, the backend uses REST, or gRPC, to communicate with the catalog service, retrieves a product list, and returns it. Here, you can't wait. Other services communicate asynchronously, such as sending an order to a delivery service, sending an email, etc.
You’ve probably started to feel overwhelmed by all of this? And the admin who needs to monitor it is even more overwhelmed. - He must be able to plan and plan properly, as the workload continues to increase.
- He must therefore create a strategy from the service created to understand how to monitor it specifically. He needs an understanding of the project architecture and its development, along with knowledge of the technologies used in development.
Let's recall a completely normal case: part of the services on PHP, part on Go, and part on JS. They somehow work together. Hence the term 'microservice': there are so many separate systems that developers cannot understand the project as a whole. One part of the team writes services in JS that operate on their own and do not know how the rest of the system works. Another part writes services in Python and does not delve into how other services work, as they are isolated in their domain. The third writes services in PHP or something else.
All these 20 people are divided into 15 services, and there is only one administrator who has to understand all of this. Wait! We just broke the system into 15 microservices because 20 people cannot grasp the entire system.
But it still needs to be monitored somehow...
So, what’s the outcome? Ultimately, there is one person who holds everything that an entire team of developers cannot comprehend, and at the same time, he still needs to know and be skilled in what we mentioned earlier — hardware infrastructure, Kubernetes infrastructure, etc.
What can we say here… Houston, we have a problem.
Monitoring a modern software project is a software project in itself.
From the false confidence that monitoring is software, we develop a belief in miracles. But alas, miracles don’t happen. You can't just set up Zabbix and expect everything to work. There’s no point in setting up Grafana and hoping that all will be well. Most of the time will be spent organizing checks on how the services work and interact with each other, as well as how external systems function. In fact, 90% of the time will not go into writing scripts, but into software development. And this should be handled by a team that understands the workings of the project.
If, in this situation, one person is thrown into monitoring, disaster will strike. Which is what happens everywhere.
For example, there are several services that communicate with each other via Kafka. An order has come in, and we sent a message about the order to Kafka. There is a service that listens for order information and processes the shipment of the goods. There’s also a service that listens for order information and sends an email to the user. Then, a bunch of other services appear, and we start getting confused.
And if you give this to the admin and developers at a stage when there’s only a short time left until the release, the person will need to understand the whole protocol. That is, a project of this scale takes a significant amount of time, and this should be accounted for in the system’s development.
But very often, especially in startups, we see monitoring being postponed. 'Now we'll do a Proof of Concept, launch it, let it fail—we're ready to sacrifice. Then we’ll monitor everything.' When (or if) the project starts making money, the business wants to add even more features—because it has started to work, so we need to push it further! Meanwhile, you are at a point where initially you must monitor everything prior, which takes much more than 1% of the time. By the way, developers are needed for monitoring, and it's easier to let them work on new features. In the end, new features are written, everything is ramped up, and you find yourself in an endless deadlock.
So how do you monitor a project from the start, and what should you do if you have a project that needs monitoring, but you don’t know where to begin?
First of all, planning is essential.
A brief aside: people often start with monitoring the infrastructure. For example, we have Kubernetes. We’ll start by installing Prometheus with Grafana and put in plugins for monitoring the 'cube'. Not only developers but also admins have a regrettable practice: 'We'll install this plugin, and the plugin probably knows how to do this.' People like to start with simple and understandable things rather than important actions. Monitoring infrastructure is just that.
First, decide what you want to monitor and how, then choose the tool, because other people can't think for you. Should they? Other people thought about themselves, about a universal system—or didn't think at all when they wrote this plugin. Just because this plugin has 5,000 users doesn't mean it provides any real benefit. You might just be the 5,001st user because there were already 5,000 people there before you.
If you start monitoring your infrastructure and your application's backend stops responding, all users will lose connection with the mobile app. An error will pop up. They will come to you and say, 'The app doesn't work, what are you doing here?' - 'We're monitoring.' - 'How can you monitor if you can't see that the app isn't working?!'
- I believe that monitoring should start from the user's entry point. If a user cannot see that the app is working—that's it, it's a failure. The monitoring system should alert you about this first and foremost.
- Only then can we monitor the infrastructure. Or we can do it in parallel. It's easier with the infrastructure—here we can finally just set up Zabbix.
- Now we need to go into the application's core to understand where things are not working.
My main thought is that monitoring should go hand in hand with the development process. If you pull the monitoring team away for other tasks (like creating CI/CD, sandboxes, or reorganizing infrastructure), monitoring will start to lag, and you may never catch up with development again (or sooner or later, you'll have to halt it).
Everything by levels
Here's how I see the organization of the monitoring system.
1) Application level:
- monitoring the business logic of the application;
- monitoring the health metrics of services;
- integration monitoring.
2) Infrastructure level:
- monitoring orchestration level;
- monitoring system software;
- monitoring hardware level.
3) Again, application level—but now as an engineering product:
- collecting and observing application logs;
- APM;
- tracing.
4) Alerting:
- organizing the notification system;
- organizing the duty system;
- organizing the 'knowledge base' and incident handling workflow.
Important: We reach alerting not afterwards, but immediately! There's no need to start monitoring and then think about who will receive alerts later. The purpose of monitoring is to understand where something in the system isn't functioning correctly and to inform the right people about it. If we leave this until the end, the necessary people will only find out something is wrong when they get a call saying, 'nothing is working.'
Application Level — Monitoring Business Logic
Here we are talking about verifying that the application works for the user.
This level must be established during the development stage. For example, let's say we have a fictitious Prometheus: it accesses a server responsible for checks, pulls the endpoint, and the endpoint goes and checks the API.
When requests often come in to monitor the homepage to ensure the site is working, developers provide a hook that can be triggered every time we need to verify that the API is functioning. Meanwhile, the developers are also creating /api/test/helloworld.
Is there any way to make sure everything is working? — No!
- Creating such checks is essentially the developers' responsibility. Unit tests should be written by the programmers who write the code. Because if you hand this off to an admin with, 'Dude, here’s a list of the API protocols for all 25 functions, please monitor them all!' — nothing will come of it.
- If you simply do a print 'hello world', no one will ever know that the API is supposed to work and actually does. Every change to the API should lead to corresponding changes in the checks.
- If you're already in such a predicament — halt the features and allocate developers who will write these checks, or resign yourself to the losses, accepting that nothing is being checked and it will fail.
Technical Tips:
- Be sure to organize an external server for carrying out checks — you must ensure that your project is accessible to the outside world.
- Organize checks across the entire API protocol, not just isolated endpoints.
- Create a Prometheus endpoint with the results of the checks.
Application Level — Monitoring Health Metrics
Now we are talking about external health metrics of services.
We decided that all the 'handles' of the application are monitored using external checks, which we invoke from an external monitoring system. But these are exactly the 'handles' that the user 'sees'. We want to ensure that our services themselves are running. Here the situation is better: K8s has health checks, so at least the 'cube' can verify that the service is up. But half of the checks I have seen are just the same old print 'hello world'. That is, it triggers once after the deployment, it gets a response that everything is fine — and that's it. And for a service that exposes its API via REST, there are a huge number of entry points of that very API that also need to be monitored, because we want to know that it is functioning. And we already monitor it internally.
How to implement this correctly from a technical standpoint: each service exposes an endpoint regarding its current operational status, and in Grafana's graphs (or any other application), we see the status of all services.
- Every change to the API should lead to a change in the checks.
- When creating a new service, do so with health metrics from the start.
- An admin may approach developers and ask, 'please add a couple of features so that I can understand everything and incorporate this information into my monitoring system'. But developers usually respond, 'We won't be adding anything two weeks before the release.'
Let the development managers know that there will be such losses, and let the upper management of the development managers know too. Because when everything fails, someone will still call and demand to monitor the 'constantly-failing service' (c). - By the way, allocate developers to write plugins for Grafana — this will be a great help for the admins.
Application Level — Integration Monitoring
Integration monitoring focuses on monitoring the communication between critical business systems.
For example, there are 15 services that communicate with each other. They are no longer separate sites. That is, we cannot just call a service by itself, get /helloworld and understand that the service is functioning. Because the web service for order processing must send order information to the bus — the warehouse service must receive this message from the bus and process it further. And the email-sending service must handle it somehow from there, and so on.
Therefore, we cannot understand by poking at each individual service how everything works. Because we have some kind of bus through which all interactions and communications take place.
Thus, this stage should represent the testing phase of services interacting with other services. Monitoring the message broker alone does not allow us to organize monitoring of the communication. If there is one service that produces data and another that receives it, when monitoring the broker we will only see the data flowing back and forth. Even if we manage to monitor the interaction of this data internally — that a producer posts data, someone reads it, and this stream continues in Kafka — it still won’t inform us if one service sent a message in a particular version, while the other did not expect this version and missed it. We won't find out, as the services will tell us that everything is functioning.
How I recommend doing this:
- For synchronous communication: the endpoint makes requests to related services. That is, we take this endpoint, trigger a script within the service that goes through all the points and says, 'I can call there, and there, I can call here...'
- For asynchronous communication: incoming messages — the endpoint checks the bus for test messages and provides a processing status.
- For asynchronous communication: outgoing messages — the endpoint sends test messages to the bus.
As it usually happens: there’s a service that throws data onto the bus. We approach this service and ask it to share its integration health. If the service is supposed to produce some message further down (WebApp), it will produce this test message. And if we trigger the service on the OrderProcessing side, it first posts what it can independently, and if there are dependent things — it reads a set of test messages from the bus, understands what it can process, reports on it, and if necessary, posts them further, saying — all good, I’m alive.
We often hear the question, "How can we test this on live data?" For example, this concerns the order service. An order sends messages to the warehouse where items are deducted: we can't test this on live data because "I'll have items being deducted!" The solution: plan this entire test at the outset. You have unit tests that create mocks. So, implement this at a deeper level, where you have a communication channel that won't harm business operations.
Infrastructure Level
Infrastructure monitoring is long regarded as the essence of monitoring.
- Infrastructure monitoring can and should be initiated as a separate process.
- Don't start with infrastructure monitoring on a running project, even if you really want to. This is a common pitfall for all DevOps. "I'll monitor the cluster first, then the infrastructure" — meaning they will first monitor what is beneath and not delve into the application. Because the application is something unclear to the DevOps. It was handed off to them, and they don't understand how it works. But they understand the infrastructure and begin with it. However, no — you should always monitor the application first.
- Don't overload on alerts. Given the complexity of modern systems, alerts are constantly flying in, and one has to deal with this influx. A person on-call, looking at a hundred new alerts, might decide, "I don’t want to think about this." Alerts should only notify about critical issues.
Application Level as a Business Unit
Key Points:
- ELK. This is the industry standard. If for any reason you're not aggregating logs, start doing so immediately.
- APM. External APMs as a way to quickly address application monitoring (NewRelic, BlackFire, Datadog). You can temporarily implement this tool to gain some understanding of what is happening.
- Tracing. In dozens of microservices, you must trace everything since a request no longer exists on its own. Adding this later is very difficult, so it's better to plan tracing during development — it's a task and a utility for developers. If you haven't implemented it yet, do so! See Jaeger/Zipkin.
Alerting
- Organizing the alert system: in the context of monitoring many things, there should be a unified notification dispatch system. You can use Grafana. In the West, everyone uses PagerDuty. Alerts should be clear (for instance, where they came from…). It's also advisable to monitor whether alerts are actually being received.
- Organizing the on-call system: alerts should not go to everyone (otherwise they will all react as a crowd, or no one will react). Developers also need to be on-call: clearly define areas of responsibility, create a clear instruction manual, and specify who to call on Monday and Wednesday, and who on Tuesday and Friday (otherwise, no one will call even in case of a major disaster—they will be afraid to wake someone up; people generally dislike calling and waking others, especially at night). And explain that asking for help is not a sign of incompetence ('asking for help means I'm a bad worker'); encourage requests for assistance.
- Organizing a knowledge base and workflow for incident handling: for each serious incident, a post-mortem should be scheduled. As a temporary measure, actions taken to resolve the incident should be documented. Also, cultivate a practice that recurring alerts are a fault; they need to be fixed in the code or infrastructure work.
Technology stack
Let's imagine our stack is as follows:
- data collection — Prometheus + Grafana;
- log analysis — ELK;
- for APM or Tracing — Jaeger (Zipkin).

The choice of options is non-critical. Because if you understood how to monitor the system from the start and outlined a plan, you will begin selecting tools according to your requirements. The question is what you initially chose to monitor. Because the tool you initially chose might not meet your requirements at all.
Several technical points I see everywhere lately:
Prometheus is being stuffed into Kubernetes — who thought of that?! If your cluster goes down, what will you do? If you have a complex cluster inside, there should be some monitoring system working inside the cluster, and another one outside of it, which will collect data from inside the cluster.
Inside the cluster, we collect logs and everything else. But monitoring systems should be external. Very often in a cluster where there is Prometheus installed internally, there are also systems that perform external checks on the site's functionality. And what if your connection to the outside world drops and the application doesn't work? It turns out that everything is fine internally, but that doesn't help the users.
Conclusions
- Developing monitoring isn't just about installing utilities; it's about developing a software product. 98% of today's monitoring involves coding. Coding in services, coding for external checks, checking external services, and everything else.
- Don't spare developers' time on monitoring: it can take up to 30% of their work, but it's worth it.
- DevOps, don't worry if you find it difficult to set up monitoring because some aspects require a completely different mindset. You weren't a programmer, and monitoring is precisely their domain.
- If the project is already running and hasn't been monitored (and you are the manager) — allocate resources for monitoring.
- If the product is already in production and you're the DevOps who was told to "set up monitoring" — try to explain to the leadership what I've been talking about.
This is an extended version of a presentation at the Saint Highload++ conference.
If you're interested in my ideas and reflections on IT and related topics, here's where you can 🙂
Source: habr.com
