

Service Sentry allows you to remotely monitor bugs in front-end applications written in JavaScript.

Trying to fix problems in front-end applications on JavaScript can be tricky because they originate in the user's browser, which you often don't have access to. However, Sentry allows you to monitor bugs remotely.
You can download the solutions discussed in this article.
What is necessary
If you want to use these examples, you will need:
- : A multifunctional development tool that is not part of the application. We downloaded the latest LTS version (8.12.0)
- Sentry: Either an Account in the Sentry service (you can record up to 10 thousand bugs per month for free) or an installed local Sentry -
Installation on your server
There are 2 ways to install Sentry On-Premise on your servers
-
Build rpm and install them -
-
Use the official installer:
Установить на сервер docker и docker-compose
git clone https://github.com/getsentry/onpremise.git
./install.sh
Standard usage
To get started, add a new one from the service site Sentry-project for application. After selecting the desired language, you will receive the relevant documentation. In our case, we chose JavaScript.
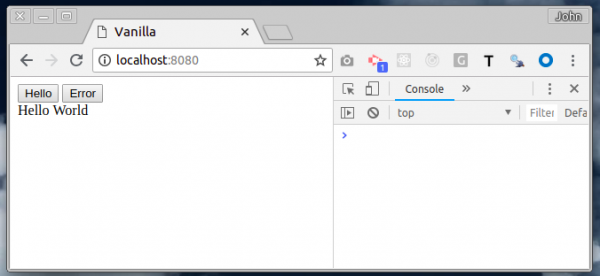
The first example is standard JavaScript. There are two buttons here: "Hello" (hello) and "Error" (Error).
After you click on the button "Hello", the screen will reload, and the block try find and catch the bug. After the bug is "caught", the error report is manually sent to the service Sentry.
The "Error" button allows you to easily find a bug.
vanilla/index.html
<!DOCTYPE html>
<html>
<head>
<meta charset="UTF-8">
<title>Vanilla</title>
</head>
<body>
  <button id="hello">Hello</button>
  <button id="error">Error</button>
  <div id="output"></div>
  <script src="https://browser.sentry-cdn.com/4.0.5/bundle.min.js" crossorigin="anonymous"></script>
  <script>
    (function () {
      'use strict';
      Sentry.init({ dsn: 'https://b5bf359072254626aba8e64368e77b7d@sentry.io/1289664' });
      var helloEl = document.getElementById('hello');
      var errorEl = document.getElementById('error');
      var outputEl = document.getElementById('output');
      helloEl.addEventListener('click', handleHelloClick);
      errorEl.addEventListener('click', handleErrorClick);
      function handleHelloClick() {
        outputEl.innerHTML = 'Hello World';
        try {
          throw new Error('Caught');
        } catch (err) {
          Sentry.captureException(err);
        }
      }
      function handleErrorClick() {
        throw new Error('Uncaught');
      }
    })();
  </script>
</body>
</html>
Notes:
- Sentry is installed from the CDN and exposed as a global variable
- A little earlier, we launched Sentry in our JavaScript.
To test this example, we can use the static web server framework Node.js: http server. Go to the folder where the file is stored index.html, and enter (option with disables caching) the following line to open the address in the browser .
How caught bugs are displayed
First click the button "Hello".
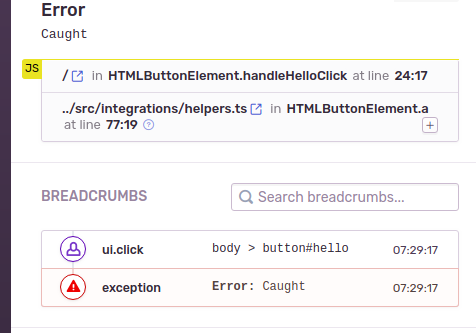
We have caught a bug, so it will not float up the call stack, and therefore is not monitored in the console. However, since we ship to Sentry report a bug manually, you will see a message about it in your account.
Notes:
- We can trace in which line (24) the bug is in
- In addition, the breadcrumb displays the actions of the browser that led to the error.
How uncaught bugs are displayed
Clicking the button "Error".
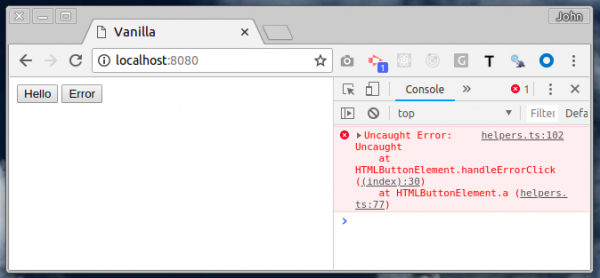
The bug floats up the call stack and thus an error message is displayed on the console. After that, Sentry automatically monitors the bug, without any additional actions.
Notes:
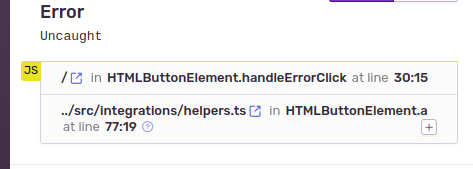
- We can see in which line (30) the bug is lost
- Breadcrumbs not provided (I don't quite understand why)
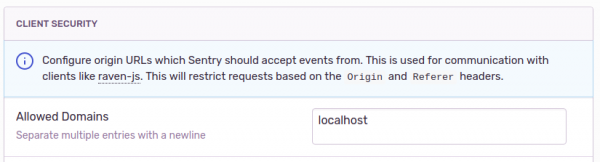
How to ensure project security
You may have noticed the way we control which pages can report errors to our project. Sentry; with help dsn records. The problem is that the input can be seen by anyone who views your page's source code.
To avoid this, we need to limit the number of domains that can submit error reports to our project. In this example we used localhost (local host). This option is configured in the settings tab. Sentry-project, Sentry Project Setting.
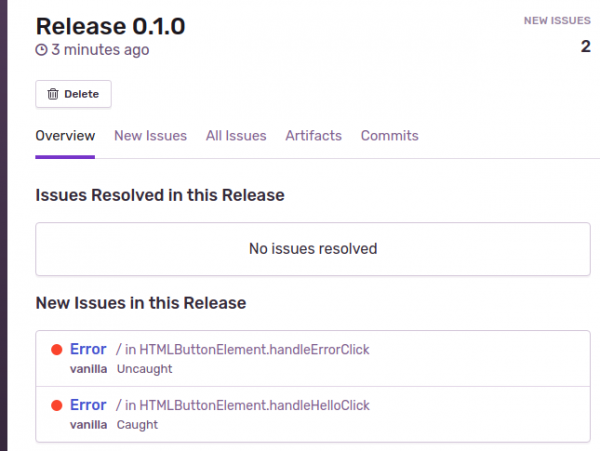
Releases
If you think about how to use Sentry in different variations of our application, then a mechanism is needed here that will mark errors with a version number.
After all, it is not necessary for the bug we fixed to surface again, and we thought that what we fixed did not work. It could also be that the user is running an older, cached version of the application.
To solve the problem, you need to enter the identifier release (versions) at startup Sentry.
vanilla/index.html
...
var RELEASE = '0.1.0';
Sentry.init({
  dsn: 'https://b5bf359072254626aba8e64368e77b7d@sentry.io/1289664',
  release: RELEASE,
});
...
After that, all new errors will be marked as release(0.1.0), that is, they will be tied to the correct version of the code.
Notes:
- We have covered a simple way to use releases.
- Sentry allows you to apply more , which is closely related to GitHub. This feature makes it possible to track bugs before performing certain operations.
PS The second part is longer, so it will be in a separate post.
PS Telegram chat Sentry
PS I forgot to indicate that this is a translation of the post
Source: habr.com
