


0. Intro
I couldn't find a single article on NetXMS on Habr, despite looking extensively. For this reason alone, I decided to write this piece to shed light on this system.
This is both a tutorial and a how-to, as well as a superficial overview of the system's capabilities.
This article provides a surface analysis and description of the system's features. I haven't delved deeply into its functionalities for a number of reasons. Moreover, a full description of all features would require far more than a single article.
Since I have only moderately worked with Zabbix, this article will frequently reference that system for comparison with the subject. Besides, it seems to be a common practice to compare everything with something widely recognized.
1. What and Why?
A monitoring system, as defined, is a system that allows you to obtain up-to-date information about any node, whether it be a machine, router, or other units, at any moment in time.
The need for this is equally obvious. To stay informed about what is happening.
Often, a monitoring system can provide quite comprehensive information about the state of the infrastructure as a whole, as well as its individual components. Additionally, if alerts are set up (and without them, any monitoring is practically worthless), we end up with a serious tool that enables not only timely responses to emergent issues but also, in most cases, the ability to prevent those issues from arising.
2. Why NetXMS?
A little off-topic for those who love a lot of text.When I was young and inexperienced... Is that how all fairy tales start? In other words, when I was an idealist, I studied infrastructure monitoring, and the result of those 'researches' was the conclusion that nothing beats Zabbix. At that time, I really liked it because it can do a lot, has many features, and its functionality can be extended with custom scripts, so in a way, you could say it can do anything if you have the right skills. However, Zabbix is quite a complex tool. It took me nearly two weeks just to understand how to get by with it. And that was just the deployment stage. Then another couple of weeks to configure the monitoring of everything I needed at that time. And when I read about how to check the status of ports on routers with it, I got scared and decided it wasn't really necessary for me... I mean, it's genuinely daunting for an unprepared mind right after graduation...
And so, several years later, having matured and gained experience, I decided it was time to refresh my knowledge of monitoring systems. Finally, to establish proper, stable network monitoring, since this issue became relevant with the growth of segments, the connection of a branch office, and other minor issues. Everything flows, everything changes. I started testing various tools. I'd install one system, poke around, then try another. And everywhere something was lacking, something was unsatisfactory. Sometimes the interface was inconvenient, sometimes the configuration was exhausting, and so on. Then I stumbled upon NetXMS. By the way, where it took me two weeks to figure out Zabbix, things took off with NetXMS in just a couple of hours. Perhaps my experience with Zabbix played a role, or maybe it's just how NetXMS is designed... hard to say.
NetXMS turned out to be quite simple to install and configure. It has server and administrative console versions for both Windows and Linux, graphing capabilities, a built-in 'browser' that allows you to connect to the same routers via HTTP/HTTPS protocols from within the administrative console, and the interface is intuitive, along with an agent for any OS. Overall, this system turned out to be simple and convenient. At first glance.
Their documentation, I must say, scores an 8 out of 10. It covers the basics, but to dive into the details, you need to dig a bit.
Key benefits highlighted by the developerIn-depth network monitoring
Automatic detection, visualization, and search for connected components at levels 2 and 3
Full support for SNMPv3
Active discovery using scanning probes
Passive discovery based on information from managed devices — ARP and routing tables, interfaces
Monitoring of applications and servers
All the main metrics you expect: CPU, file systems, input-output, memory, traffic
JMX bridge for monitoring Java applications
Extensions for specific applications: Oracle, MySQL, PostgreSQL, MongoDB, DB2, Tuxedo, and many others
Integration API for custom applications
Designed for large networks
One server can track hundreds of metrics across thousands of devices
Full support for distributed monitoring and horizontal scaling
Monitoring of overlapping IP subnets
Flexible access control for operators and clients
3. Delving deeper
How to install the system — there is a whole for administrators available at , and it's not complicated, so I won't dwell on this. The most challenging part of the installation is connecting the system to the database... The only difference will be the choice of DBMS and server OS. I chose Windows (next-next-enter details-done) and MSSQL, as I already had that.
3.1. Enabling auto-discovery
Network node auto-discovery can be enabled during installation. If this wasn't done for some reason, it can always be enabled in "Configuration-Network Discovery" or by clicking the icon with the same name. Discovery properties will appear in the workspace. It needs to be enabled by switching to passive or active mode, and specifying other properties, such as the queried subnets. You can also set filters here, and you can either select from and fine-tune the built-in ones or write custom scripts. Honestly, I didn't need the filters. But the setup looks quite friendly and understandable.
You can also specify the default SNMP community and its credentials (read authorization).
3.2. Adding nodes
With auto-discovery enabled, endpoint nodes (PCs, printers) will be automatically added and distributed across subnets. It's a bit more complex with active network equipment.
You should start by enabling SNMP on the networking equipment and configuring the community. If the default value for the SNMP community was not changed in the network node discovery properties, the system will use the public community, although this setting can be changed for each node in the properties of the added node.
For convenience, devices can be grouped by any convenient principle. To do this, you can create containers in the Infrastructure Services branch and bind nodes from the Entire Network into them.
After enabling and configuring SNMP on the routers and adding them to the monitored equipment list, the system will automatically communicate with them, query them, determine what devices they are, apply templates, start data collection, and display the front panel for each router. Automatically. Out of the box. When I was configuring Zabbix, I could only dream of something like this.
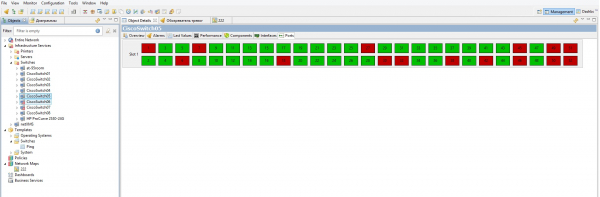
I added all my network devices manually, as they did not automatically get discovered for some reason. It’s simple. Create a container in Infrastructure Services with any convenient name (for example, switches), and Right-click-create-node, specify the displayed name of the node, its IP address, and it’s better to check the box for 'disable the use of the NetXMS agent,' since it cannot be installed on networking equipment anyway, and unnecessary packages are not needed.
Built-in browser. You can simply right-click on the desired router and open the device's web interface. I found this more convenient than digging through my notes every time to find the required IP. Although, the browser is quite basic.
3.3. Building a Network Map
First of all, you need to create a network map as an object. As usual, in the branch Networks Map right-click, create, select the type of map, set the parameters, and the system will take care of the rest.
The types of maps are as follows:
- Custom. This is a map designed for manual creation at the user's discretion.
- Layer 2 topology. This is a map that allows you to automate everything for the user based on Layer 2 of the OSI model (essentially, it builds the map based on the MAC addresses of the devices).
- IP topology, it is also known as Layer 3. This is the same as in the case of Layer 2, only the map is built based on Layer 3 of the OSI model (IP addresses).
When choosing to manually create a map, nodes need to be dragged from the tree onto the map layer, connected, etc. It’s just regular drawing.
In two other cases, you need to choose a reference point from which the system will start building the map, for example, a node from a router. The system reads data from it about connected devices and the ports to which they are connected, then reads data from the next router, matches them, and so on. After analyzing all devices, NetXMS will draw connections between network devices, indicating the ports to which they are connected. You can also specify that the system should include end devices (printers, PCs, servers) on the map by simply clicking the corresponding option in the map properties.Right-click — properties — map properties). You can also set a 'detection radius' in this section if desired or necessary.
A small recommendation: Enable the 'Always fit layout to screen' property so that every time you update the network map, you don't have to scroll through the workspace and adjust the zoom.
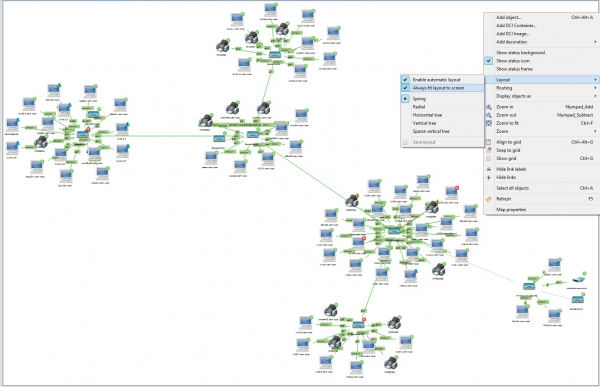
In a distributed network topology, you can overlay objects on a map of the terrain. You can also use, for example, a photo of a rack with equipment in the server room as a background layer, overlaying it with the necessary objects. This allows you to quickly determine the status of any device in the rack. In my opinion, this is extremely useful in case you need to hand over responsibilities to a successor or explain the situation to a newcomer. It's visual, convenient, and self-explanatory.
3.4. Agents
Agents exist for both Windows and Linux. The working principle is the same as that of the agents in Zabbix: it's installed on the machine from which metrics need to be collected, and it transmits data to the monitoring server. The agent can be installed either before adding the node to the system or after. Once the agent appears on the node, the system will start receiving data from it after a while, applying a standard template. You can add monitored parameters for a single node or by attaching one or more predefined templates to it. It is advisable, of course, to work with templates, as this setup is more flexible.
The list of monitored parameters for agents is quite extensive. You can view the complete list in
Once the system detects that an agent is running on the node, it will immediately associate this node with one of the default templates — Windows, Linux, HP-UX, Generic UNIX, AIX, depending on the operating system of the node.
The standard template for Windows hosts:
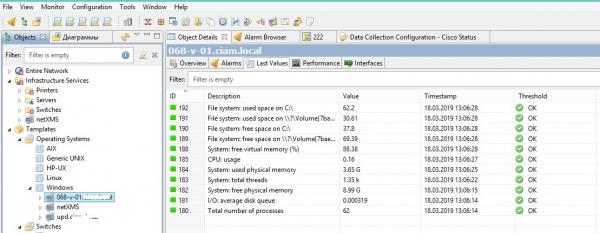
You can add a parameter to track a specific node by clicking "Right-click Data Collection Parameter", then "Right-click in the workspace — New Parameter", and select the desired option from the list. You can also configure triggers for the tracked parameter here.
Importantly, the agents, just like in Zabbix, can execute custom scripts.
How to install?That's off-topic, as everyone... hmm... does as they wish.
The question is — should agents be deployed only on servers or on all machines in the network? If it's just a few servers, it's easiest to do it manually. If there are many, domain policies, KIX, PoSh, whatever works. Agents have a key /SILENT that allows 'injecting' it transparently for the user (if we are talking about deployment on all machines in the network). I prefer scripts because you can set conditions and create a flag, unlike policies that will install the program every time the PC is turned on. So, we write a script like 'check for the flag file, if not present — run the installer with the /SILENT key and after successful installation create the flag file.' Profit.
3.5. Triggers
Triggers can be set up to respond to specific events in the collected data. For example, exceeding a certain ping-pong value to the router. The notification method for each trigger is also configured (for some, an icon in the console is enough, while others immediately send alerts wherever possible). The reaction to the event is chosen from the predefined options in Action Configuration.
To create a trigger: access the Data Collection Configuration of the node or template, double-click on the parameter of interest (if it doesn't exist, it must be created first), and go to the Thresholds tab in the properties, then click the add button.
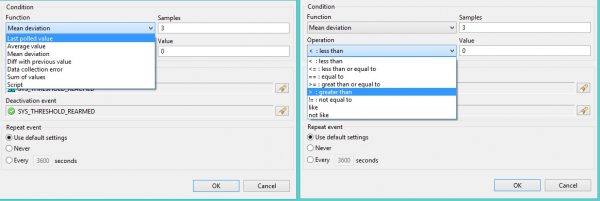
«Function» — which value or values to use for calculating the condition. It can take the following values (the number used for checking is specified in the Samples field):
— Last polled value: the last received value(s)
— Average value: the average of the most recent ones
— Mean deviation: the average deviation
— Diff with previous value: difference with the previous value
— Data collection error: data retrieval error
— Sum of values: sum of values
— Script: value obtained from the execution of a custom script
«Operation» — trigger activation condition. Can take values (value specified in the corresponding Value field):
— < : less than: less than
— <= : less than or equal to: less than or equal to
— == : equal to: equivalent to
— >= : greater than or equal to: greater than or equal to
— > : greater than: greater than
— != : not equal to: not equivalent to
— like: approximately equal to
— not like: not approximately equal to
I am not confident about the last two parameters and how they work. So, I won’t even speculate on what boundaries are built into them.
In short, it's just like in Zabbix, only you don't have to manually enter formulas, fearing mistakes or typos. To restore the trigger (deactivation event), the system will automatically insert the value. (In Zabbix, you still have to type and avoid typos).
3.6. Templates
Right-click - create template, enter the template name. Right-click - Data Collection Configuration.
A Bit of TheoryThe collected information can come from multiple sources. These can be the NetXMS agent, running on the machine, or it could be a “simple request” or “Internal«, sent by the server itself (for example, the same ping), «SNMP«, «check point SNMP«, «Push«, «Windows Performance Counters«, «SM-CLP«, or a custom “a script«. Each type of information allows selecting a type that the system will expect upon retrieval. For instance, ping will return an integer value, the amount of free disk space in bytes will also be integer, but the temperature will not be an integer, meaning it will be real).
For information collection via SNMP in NetXMS, there is an extensive list of predefined parameters, meaning you don’t have to enter a specific OID but can find it in the MIB tree, which is rather complicated in reality… However, ultimately, you will need to dig through the manufacturer's documentation and look for the OID values for each device separately. You can waste a lot of time setting up information retrieval from devices, stumbling upon the system message «UNSUPPORTED», only to find out that this specific device just cannot provide the requested information. Here, all that’s left is to read the manuals and hope.
For example, to collect information about the node's response time (ping), you need to add a new parameter (Right-click - new parameter), in the Origin field select Internal, click the Select button, and choose Ping Time. There is a search function, which I had only dreamed of in Zabbix. It's also worth changing the node polling period (by default it is set to 60 seconds, meaning if the router stops responding just after it was polled by the monitoring system, it will take almost a full minute before the system realizes something is wrong and raises an alarm).
List of Internal data that can be processed:
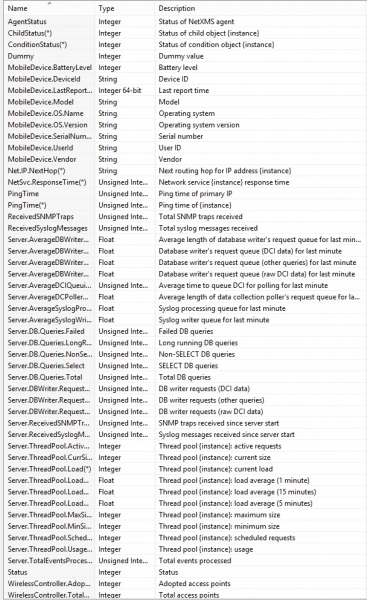
After all the necessary settings have been added to the template, you need to click Right-click - apply and select all nodes to which this template should be applied (ctrl+LMB). That's it. After this, a branch will appear under the template in the tree, which, when expanded, will show all the nodes to which this template has been applied.
When detaching nodes from the template, the collected data does not stop being collected; to cancel their collection, you need to go into Data Collection Configuration for each node and delete everything manually, or first remove the parameters from the template and only then delete the nodes from it. I don’t know why it’s done this way, but to me, it seems extremely strange. But... it is what it is.
In the template, you can select the desired collected data and copy it to another template. In bulk. There’s no need to copy and paste from one template to another by hand... I'm starting to hate Zabbix.
3.7. Dashboards
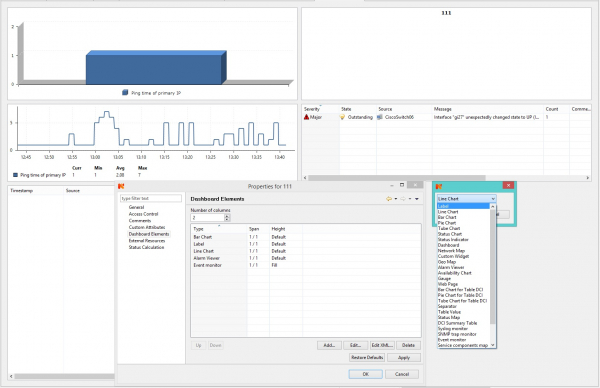
Strangely enough, the NetXMS Wiki contains only one link to YouTube on this topic: , there’s not even a list or description of the elements that can be added to the Dashboard. In principle, everything is intuitively clear. Label — it’s just... well... a Label... I don’t even know how to translate this. In other words, a field with an inscription, used to designate and differentiate elements, since the elements themselves do not contain names. Line Chart — this is a line chart. Bar Chart — this is a chart. Alarm Viewer — a list of alerts for the selected node(s). In other words, the names speak for themselves.
Next, you need to open the dashboard properties and configure the views. We are interested in the Dashboard Elements tab. Number of columns — this is the number of columns, elements that will be arranged horizontally. Each object has its own properties, and I would recommend unchecking the Layout-Grab excessive vertical space option to minimize the size of each element.
3.8. Action Configuration
(Configuration - Actions Configuration)
Essentially, these actions are responses to triggered events.
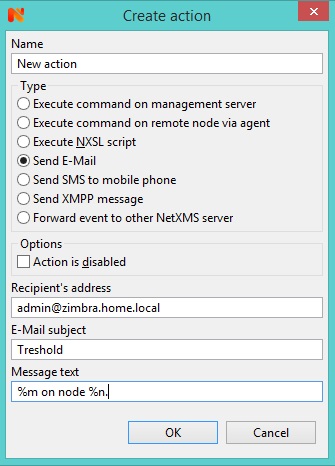
NetXMS can send email, SMS, or XMPP messages in response to a trigger. It's all quite straightforward — just fill in the necessary fields.
You can also:
— Forward a notification to another NetXMS server
— Execute a command on the NetXMS administration server
— Execute a command on a node using the NetXMS agent
— Run an NXSL script (NXSL is the proprietary )
After creating an action, you can set a delay for its execution as well as apply a macro. The delay time is needed to avoid disturbing the operator in case the issue resolves itself (for example, if the response time to a ping request was greater than the set value, but it may return to normal during the next check, so why bother over such trivial matters?).
3.9. Access Rights Management
For each object, specific access rights can be configured. Access rights can also be set for each object within another object. This allows for a very flexible distribution of responsibilities and monitoring capabilities for various user groups. That's all I wanted to say.
4. Conclusion
I would like to refute the title of my own article. NetXMS is not for the lazy. The developers did not emphasize functionality as some others do, but alongside everything else, they also cared about the interface.
Let’s put it this way. I have used both Zabbix and NetXMS. Therefore, I will simply write down my impressions of these two systems.
So.
NetXMS appears to me to be an extremely user-friendly system. Well… for the admin… yes, for the admin. It has what is called an intuitive interface, which is just great. You don’t need to write your own formulas or read a ton of accompanying documentation to enable a ping check to a switch or other simple tasks. However, in Zabbix, that same simple task isn’t much different from something really complicated. So once you master that, you can handle everything else. NetXMS offers hints, and most parameters can be found in the interface; you can select them with your mouse and configure them. In Zabbix, you need to find out if the system can do this or that, and if so, how to write it and what parameters it returns. Zabbix wins in community support and tons of templates for every possible situation… if you can find what you need in that mountain of clutter… On the other hand, NetXMS also has plenty of fans and add-ons created for the system. Moreover, the system out of the box can monitor the most popular applications, as mentioned on the main project page.
The main advantage of NetXMS over Zabbix for me is the ability to run a script on a problematic node in response to a trigger. If the CPU temperature rises above a threshold, it will automatically shut down the host. Then we’ll figure out what the problem is. Perhaps Zabbix has this feature as well, but I couldn’t find it. The same goes for monitoring ports on routers. Here, it’s automatic… Well, as automatic as it gets… You just need to learn the scripting language, and that’s it…
Access rights in NetXMS allow for very flexible segmentation of the capabilities of various users within the system. However, configuring all this requires quite a bit of effort.
Overall, the systems are quite similar, and their capabilities seem comparable at first glance. Although it feels like Zabbix can do more, those capabilities are deeply hidden under the hood and are unreachable for an average admin. NetXMS, on the other hand, appears straightforward and clear, friendly and pleasant.
Zabbix has excellent documentation, a wiki, how-to guides, FAQs, best practices, as well as various forums, etc., where you can find answers to almost all questions. And if not, you can ask your own.
In summary, I would recommend NetXMS for those who are just starting out or for those who do not need to delve deeply into monitoring everything. I believe that with further exploration, it can provide very detailed observations.
However, the main advantage I see is the very pleasant interface and ease of setup.
5. Materials Used
YouTube channel
Source: habr.com
