

I saw a post stating that PVS has learned to analyze under Linux, so I decided to try it on my projects. Here’s what came of it.
Content
Responsive Support
I requested a trial key and received it the same day.
Fairly Clear Documentation
I was able to run the analyzer without any major issues. There is also help available for console commands (although there are some complaints, see the section ).
Multithreaded Analysis Capability
The analyzer has a 'standard' option -j, which allows for parallel analysis in multiple tasks. This greatly saves time.
Good Visualization
There are many different output formats, from text to a small web interface. .
Simple Integration into the Build
All documentation is available on their website; I can say that if your project is built using CMake, it’s all very straightforward.
Good Diagnostic Descriptions
If generating output in the fullhtmlmode, each message has a link to the diagnostic description, with explanations, code examples, and additional links.
The Analyzer's Lack of C++ Language Knowledge
Unfortunately, PVS sometimes misinterprets the syntax and generates false positive messages for completely correct code.
For example, there is a function returning void:
template <typename T>
auto copy (const void * source, void * destination)
    ->
        std::enable_if_t
        <
            std::is_copy_constructible<T>::value
        >
{
    new (destination) T(*static_cast<const T *>(source));
}
Yes, the keyword auto can mean void, that’s what it’s for. autoBut PVS issued the following messages:
dynamic_tuple_management.hpp:29:1: error: V591 Non-void function should return a value.
dynamic_tuple_management.hpp:29:1: error: V2542 Function with a non-void return type should return a value from all exit paths.
Very Slow Website
Yes, in the web interface next to each message there is a link to the corresponding diagnostic description with examples. But when clicking on the link, the wait can be quite long, and sometimes you even get a .
Language
All descriptions are available in Russian, which is great. But the links from the report always lead to the English version. It would be nice to have the option to switch languages so that diagnostics could be viewed in Russian right away. I couldn’t find such an option in the interface.
It’s inconvenient to work with the diagnostic levels through the console.
Let's start with the fact that the two used commands (these are pvs-studio-analyzer and plog-converter) have different formats for specifying diagnostics.
The manual for pvs-studio-analyzer states:
-a [MODE], --analysis-mode [MODE]
    MODE defines the type of warnings:
    1 - 64-bit errors;
    2 - reserved;
    4 - General Analysis;
    8 - Micro-optimizations;
    16 - Customers Specific Requests;
    32 - MISRA.
    Modes can be combined by adding the values
    Default: 4
I struggled for a long time to understand where to add the keys. I tried to list them with commas:
pvs-studio-analyzer analyze ... -a 1,4,16I tried specifying the key several times:
pvs-studio-analyzer analyze ... -a 1 -a 4 -a 16It was only later that I realized that these are bit masks! And I need to sum up, not add the values. For example, to get general diagnostics, diagnostics for micro-optimizations, and MISRA, I need to sum them up (4 + 8 + 32 = 44):
pvs-studio-analyzer analyze ... -a 44Using bit masks in user interfaces is typically considered bad practice. All this could have been summed up internally, while presenting a set of flags to the user.
Moreover, there is another utility plog-converter, which generates human-readable information about static analysis. It has different quirks.
The program manual plog-converter reports:
-a, --analyzer            Specifies analyzer(s) and level(s) to be
                          used for filtering, i.e.
                          'GA:1,2;64:1;OP:1,2,3;CS:1;MISRA:1,2'
                          Default: GA:1,2
Some 'levels' appeared here that were nowhere else before, and I found nothing about them in the documentation.
In general, it's unclear. That's why I set everything to the maximum.
A bunch of pointless warnings on Catch
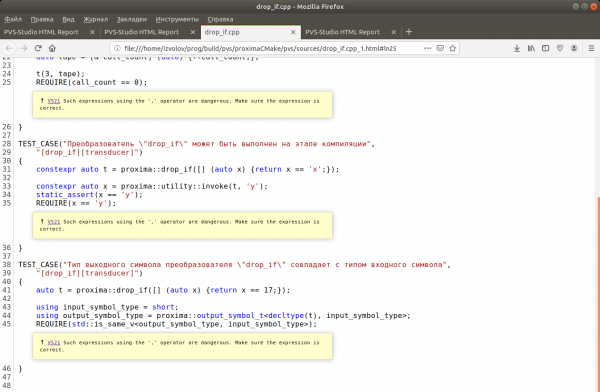
In two of the three projects I analyzed, the modular testing library . And the lion's share of messages (!!! 90 out of 138 in one and 297 out of 344 in another !!!) look like this:
Does not account for multithreading
Many false positives about supposedly unchanged variables or infinite loops, while operations with those variables occur from different threads, and if it weren't for that, the unit tests wouldn't have triggered.
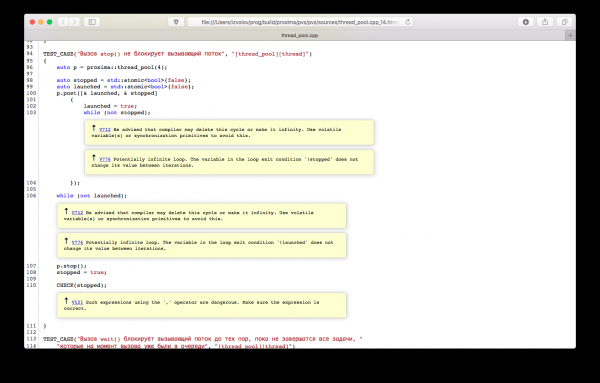
However, can a static analyzer actually account for such conditions? I don't know.
PVS didn't find any real errors in my open projects and , as well as in a work project that, for obvious reasons, I cannot disclose. However, it should be noted that some issues were already caught and fixed earlier using and .
Overall, the impression from all these analyzers is quite similar: yes, they catch something, sometimes even something important, but overall, a compiler is sufficient.
Perhaps (and I personally like to think so), our team uses software development practices that allow us to generate minimal amounts of bad code. It’s better to avoid problems than to heroically overcome them.
Therefore, I take the liberty to provide a few tips on how to write in C++ so that you don't shoot yourself in the foot or get hit by rakes.
Maximize compiler diagnostics
Our team uses (and recommends) the following compilation options:
-Werror

-Wall
-Wextra
-Wpedantic

-Wcast-align
-Wcast-qual
-Wconversion
-Wctor-dtor-privacy
-Wenum-compare
-Wfloat-equal
-Wnon-virtual-dtor
-Wold-style-cast
-Woverloaded-virtual
-Wredundant-decls
-Wsign-conversion
-Wsign-promo
Include them in your project, and you will learn a lot about your code.
Adhere to the standard
Try not to use platform-dependent things if standard alternatives are available, and if you absolutely must use them, wrap them in special blocks under macros (or in another way) and simply do not allow your code to compile in unsupported conditions.
Stick to the standard semantics of operations
Addition should be addition, multiplication should be multiplication, a function call should be a function call, copying should copy, moving should move, a container should be iterable, and an iterator should have increment ++ and dereferencing. *. And so on, and so forth.
I think the point is clear. There are established conventions that are not mandatory but are expected to be seen by all users and readers of your code. Don't try to outsmart others, or you might just outsmart yourself.
Write compatible code
First of all, I mean the standard library. It is highly desirable that the interfaces of your classes and functions be usable with standard and other libraries (such as Boost).
Don't hesitate to look at the interfaces of STL and Boost. With rare exceptions, you will find worthy examples to follow there.
Make full use of open tools
For the same static analysis, there are at least two open-source tools available for free that can connect to any project using the CMake build system.
.
Lastly, I want to emphasize that I am not advocating against using PVS or any other static analyzers. However, I encourage you to consider how it is that a static analyzer continually finds significant errors in your code.
This is merely a consequence. It is essential to search for and address the root cause.
Source: habr.com
