


Currently, more and more companies are migrating their infrastructure from physical servers and private virtual machines to the cloud. This decision is easy to explain: there is no need to worry about hardware, the cluster can be configured in many different ways... and most importantly, existing technologies (like Kubernetes) allow for easy scaling of computing power based on load.
The financial aspect is always important. The tool discussed in this article aims to help reduce budgets when using cloud infrastructure with Kubernetes.
Introduction
— a California startup founded by former Google employees, creating a solution for calculating infrastructure costs in cloud services (within a Kubernetes cluster + shared resources), identifying bottlenecks in cluster configurations, and sending corresponding notifications to Slack.
We have clients using Kubernetes in both familiar clouds like AWS and GCP, as well as in the less common Azure for the Linux community — in general, on all platforms supported by Kubecost. For some of them, we track costs for in-cluster services independently (using a methodology similar to that used by Kubecost) and also monitor infrastructure expenses to optimize them. Therefore, it makes sense that we were interested in the possibility of automating such tasks.
The source code of the main Kubecost module is open under the Open Source license (Apache License 2.0). It can be used freely, and the available features should be sufficient for small projects. However, business is business: the rest of the product is closed and can be accessed through , which also include commercial support. Additionally, the authors offer a free license for small clusters (1 cluster with up to 10 nodes — at the time of writing, this limit has expanded to 20 nodes) or a trial period with full capabilities for 1 month.
How Everything Works
So, the main part of Kubecost is an application , written in Go. The Helm chart describing the entire system is called and essentially is an assembly of cost-model with Prometheus, Grafana, and several dashboards.
Generally speaking, the cost model has its own web interface that displays graphs and detailed statistics on expenses in tabular form, as well as, of course, tips for optimizing costs. The dashboards presented in Grafana are an earlier stage of Kubecost’s development and contain largely the same data as the cost model, supplemented by familiar statistics on CPU/memory/network/storage space usage in the cluster and its components.
How does Kubecost work?
- The cost model obtains service prices through the APIs of cloud providers.
- Next, based on the hardware type of the node and the region, the cost is calculated by nodes.
- Based on the cost of node operations, each individual pod receives a cost per hour for CPU usage, memory consumption, and the cost per hour for storing a gigabyte of data—dependent on the node it operated on or the storage class.
- From the cost of individual pods, payments are calculated for namespaces, services, Deployments, and StatefulSets.
- To calculate statistics, metrics provided by kube-state-metrics and node-exporter are used.
It is important to note that Kubecost by default considers only resources available in Kubernetes. External databases, GitLab servers, S3 storage, and other services not present in the cluster (even if they are in the same cloud) are not visible to it. However, for GCP and AWS, you can add the keys of your service accounts to calculate everything together.
Installation
For Kubecost to function, the following are required:
- Kubernetes version 1.8 and above;
- kube-state-metrics;
- Prometheus;
- node-exporter.
It turned out that in our clusters all these conditions were already met, so it was sufficient to specify the correct endpoint for access to Prometheus. Nevertheless, the official Helm chart for kubecost contains everything necessary to run on a "bare" cluster.
Kubecost can be installed in several ways:
- The standard installation method, described in on the developer's website. You need to add the cost-analyzer Helm repository, after which install the chart. You will only need to port forward and adjust the settings to your desired state manually (via kubectl) and/or using the cost model's web interface.
We haven't tried this method as we don't use third-party pre-configured setups, but it seems like a good option to "just try for yourself." If you already have some components of the system installed or want more refined adjustments, it’s better to consider the second approach.
- Essentially use , but configure and install it yourself in any convenient way.
As mentioned, in addition to kubecost itself, this chart contains the Grafana and Prometheus charts, which can also be customized to your liking.
The chart has
values.yamlfor cost-analyzer, allowing you to configure:- the list of cost-analyzer components to be deployed;
- your endpoint for Prometheus (if you already have one);
- domains and other ingress settings for cost-model and Grafana;
- annotations for pods;
- the need for persistent storage and its size.
A complete list of available configuration options with descriptions is available in .
Since kubecost does not restrict access in its basic variant, you'll need to set up basic-auth for the web panel right away.
- Install just the core system — cost-model. To do this, you must have Prometheus installed in the cluster and specify the corresponding value of its address in the variable
prometheusEndpointfor Helm. After that, apply in the cluster.Again, you will have to manually add Ingress with basic-auth. Finally, you’ll need to add a section for collecting metrics from the cost-model in
extraScrapeConfigsin the Prometheus config:- job_name: kubecost honor_labels: true scrape_interval: 1m scrape_timeout: 10s metrics_path: /metrics scheme: http dns_sd_configs: - names: - type: 'A' port: 9003
What do we get?
With a full installation, we have the kubecost web panel and Grafana with a set of dashboards at our disposal.
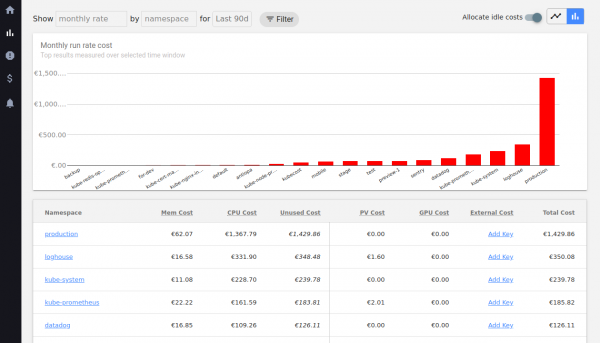
Total cost, displayed on the main screen, actually shows the estimated cost of resources for the month. This is a projected price reflecting the cost of using the cluster (monthly) at the current level of resource consumption.
This metric is more for analyzing expenses and optimizing them. It’s not very convenient to view total expenses for an abstract July in kubecost; you will need to go to billing. However, you can view expenses broken down by namespaces, labels, and pods over 1/2/7/30/90 days, which billing will never show you.
Speaking of labelsFirst, you should go to the settings and set the names of the labels that will be used as additional categories for grouping costs:
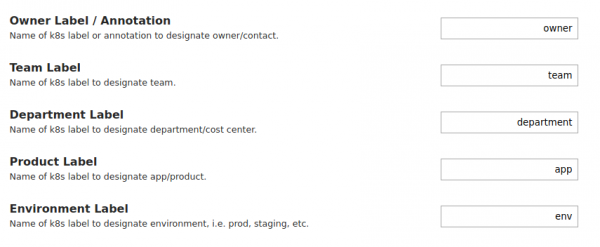
Any labels can be attached to them—this is convenient if you already have your own labeling system.
You can also change the API endpoint address that the cost model connects to, set the discount size in GCP, and establish your own prices for resources and currency for measurement (this feature surprisingly does not affect Total cost).
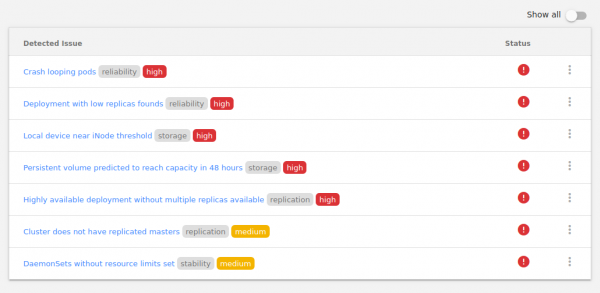
Kubecost can display various issues in the cluster (and even alert in case of danger). Unfortunately, the option is not configurable, so if you have environments for developers in use, you might constantly see something like this:
An important tool— Cluster Savings. It measures the activity of pods (resource consumption, including network), and also calculates how much money can be saved and on what.
It may seem that the optimization tips are quite obvious; however, experience shows that there are still details to pay attention to. Specifically, the network activity of pods is monitored (Kubecost suggests focusing on inactive ones), it compares requested and actual memory and CPU usage, as well as CPU used by cluster nodes (suggests collapsing several nodes into one), disk load, and a few dozen other parameters.
As with any topic related to optimization, one should approach resource optimization based on Kubecost data with caution. For example, Cluster Savings suggests deleting nodes, claiming it's safe, but does not take into account the presence of node-selectors and taints deployed on them that are not present on other nodes. Moreover, even the product authors in their (by the way, it may turn out to be quite useful for those interested in the project) recommend against diving headfirst into cost optimization and advise approaching the issue thoughtfully.
Summary
After using Kubecost for a month on a couple of projects, we can conclude that it is an interesting (and also easy to learn and install) tool for analyzing and optimizing costs for cloud provider services used for Kubernetes clusters. The calculations are quite accurate: in our experiments, they matched what the providers actually required.
There are also some downsides: there are minor bugs, and the functionality does not fully meet the specific needs of some projects. However, if you need to quickly understand where the money is going and what can be 'cut' to consistently reduce the cloud services bill by 5-30% (as was the case for us), this is an excellent option.
P.S.
Also read in our blog:
- «»;
- «»;
- «».
Source: habr.com
