

Aloha, people! My name is Oleg Anastasiev, and I work at Odnoklassniki in the Platform team. Besides me, Odnoklassniki has a lot of hardware. We have four data centers with about 500 racks containing over 8,000 servers. At a certain point, we realized that implementing a new management system would allow us to utilize our hardware more efficiently, ease access management, automate (re)distribution of computing resources, accelerate the launch of new services, and speed up responses to large-scale emergencies.
So what came out of this?
In addition to me and all the hardware, there are also people who work with this hardware: engineers directly in the data centers; network specialists who configure network infrastructure; admins, or SREs, who ensure the resilience of the infrastructure; and development teams, each responsible for part of the portal's functions. The software they create works something like this:
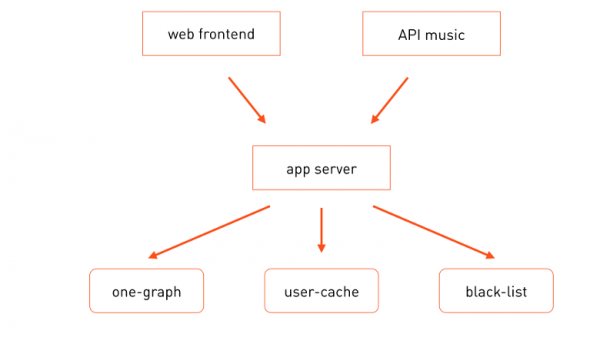
User requests come in both to the front ends of the main portal , and to others, such as the music API front ends. To handle business logic, they call an application server, which, when processing the request, invokes the necessary specialized microservices — one-graph (social connection graph), user-cache (user profile cache), etc.
Each of these services is deployed across multiple machines, with responsible developers overseeing the functioning of modules, their operation, and technological development. All these services run on dedicated servers, and until recently, we ran exactly one task per server, meaning it was specialized for a specific task.
Why is that? This approach had several advantages:
- It simplifies mass management. For instance, if a task requires certain libraries or specific settings, the server is assigned to one specific group, and a cfengine policy for that group is defined (or already exists), and this configuration is centrally and automatically deployed to all servers in that group.
- It simplifies diagnosticsSuppose you are observing high CPU load and realize that only the task running on this hardware could have generated that load. The search for the culprit ends very quickly.
- It simplifies monitoringIf something is wrong with the server, the monitor indicates it, and you know exactly who is to blame.
A service consisting of several replicas is assigned several servers—one for each. So it is very simple to allocate computational resources for the service: it can consume as much as there are servers available. 'Simple' here does not mean that it is easy to use, but rather that resource allocation occurs manually.
This approach also allowed us to create specialized hardware configurations for the task being executed on this server. If the task stores large volumes of data, we use a 4U server with a chassis for 38 disks. If the task is purely computational, we can purchase a cheaper 1U server. This is efficient in terms of computational resources. This approach also allows us to use four times fewer machines under a load comparable to that of a friendly social network.
Such efficient use of computational resources should also ensure economic efficiency, based on the premise that the most expensive are the servers. For a long time, hardware was the most expensive component, and we invested a lot of effort in reducing hardware costs by devising algorithms for fault tolerance to lower equipment reliability requirements. Today, we have reached a point where the cost of a server is no longer the determining factor. If we exclude the latest exotic options, the specific configuration of servers in the rack no longer matters. Now we face another problem—the cost of the space occupied by the server in the data center, i.e., rack space.
Realizing this, we decided to calculate how effectively we use racks.
We took the price of the most powerful server from a cost-effective perspective, calculated how many such servers we could fit in racks, how many tasks we would run on them based on the old model of 'one server = one task,' and how well those tasks could utilize the equipment. After crunching the numbers, we were shocked. It turns out that our rack utilization efficiency is around 11%. The conclusion is clear: we need to improve data center utilization. The solution seems obvious: we should run multiple tasks on a single server. But that's where complications arise.
Mass configuration becomes significantly more complex — it's now impossible to assign a specific group to a server. After all, multiple tasks from different teams can run on the same server. Furthermore, the configuration may conflict for different applications. Diagnostics also become more complicated: if you notice increased CPU or disk usage on a server, you can't determine which task is causing the trouble.
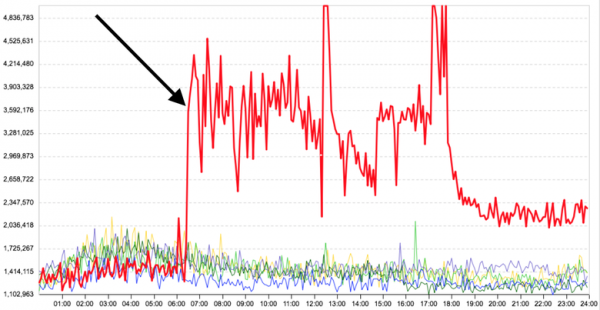
But the main issue is that there is no isolation between tasks running on the same machine. For instance, here's a graph showing the average response time of a server task before and after launching another unrelated computational application on the same server — the response time for the primary task significantly increased.
Clearly, tasks should be run either in containers or in virtual machines. Since nearly all our tasks run under a single OS (Linux) or are adapted for it, we don't need to support multiple operating systems. Therefore, virtualization isn't necessary; due to the added overhead, it will be less efficient than containerization.
As a container implementation for running tasks directly on servers, Docker is a good candidate: filesystem images effectively address issues with conflicting configurations. Being able to compose images from multiple layers allows us to significantly reduce the amount of data required for deployment across the infrastructure by isolating common parts into separate base layers. This way, the base (and largest) layers can be quickly cached across the infrastructure, and only small layers need to be transmitted for delivering various types of applications and versions.
Additionally, the ready-made registry and image tagging in Docker provide us with primitives for versioning and delivering code to production.
Docker, like any other similar technology, offers us a certain level of container isolation out of the box. For example, memory isolation—each container is assigned a limit on the machine's memory usage, which it cannot exceed. It is also possible to isolate containers by CPU usage. However, for us, the standard isolation was insufficient. But more on that below.
Directly launching containers on servers is only part of the issue. Another part revolves around placing containers onto servers. We need to understand which container can be placed on which server. This isn't a simple task, as containers must be arranged on servers as densely as possible without compromising their performance. Such placement can also be complex from a fault tolerance perspective. Often, we want to place replicas of the same service across different racks or even different data center rooms, so that if one rack or room fails, we don’t lose all replicas of the service at once.
Manually distributing containers is not an option when you have 8,000 servers and 8,000 to 16,000 containers.
Moreover, we wanted to give developers more autonomy in resource distribution, allowing them to place their services in production without administrator assistance. At the same time, we wanted to maintain control to ensure that no minor service consumed all resources in our data centers.
Clearly, a management layer is needed to handle this automatically.
Here we arrive at a simple and clear picture that all architects love: three squares.
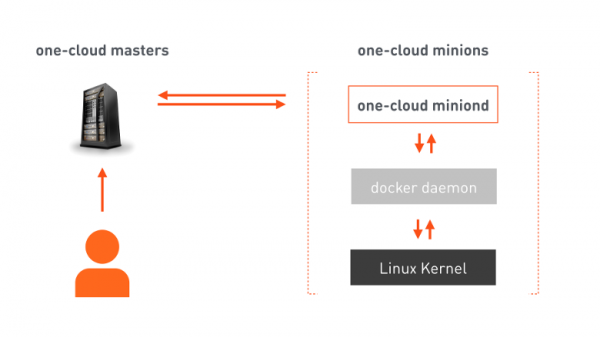
one-cloud masters — a fault-tolerant cluster responsible for orchestrating the cloud. The developer sends a manifest to the master, containing all the necessary information for deploying the service. The master then issues commands to the selected minions (machines designated for running containers) based on that information. The minions have our agent, which receives the command, issues its commands to Docker, and Docker configures the Linux kernel to run the corresponding container. In addition to executing commands, the agent continuously reports to the master about the state changes of both the minion machines and the containers running on them.
Resource allocation
Now let's tackle the more complex task of resource allocation for multiple minions.
In one-cloud, the computing resource is:
- The processing power of the CPU consumed by a specific task.
- The amount of memory available to the task.
- Network traffic. Each minion has a specific network interface with limited bandwidth, so tasks cannot be allocated without considering the volume of data they transmit over the network.
- Disks. Besides, obviously, the space for the task's data, we also allocate the type of disk: HDD or SSD. Disks can serve a finite number of requests per second — IOPS. Therefore, for tasks that generate more IOPS than a single disk can handle, we also allocate 'spindles' — that is, disk devices that must be exclusively reserved for the task.
So for a service, for example, for user-cache, we can record the consumed resources this way: 400 CPU cores, 2.5 TB of memory, 50 Gbit/s traffic in both directions, 6 TB of space on HDD, distributed across 100 spindles. Or in a more familiar format:
alloc:
    cpu: 400
    mem: 2500
    lan_in: 50g
    lan_out: 50g
    hdd:100x6T
The resources of the user-cache service consume only a portion of all available resources in the production infrastructure. Therefore, we want to ensure that suddenly, due to an operator's mistake or not, user-cache does not consume more resources than it is allocated. That is, we need to limit the resources. But what could we tie the quota to?
Let's return to our greatly simplified interaction scheme of components and redraw it with more details — like this:
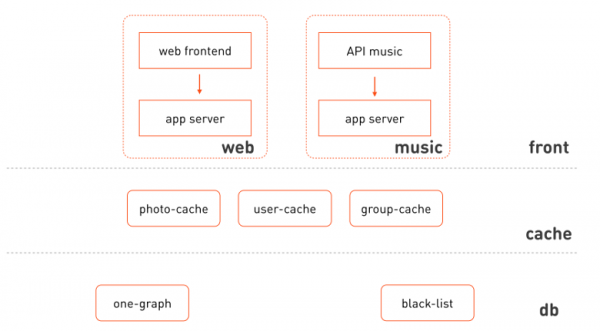
What stands out:
- The web frontend and music use isolated clusters of the same application server.
- We can identify logical layers that include these clusters: fronts, caches, storage, and data management layers.
- The frontend is heterogeneous; it consists of different functional subsystems.
- Caches can also be spread across the subsystem whose data they cache.
Let's redraw the picture again:
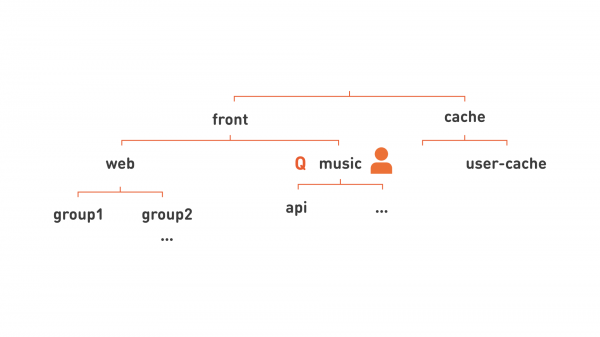
Wow! We see a hierarchy! This means we can allocate resources in larger chunks: assign a responsible developer to a node of this hierarchy corresponding to the functional subsystem (like 'music' in the picture), and bind a quota to this level of the hierarchy. Such a hierarchy also allows us to flexibly organize services for better management. For example, all web services, as this is a very large grouping of servers, are divided into several smaller groups, shown in the picture as group1, group2.
Removing unnecessary lines, we can write each node of our diagram in a flatter form: group1.web.front, api.music.front, user-cache.cache.
This brings us to the concept of a 'hierarchical queue.' It has a name, like 'group1.web.front.' A quota for resources and user rights is assigned to it. A DevOps person will be given rights to submit a service to the queue, and such an employee can launch something in the queue, while an OpsDev person will have admin rights, allowing them to manage the queue, assign people to it, grant rights to these individuals, etc. Services launched in this queue will execute within the quota of the queue. If the computational quota of the queue is insufficient for the simultaneous execution of all services, they will execute sequentially, thus forming the queue itself.
Let's consider the services in more detail. A service has a full name that always includes the name of the queue. So the web frontend service will have the name ok-web.group1.web.front. And the application server service that it interacts with will be named ok-app.group1.web.frontEach service has a manifest that specifies all the necessary information for deployment on specific machines: how many resources the task consumes, what configuration it needs, how many replicas should exist, and the properties for fault handling of that service. Once the service is deployed on the machines, its instances appear. They are also uniquely named — as the instance number and the service name: 1.ok-web.group1.web.front, 2.ok-web.group1.web.front, …
This is very convenient: looking only at the name of the running container, we can immediately learn a lot.
Now let's get to know what these instances actually perform: the tasks.
Task Isolation Classes
All tasks in OK (and probably everywhere) can be divided into groups:
- Low Latency Tasks — prod. For such tasks and services, response latency is crucial; how quickly each request will be processed by the system. Examples of tasks include: web front-ends, caches, application servers, OLTP storage, and more.
- Batch Processing Tasks — batch. Here, the processing speed of each specific request is not important. What matters is how much computation this task will achieve over a defined (large) period (throughput). Such tasks include any MapReduce tasks, Hadoop, machine learning, statistics.
- Background Tasks — idle. For such tasks, neither latency nor throughput is very important. This includes various tests, migrations, recalculations, conversions of data from one format to another. On one hand, they are similar to batch tasks; on the other hand, we don’t care much about how quickly they finish.
Let’s look at how such tasks consume resources, for example, CPU.
Tasks with Low Latency. The consumption pattern of CPU for such a task will look like this:
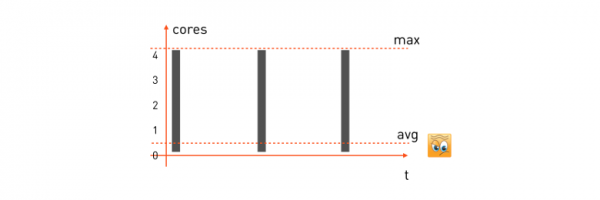
A request from a user arrives, the task starts using all available CPU cores, processes, returns a response, waits for the next request, and stands by. The next request arrives — again, it utilizes everything available, processes, and waits for the next.
To guarantee minimal latency for such a task, we need to take the maximum resources it consumes and reserve the necessary number of cores on the minion (the machine that will perform the task). Then the reservation formula for our task will be as follows:
alloc: cpu = 4 (max)If we have a minion machine with 16 cores, we can allocate exactly four such tasks on it. Notably, the average CPU consumption for these tasks is often very low — which is obvious, since a significant portion of the time the task is waiting for a request and doing nothing.
Computational tasks. Their pattern will be somewhat different:
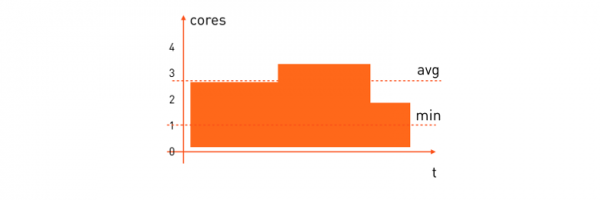
The average CPU resource consumption for these tasks is quite high. Often, we want the computational task to be completed within a certain timeframe, so we need to reserve the minimum number of processors it requires to finish all calculations in an acceptable time. Its reservation formula will look like this:
alloc: cpu = [1,*)"Please place it on a minion where there is at least one free core, and beyond that, it will consume whatever is available."
Here, the efficiency of resource utilization is already significantly better than with tasks that have a short delay. However, the gain will be much greater if we combine both types of tasks on one minion machine and distribute its resources on the fly. When a short-delay task requires CPU, it gets it immediately, and when resources are no longer needed, they are passed to the computational task, i.e., something like this:
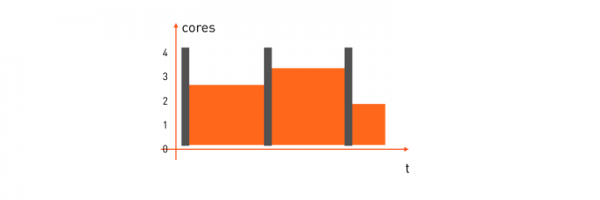
But how to do this?
First, let's deal with prod and its alloc: cpu = 4. We need to reserve four cores. In Docker run, this can be done in two ways:
- Using the option
--cpuset=1-4, i.e., allocate four specific cores for the task on the machine. - Use
--cpuquota=400_000 --cpuperiod=100_000, to set a quota on CPU time, meaning indicating that every 100 ms of real time, the task will consume no more than 400 ms of CPU time. This results in the same four cores.
But which of these methods is suitable?
Cpuset looks quite attractive. The task has four dedicated cores, which means the CPU caches will operate at maximum efficiency. However, there is a downside: we would have to take on the challenge of distributing computations across the underutilized cores of the machine instead of the operating system, and that's quite a non-trivial task, especially if we try to run batch tasks on such a machine. Tests have shown that the quota option works better here: this way, the operating system has more freedom in choosing a core to execute a task at any given moment, and CPU time is distributed more efficiently.
Let's figure out how to reserve the minimum number of cores in Docker. The quota for batch tasks is already not applicable because it's not necessary to limit the maximum; it's sufficient to just guarantee a minimum. Here, the option works well docker run --cpushares.
We agreed that if a batch requires a guarantee of at least one core, we specify --cpushares=1024, and if a minimum of two cores is needed, we specify --cpushares=2048. CPU shares do not interfere with the distribution of CPU time as long as there is enough of it. Thus, if the production task is not using all four of its cores at the moment, nothing restricts the batch tasks, and they can utilize the additional CPU time. However, in a situation of CPU shortage, if the production task consumes all four cores and reaches the quota—the remaining CPU time will be divided proportionally based on cpushares. In a scenario with three free cores, one core will be allocated to the task with 1024 cpushares, and the other two will be allocated to the task with 2048 cpushares.
But using quotas and shares is not enough. We need to ensure that the low-latency task gets priority over the batch task when distributing CPU time. Without such prioritization, the batch task will consume all CPU time at the moment it is needed by production. Docker run has no options for container prioritization, but the CPU scheduler policies in Linux come to the rescue. You can read more about them in detail , and in this article, we will briefly cover them:
- SCHED_OTHER
By default, all ordinary user processes on a Linux machine receive this. - SCHED_BATCH
Designed for resource-intensive processes. When a task is assigned to the processor, a so-called activation penalty is introduced: such a task is less likely to receive processor resources if a task with SCHED_OTHER is currently using them. - SCHED_IDLE
A background process with a very low priority, even lower than nice -19. We are using our open-source library , to set the necessary policy when launching the container by calling
one.nio.os.Proc.sched_setscheduler( pid, Proc.SCHED_IDLE )But even if you are not programming in Java, the same can be done with the chrt command:
chrt -i 0 $pidLet's summarize all our isolation levels in one table for clarity:
Isolation Class
Example alloc
Docker run options
sched_setscheduler chrt*
Prod
cpu = 4
--cpuquota=400000 --cpuperiod=100000
SCHED_OTHER
Batch
Cpu = [1, * )
--cpushares=1024
SCHED_BATCH
Idle
Cpu= [2, *)
--cpushares=2048
SCHED_IDLE
*If you invoke chrt from inside the container, you may need the sys_nice capability, because by default Docker removes this capability when launching a container.
However, tasks consume not only processor resources but also traffic, which affects the latency of network tasks even more than improper distribution of processor resources. Therefore, we naturally want to obtain exactly the same picture for traffic. That is, when a prod task sends packets over the network, we put a quota on the maximum speed (formula alloc: lan=[*,500mbps) ), with which prod can do this. And for batch, we guarantee only the minimum bandwidth but do not limit the maximum (formula alloc: lan=[10Mbps,*) ) In this case, prod traffic should take priority over batch tasks.
Here, Docker does not have any primitives that we could use. However, we are aided by . We were able to achieve the desired result using the discipline of . With its help, we allocate two classes of traffic: high-priority prod and low-priority batch/idle. As a result, the configuration for outgoing traffic turns out to be as follows:
here 1:0 — 'root qdisc' discipline hsfc; 1:1 — child class hsfc with a common bandwidth limit of 8 Gbit/s, under which are placed the child classes of all containers; 1:2 — child class hsfc common for all batch and idle tasks with a 'dynamic' limit, which is discussed below. The other child classes hsfc are dedicated classes for currently running prod-containers with limits corresponding to their manifests — 450 and 400 Mbit/s. Each hsfc class is assigned a qdisc queue fq or fq_codel, depending on the Linux kernel version, to avoid packet loss during traffic spikes.
Usually, tc disciplines serve to prioritize only outgoing traffic. But we want to prioritize incoming traffic as well — after all, some batch task can easily consume the entire incoming channel, for example, receiving a large packet of incoming data for map&reduce. For this, we use the module , which creates a virtual interface ifbX for each network interface and redirects incoming traffic from the interface to outgoing on ifbX. Then, all the same disciplines are applied to ifbX for controlling outgoing traffic, for which the hsfc configuration will be very similar:
In our experiments, we found that hsfc shows the best results when the class 1:2 of the non-prioritized batch/idle traffic is limited on minion machines to a certain free bandwidth. Otherwise, the non-prioritized traffic significantly affects the latency of prod-tasks. The current value of the free bandwidth is determined by miniond every second by measuring the average traffic consumption by all prod-tasks of this minion  and subtracting it from the bandwidth of the network interface
  with a small margin, i.e.

Bandwidths are determined for incoming and outgoing traffic independently. And according to the new values, miniond reconfigures the limit of the non-prioritized class 1:2.
Thus, we implemented all three isolation classes: prod, batch, and idle. These classes significantly affect the performance characteristics of the tasks. Therefore, we decided to place this attribute at the top of the hierarchy, so that at a glance at the name of the hierarchical queue it is clear what we are dealing with:
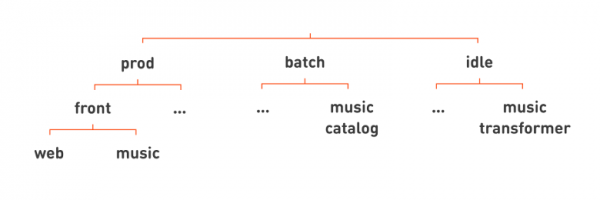
All our familiar web and music fronts are then placed in the hierarchy under prod. For example, under batch let's place the service music catalog, which periodically creates a catalog of tracks from a set of uploaded mp3 files in 'Odnoklassniki'. An example of a service under idle could be music transformer, normalizing the volume level of the music.
By removing unnecessary lines again, we can write the names of our services more flatly, adding the task isolation class at the end of the full service name: web.front.prod, catalog.music.batch, transformer.music.idle.
And now, looking at the service name, we understand not only what function it performs but also its isolation class, meaning its criticality, etc.
Everything is great, but there is one bitter truth. It is impossible to fully isolate tasks running on the same machine.
What we have achieved: if the batch task intensely consumes only CPU resources, the built-in Linux CPU scheduler handles its task very well, and there is practically no impact on the prod task. But if this batch task starts actively working with memory, mutual influence begins to manifest. This happens because the CPU caches of memory for the prod task are 'drained' — as a result, cache misses increase, and the processor processes the prod task more slowly. Such a batch task can increase the latency of our typical prod container by 10%.
Isolating traffic is even more challenging because modern network cards have an internal packet queue. If a packet from a batch task gets there first, it will be sent over the cable first, and there's nothing you can do.
Moreover, we have only managed to solve the problem of prioritizing TCP traffic: the hsfc approach does not work for UDP. And even in the case of TCP traffic, if the batch task generates a lot of traffic, it also leads to about a 10% increase in the latency of the prod task.
Fault tolerance
One of the goals in developing one-cloud was to improve the fault tolerance of Odnoklassniki. Therefore, I would like to take a closer look at possible failure and disaster scenarios. Let's start with a simple scenario — the failure of a container.
A container can fail in several ways. It could be an experiment, a bug, or an error in the manifest causing the prod task to consume more resources than specified. We had a case where a developer implemented a complex algorithm, revised it many times, overcomplicated it, and got to a point where the task ended up looping rather non-trivially. Since the prod task is prioritized over all others on the same minions, it began consuming all available CPU resources. In this situation, isolation helped, specifically the CPU time quota. If a task has a quota assigned, it will not consume more. Therefore, batch and other prod tasks running on the same machine noticed nothing unusual.
The second possible issue is the container crashing. Here, restart policies come to the rescue, as everyone knows; Docker handles it well. Almost all prod tasks have a restart policy of always. Sometimes we use on_failure for batch tasks or for debugging prod containers.
What can be done if an entire minion becomes unavailable?
Obviously, we can run the container on another machine. The interesting part here is what happens to the IP address(es) assigned to the container.
We can assign containers the same IP addresses as the minion machines on which they are running. Then, when a container is started on another machine, its IP address changes, and all clients must recognize that the container has moved, and now they must access the container at a new address, which requires a separate service for Service Discovery.
Service Discovery is convenient. There are many solutions on the market of varying degrees of fault tolerance for organizing service registries. Often, these solutions implement load balancer logic, store additional configuration in the form of key-value stores, etc.
However, we would like to avoid the need to implement a separate registry, as that would mean introducing a critical system used by all services in production. Thus, it becomes a potential point of failure, and one must choose or develop a very fault-tolerant solution, which, obviously, is very challenging, time-consuming, and costly.
Another significant drawback is that for our old infrastructure to work with the new one, we would have to rewrite absolutely all tasks to utilize some Service Discovery system. The amount of work involved is ENORMOUS, and in some cases it becomes almost impossible, especially when dealing with low-level devices that operate at the OS kernel level or interact directly with the hardware. Implementing this functionality using established solution patterns, such as would mean additional load in some areas and would complicate operations and introduce additional failure scenarios. We did not want to complicate matters, so we decided to make the use of Service Discovery optional.
In one-cloud, the IP follows the container, meaning each task instance has its own IP address. This address is 'static': it is assigned to each instance at the moment of the first deployment of the service into the cloud. If during its lifecycle, the service had a varying number of instances, then ultimately it will hold as many IP addresses as there were maximum instances.
Afterwards, these addresses do not change: they are assigned once and continue to exist for the entire lifecycle of the service in production. The IP addresses follow the containers across the network. If a container is moved to another minion, the address will transfer with it.
Thus, the mapping of the service name to its list of IP addresses changes very rarely. If we look again at the names of the service instances mentioned at the beginning of the article (1.ok-web.group1.web.front.prod, 2.ok-web.group1.web.front.prod, …), then we will notice that they resemble FQDNs used in DNS. Indeed, to display service instance names in their IP addresses, we use the DNS protocol. This DNS returns all reserved IP addresses for all containers—both running and stopped (let's say three replicas are in use, but we have five reserved addresses—all five will be returned). Clients, upon receiving this information, will attempt to connect to all five replicas and thus determine which ones are operational. This method of identifying availability is significantly more reliable, as it does not involve DNS or Service Discovery, eliminating the challenging issues of maintaining information accuracy and the fault tolerance of these systems. Moreover, in critical services on which the entire portal depends, we can avoid using DNS altogether and simply hardcode the IP addresses into the configuration.
Implementing such IP migration behind containers can be non-trivial—let's look at how this works through the following example:
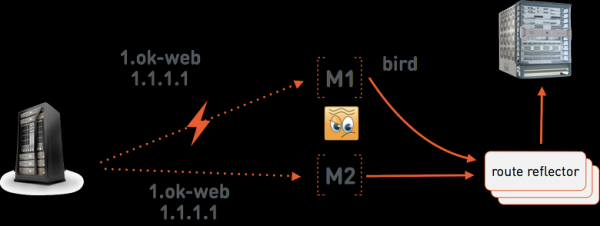
Suppose, the one-cloud master instructs minion M1 to launch 1.ok-web.group1.web.front.prod with the address 1.1.1.1. On the minion, there operates , which announces this address to special servers . These have a BGP session with the network device, which transmits the route for the address 1.1.1.1 to M1. M1 then routes packets into the container using Linux tools. There are three route reflector servers, as this is a very critical part of the one-cloud infrastructure—without them, the network in one-cloud will not function. We position them in different racks, preferably located in different data center halls, to reduce the likelihood of all three failing simultaneously.
Now let’s assume that the connection between the one-cloud master and minion M1 is lost. The one-cloud master will now act under the assumption that M1 has completely failed. That is, it will instruct minion M2 to launch web.group1.web.front.prod with the same address 1.1.1.1. Now we have two conflicting routes in the network for 1.1.1.1: on M1 and M2. To resolve such conflicts, we use the Multi Exit Discriminator, specified in the BGP announcement. This number indicates the weight of the announced route. The route with the lower MED value will be chosen from the conflicting ones. The master one-cloud supports MED as an integral part of container IP addresses. The address is initially issued with a sufficiently high MED = 1,000,000. In the case of such a failover of the container, the master reduces the MED, and M2 will then be instructed to announce the address 1.1.1.1 with MED = 999,999. The instance running on M1 will remain without connectivity, and we are little concerned about its fate until connectivity with the master is restored, at which point it will be shut down as an old duplicate.
Failures
All data center management systems always adequately handle minor failures. Container outages are normal almost everywhere.
Let's consider how we handle a failure, such as a power outage in one or more data center halls.
What does a failure mean for a data center management system? First and foremost, it is a massive simultaneous failure of many machines, and the management system needs to migrate a very large number of containers simultaneously. But if the failure is extensive, it may happen that not all tasks can be relocated to other minions, because the resource capacity of the data center drops below 100% load.
Often, failures are accompanied by the failure of the management layer as well. This can happen due to the malfunction of its equipment, but more often because failures are not tested, and the management layer itself crashes under the increased load.
What can be done about all this?
Mass migrations mean that a large number of actions, migrations, and placements occur within the infrastructure. Each migration may take some time, necessary for delivering and unpacking the container images to the minions, launching and initializing the containers, etc. Therefore, it is preferable that more important tasks are launched before less important ones.
Let's take another look at our familiar hierarchy of services and try to decide which tasks we want to launch first.
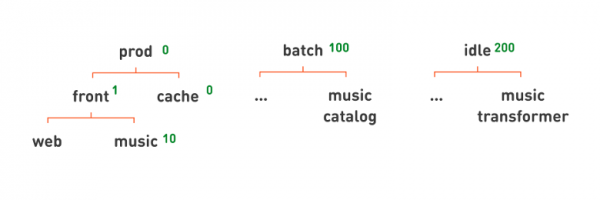
Of course, these are the processes that directly participate in handling user requests, i.e. prod. We indicate this with placement priority — a number that can be assigned to a queue. If a queue has a higher priority, its services are placed first.
In prod, we assign higher priorities, 0; for batch — slightly lower, 100; for idle — even lower, 200. Priorities are applied hierarchically. All tasks lower in the hierarchy will have the corresponding priority. If we want caches to run before frontends within prod, we assign priorities to cache = 0 and to front subtasks = 1. However, if we want the main portal to run first from the fronts, and the music front to run later, we can assign a lower priority to the latter — 10.
The next issue is resource shortages. So, we have a large amount of equipment that has failed, entire data center halls, and we have launched so many services that there are not enough resources available for all. We need to decide which tasks to sacrifice in order to keep the critical main services running.
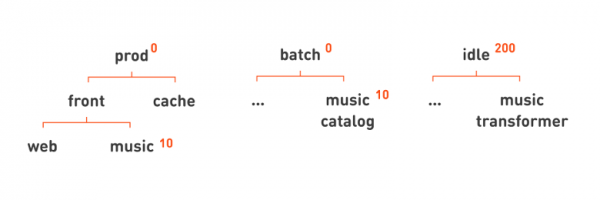
Unlike placement priority, we cannot just sacrifice all batch tasks, as some of them are important for the operation of the portal. Therefore, we have separately highlighted displacement priority tasks. When placing a task with a higher priority can displace, i.e., stop a task with a lower priority, if there are no free minions left. In this case, the low-priority task will likely remain unplaced, meaning there will be no suitable minion with sufficient free resources for it.
In our hierarchy, it’s easy to specify such a displacement priority so that prod and batch tasks displace or stop idle tasks, but not each other, by setting the priority for idle to 200. Just like with placement priority, we can use our hierarchy to describe more complex rules. For example, we can specify that we sacrifice the music function if we lack resources for the main web portal, setting lower priority for the corresponding nodes: 10.
Data center failures entirely
Why might an entire data center fail? Natural disasters. There was a good post on how One could consider the disorderly individuals as a factor, as they once set fire to the fiber optics in a collector, causing the data center to completely lose connection with other sites. Human error can also lead to outages: an operator might issue a command that causes the entire data center to crash. This can happen due to a significant bug. In general, data centers fail — this is not uncommon. We experience this every few months.
And here’s what we do to prevent anyone from posting #okzhivi on Twitter.
The first strategy is isolation. Each one-cloud instance is isolated and can manage machines from only one data center. This means that losing the cloud due to bugs or an incorrect operator command only affects one data center. We are prepared for this: we have a redundancy policy whereby replicas of applications and data are placed in all data centers. We utilize fault-tolerant databases and regularly test failures.
Since we currently have four data centers, there are also four separate, fully isolated instances of one-cloud.
This approach not only protects against physical failures but can also shield from operator errors.
What else can be done regarding human factors? When an operator gives the cloud a strange or potentially dangerous command, they might suddenly be required to solve a small task to assess how well they thought it through. For example, if it's a mass shutdown of several replicas or just a strange command — reducing the number of replicas or changing the image name rather than only the version number in the new manifest.
Summary
Distinctive features of one-cloud:
- A hierarchical and visual naming scheme for services and containers, which allows one to quickly understand what task it is, what it relates to, how it works, and who is responsible for it.
- We apply our technique of combining prod and batchtasks on minions to enhance machine sharing efficiency. Instead of cpusets, we use CPU quotas, shares, scheduler policies, and Linux QoS.
- It was not possible to completely isolate containers running on the same machine, but their mutual influence remains within 20%.
- Organizing services into a hierarchy helps in automated accident mitigation through placement priorities and eviction..
FAQ
Why we didn't choose an off-the-shelf solution.
- Different task isolation classes require different logic for deployment on minions. While production tasks can be deployed with simple resource reservation, batch and idle tasks must be placed by tracking actual resource utilization on the minion machines.
- The need to take into account resource consumption for tasks such as:
- network bandwidth;
- types and 'spindles' of disks.
- The necessity to specify service priorities during incident recovery, along with team rights and quotas on resources, which is addressed through hierarchical queues in one-cloud.
- The need for human-readable naming of containers to reduce reaction time to incidents and emergencies.
- The inability to implement Service Discovery universally and the necessity to coexist for an extended period with tasks deployed on physical hosts — which is addressed by 'static' IP addresses following containers, and consequently, the need for unique integration with a large network infrastructure.
All these functions would require significant modifications of existing solutions to fit our needs, and upon assessing the workload, we realized that we could develop our own solution with approximately the same effort. However, our solution would be significantly easier to operate and evolve — it does not include unnecessary abstractions that support functionality we do not need.
To those reading the last lines — thank you for your patience and attention!
Source: habr.com
