

Note. transl.: In this article, Banzai Cloud shares an example of using its custom tools to make it easier to run Kafka within Kubernetes. The instructions below illustrate how you can determine the optimal infrastructure size and tune Kafka itself to achieve the required throughput.

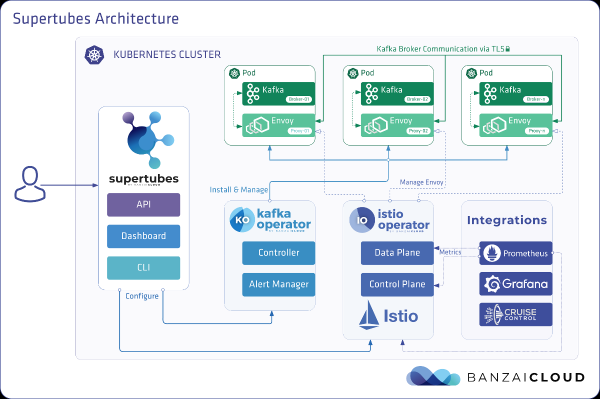
Apache Kafka is a distributed streaming platform for building reliable, scalable, and high-performance real-time streaming systems. Its impressive capabilities can be extended with Kubernetes. For this we have developed and a tool called . They allow you to run Kafka on Kubernetes and use its various features, such as fine-tuning the broker configuration, metric-based scaling with rebalancing, rack awareness (awareness of hardware resources), “soft” (graceful) rolling out updates, etc.
Try Supertubes on your cluster:
curl https://getsupertubes.sh | sh и supertubes install -a --no-democluster --kubeconfig <path-to-eks-cluster-kubeconfig-file>Or refer to . You can also read about some of the features of Kafka, the work with which is automated using Supertubes and Kafka operator. We have already blogged about them:
- ;
- ;
- ;
- ;
- ;
- ;
- .
When you decide to deploy a Kafka cluster on Kubernetes, you will likely face the challenge of determining the optimal size of the underlying infrastructure and the need to fine-tune your Kafka configuration to meet throughput requirements. The maximum performance of each broker is determined by the performance of the infrastructure components at its core, such as memory, processor, disk speed, network bandwidth, etc.
Ideally, the broker configuration should be such that all elements of the infrastructure are used to the maximum of their capabilities. However, in real life, such a setup is quite complicated. It is more likely that users will configure brokers in such a way as to maximize the use of one or two components (disk, memory, or processor). Generally speaking, a broker shows maximum performance when its configuration allows the use of the slowest component "to the fullest". So we can get a rough idea of the load that one broker can handle.
Theoretically, we can also estimate the number of brokers needed to work with a given load. However, in practice, there are so many tuning options at various levels that it is very difficult (if not impossible) to assess the potential performance of a certain configuration. In other words, it is very difficult to plan a configuration based on some given performance.
For Supertubes users, we usually take the following approach: we start with some configuration (infrastructure + settings), then measure its performance, adjust broker settings and repeat the process again. This happens until the potential of the slowest component of the infrastructure is fully exploited.
In this way, we get a clearer idea of how many brokers a cluster needs to handle a certain load (the number of brokers also depends on other factors, such as the minimum number of message replicas to ensure resiliency, the number of partition leaders, etc.). In addition, we get an idea of which infrastructure component is desirable for vertical scaling.
This article will focus on the steps we take to “squeeze everything out” of the slowest components in initial configurations and measure the throughput of a Kafka cluster. A highly resilient configuration requires at least three working brokers (min.insync.replicas=3) spread across three different Availability Zones. To configure, scale and monitor the Kubernetes infrastructure, we use our own container management platform for hybrid clouds − . It supports on-premise (bare metal, VMware) and five types of clouds (Alibaba, AWS, Azure, Google, Oracle), as well as any combination of them.
Thoughts on the infrastructure and configuration of a Kafka cluster
For the examples below, we have chosen AWS as the cloud provider and EKS as the Kubernetes distribution. A similar configuration can be implemented using is a CNCF-certified Kubernetes distribution from Banzai Cloud.
Диск
Amazon offers various ... At the heart of gp2 и io1 lie SSD drives, however, to ensure high throughput gp2 consumes accumulated credits (I/O credits), so we preferred the type io1, which offers stable high throughput.
Instance types
The performance of Kafka is highly dependent on the operating system page cache, so we need instances with enough memory for the brokers (JVM) and the page cache. Instance c5.2xlarge - a good start, because it has 16 GB of memory and . Its disadvantage is that it is able to provide maximum performance for no more than 30 minutes every 24 hours. If your workload requires maximum performance for a longer period of time, you should consider other instance types. This is exactly what we did, focusing on c5.4xlarge. It provides maximum throughput in 593,75 Mbps. EBS Volume Maximum Bandwidth io1 higher than instance c5.4xlarge, so the slowest piece of infrastructure seems to be the I/O throughput of this instance type (which our load tests should also confirm).
Network
The network throughput must be large enough compared to the performance of the VM instance and disk, otherwise the network becomes a bottleneck. In our case, the network interface c5.4xlarge supports speeds up to 10 Gb/s, which is significantly higher than the I/O throughput of a VM instance.
Broker Deployment
Brokers should be deployed (scheduled in Kubernetes) to dedicated nodes to avoid contention with other processes for CPU, memory, network, and disk resources.
Java Version
Java 11 is the logical choice as it is compatible with Docker in the sense that the JVM correctly detects the processors and memory available to the container the broker is running in. Knowing that CPU limits are important, the JVM internally and transparently sets the number of GC threads and JIT compiler threads. We used the Kafka image banzaicloud/kafka:2.13-2.4.0, which includes Kafka 2.4.0 (Scala 2.13) on Java 11.
If you would like to learn more about Java/JVM on Kubernetes, please take a look at our publications below:
- ;
- .
Broker memory settings
There are two key aspects to setting up a broker's memory: the settings for the JVM and the settings for the Kubernetes pod. The memory limit set for a pod must be greater than the maximum heap size to allow the JVM to have room for the Java metaspace that resides in its own memory and for the operating system page cache that Kafka actively uses. In our tests, we launched Kafka brokers with parameters -Xmx4G -Xms2G, and the memory limit for the pod was 10 Gi. Please note that memory settings for the JVM can be obtained automatically using -XX:MaxRAMPercentage и -X:MinRAMPercentage, based on the memory limit for the pod.
Broker processor settings
Generally speaking, you can improve performance by increasing concurrency by increasing the number of threads used by Kafka. The more processors available for Kafka, the better. In our test, we started with a limit of 6 processors and gradually (in iterations) increased their number to 15. In addition, we set num.network.threads=12 in the broker settings to increase the number of streams that receive data from the network and send it. Having immediately discovered that the follower brokers could not receive replicas fast enough, raised num.replica.fetchers to 4 to increase the rate at which the follower brokers replicated messages from the leaders.
Load Generation Tool
You should make sure that the potential of the selected load generator does not run out before the Kafka cluster (which is being benchmarked) reaches its maximum load. In other words, it is necessary to carry out a preliminary assessment of the capabilities of the load generation tool, and also select instance types for it with a sufficient number of processors and memory. In this case, our tool will produce more load than the Kafka cluster can handle. After many experiments, we settled on three copies c5.4xlarge, in each of which the generator was started.
Benchmarking
Performance measurement is an iterative process that includes the following steps:
- infrastructure setup (EKS cluster, Kafka cluster, load generation tool, as well as Prometheus and Grafana);
- generate load over a period to filter out random fluctuations in collected performance metrics;
- adjusting the infrastructure and configuration of the broker based on observed performance indicators;
- repeating the process until the required throughput level of the Kafka cluster is reached. At the same time, it must be stably reproducible and show minimal throughput variations.
The following section describes the steps that were taken during the test cluster benchmark process.
Tools
The following tools were used to quickly deploy a basic configuration, load generation and performance measurement:
- to organize an EKS cluster from Amazon c (for collecting Kafka and infrastructure metrics) and (to visualize these metrics). We took advantage integrated в services that provide federated monitoring, centralized logging, vulnerability scanning, disaster recovery, enterprise-grade security, and more.
- is a tool for load testing a Kafka cluster.
- Grafana dashboards for visualizing Kafka metrics and infrastructure: , .
- Supertubes CLI for the easiest way to set up a Kafka cluster in Kubernetes. Zookeeper, Kafka operator, Envoy and many other components are installed and properly configured to run a production-ready Kafka cluster on Kubernetes.
- For installation supertubes CLI use the instructions provided .
Cluster EKS
Provision an EKS Cluster with Dedicated Worker Nodes c5.4xlarge in different availability zones for pods with Kafka brokers, as well as dedicated nodes for the load generator and monitoring infrastructure.
banzai cluster create -f https://raw.githubusercontent.com/banzaicloud/kafka-operator/master/docs/benchmarks/infrastructure/cluster_eks_202001.jsonOnce the EKS cluster is up and running, turn on its integrated - it will deploy Prometheus and Grafana in a cluster.
Kafka system components
Install Kafka system components (Zookeeper, kafka-operator) in EKS using supertubes CLI:
supertubes install -a --no-democluster --kubeconfig <path-to-eks-cluster-kubeconfig-file>Kafka cluster
By default, EKS uses EBS volumes of type gp2, so you need to create a separate storage class based on volumes io1 for Kafka cluster:
kubectl create -f - <<EOF
apiVersion: storage.k8s.io/v1
kind: StorageClass
metadata:
  name: fast-ssd
provisioner: kubernetes.io/aws-ebs
parameters:
  type: io1
  iopsPerGB: "50"
  fsType: ext4
volumeBindingMode: WaitForFirstConsumer
EOF
Set the brokers parameter min.insync.replicas=3 and deploy broker pods on nodes in three different Availability Zones:
supertubes cluster create -n kafka --kubeconfig <path-to-eks-cluster-kubeconfig-file> -f https://raw.githubusercontent.com/banzaicloud/kafka-operator/master/docs/benchmarks/infrastructure/kafka_202001_3brokers.yaml --wait --timeout 600Topics
We ran three instances of the load generator in parallel. Each of them writes to their own topic, that is, we need three topics in total:
supertubes cluster topic create -n kafka --kubeconfig <path-to-eks-cluster-kubeconfig-file> -f -<<EOF
apiVersion: kafka.banzaicloud.io/v1alpha1
kind: KafkaTopic
metadata:
  name: perftest1
spec:
  name: perftest1
  partitions: 12
  replicationFactor: 3
  retention.ms: '28800000'
  cleanup.policy: delete
EOF

supertubes cluster topic create -n kafka --kubeconfig <path-to-eks-cluster-kubeconfig-file> -f -<<EOF
apiVersion: kafka.banzaicloud.io/v1alpha1
kind: KafkaTopic
metadata:
    name: perftest2
spec:
  name: perftest2
  partitions: 12
  replicationFactor: 3
  retention.ms: '28800000'
  cleanup.policy: delete
EOF

supertubes cluster topic create -n kafka --kubeconfig <path-to-eks-cluster-kubeconfig-file> -f -<<EOF
apiVersion: kafka.banzaicloud.io/v1alpha1
kind: KafkaTopic
metadata:
  name: perftest3
spec:
  name: perftest3
  partitions: 12
  replicationFactor: 3
  retention.ms: '28800000'
  cleanup.policy: delete
EOF
For each topic, the replication factor is 3, the minimum recommended value for highly available production systems.
Load Generation Tool
We launched three instances of the load generator (each wrote in a separate topic). For load generator pods, you need to specify node affinity so that they are scheduled only on the nodes allocated for them:
apiVersion: extensions/v1beta1
kind: Deployment
metadata:
  labels:
    app: loadtest
  name: perf-load1
  namespace: kafka
spec:
  progressDeadlineSeconds: 600
  replicas: 1
  revisionHistoryLimit: 10
  selector:
    matchLabels:
      app: loadtest
  strategy:
    rollingUpdate:
      maxSurge: 25%
      maxUnavailable: 25%
    type: RollingUpdate
  template:
    metadata:
      creationTimestamp: null
      labels:
        app: loadtest
    spec:
      affinity:
        nodeAffinity:
          requiredDuringSchedulingIgnoredDuringExecution:
            nodeSelectorTerms:
            - matchExpressions:
              - key: nodepool.banzaicloud.io/name
                operator: In
                values:
                - loadgen
      containers:
      - args:
        - -brokers=kafka-0:29092,kafka-1:29092,kafka-2:29092,kafka-3:29092
        - -topic=perftest1
        - -required-acks=all
        - -message-size=512
        - -workers=20
        image: banzaicloud/perfload:0.1.0-blog
        imagePullPolicy: Always
        name: sangrenel
        resources:
          limits:
            cpu: 2
            memory: 1Gi
          requests:
            cpu: 2
            memory: 1Gi
        terminationMessagePath: /dev/termination-log
        terminationMessagePolicy: File
      dnsPolicy: ClusterFirst
      restartPolicy: Always
      schedulerName: default-scheduler
      securityContext: {}
      terminationGracePeriodSeconds: 30
A few points to pay attention to:
- The load generator generates 512-byte messages and publishes them to Kafka in batches of 500 messages.
- With an argument
-required-acks=allA publication is considered successful when all synchronized message replicas have been received and acknowledged by the Kafka brokers. This means that in the benchmark, we measured not only the speed of the leaders who receive messages, but also their followers who replicate messages. The purpose of this test is not to evaluate the reading speed of consumers (consumers) recently received messages that are still in the OS page cache, and its comparison with the speed of reading messages stored on disk. - The load generator runs 20 workers in parallel (
-workers=20). Each worker contains 5 producers that share the worker's connection to the Kafka cluster. As a result, each generator has 100 producers, and all of them send messages to the Kafka cluster.
Monitor cluster status
During the load testing of the Kafka cluster, we also monitored its health to make sure there were no pod restarts, out of sync replicas, and maximum throughput with minimal fluctuations:
- The load generator writes standard statistics about the number of messages posted and the error rate. The percentage of errors should remain in the value
0,00%. - , deployed by kafka-operator, provides a dashboard where we can also observe the status of the cluster. To view this panel, run:
supertubes cluster cruisecontrol show -n kafka --kubeconfig <path-to-eks-cluster-kubeconfig-file> - ISR level (number of "in-sync" replicas) shrink and expansion is 0.
Measurement results
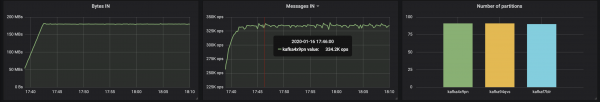
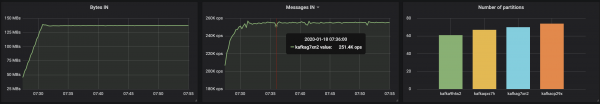
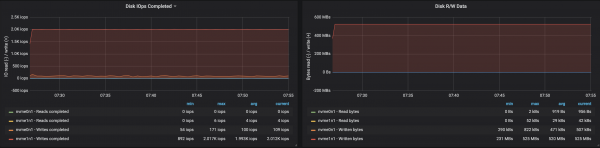
3 brokers, message size - 512 bytes
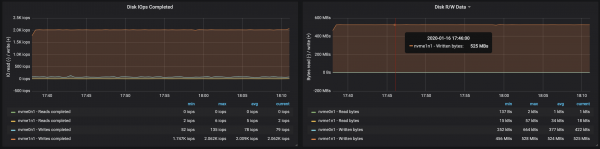
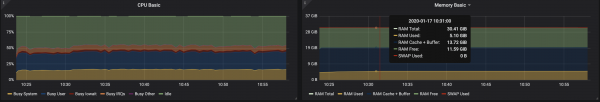
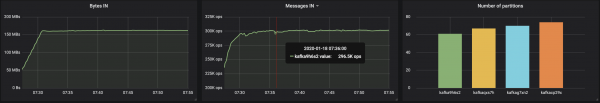
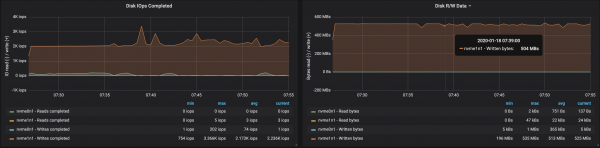
With partitions evenly distributed across the three brokers, we were able to achieve performance ~500 Mb/s (approximately 990 thousand messages per second):


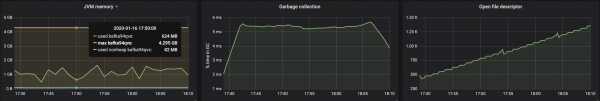
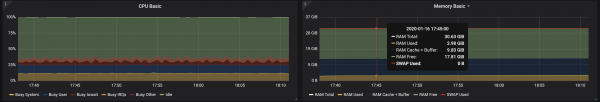
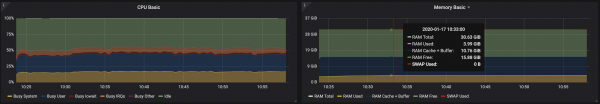
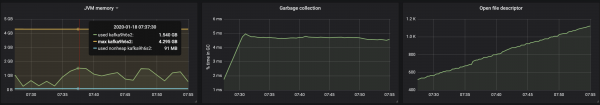
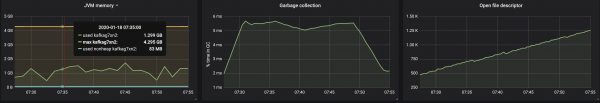
The memory consumption of the JVM virtual machine did not exceed 2 GB:
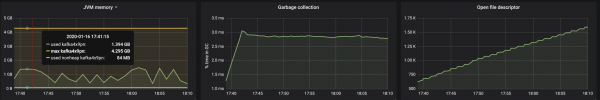
Disk throughput reached maximum node I/O throughput on all three instances the brokers were running:
From the data on memory usage by nodes, it follows that system buffering and caching took ~10-15 GB:
3 brokers, message size - 100 bytes
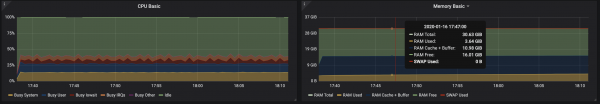
As the message size decreases, throughput drops by about 15-20% due to the time spent processing each message. In addition, the load on the processor has almost doubled.
Since the broker nodes still have unused cores, performance can be improved by changing the Kafka configuration. This is not an easy task, so to increase throughput it is better to work with larger messages.
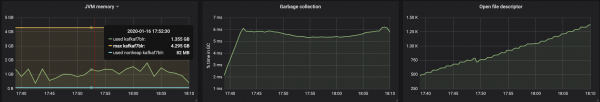
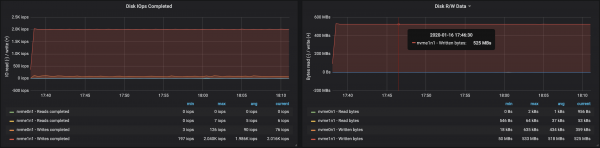
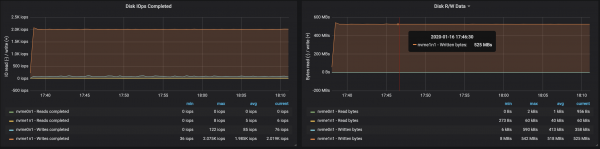
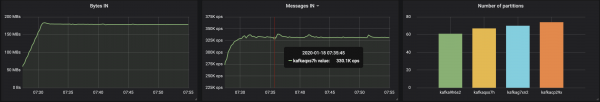
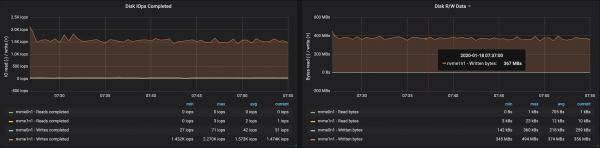
4 brokers, message size - 512 bytes
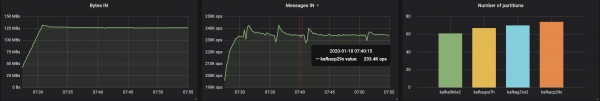
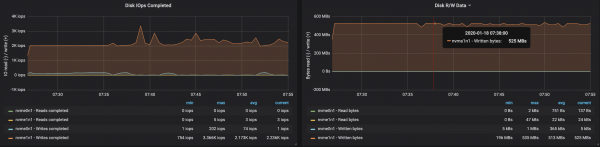
You can easily increase the performance of a Kafka cluster by simply adding new brokers and keeping the partitions balanced (this ensures that the load is evenly distributed among the brokers). In our case, after adding a broker, the cluster throughput increased to ~580 Mbps (~1,1M messages per second). The growth turned out to be smaller than expected: this is mainly due to the imbalance of partitions (not all brokers work at the peak of their capabilities).
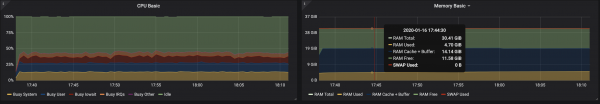
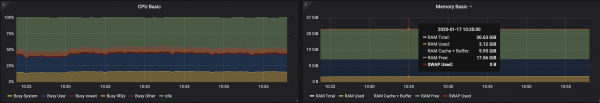
The memory consumption of the JVM machine remained below 2 GB:
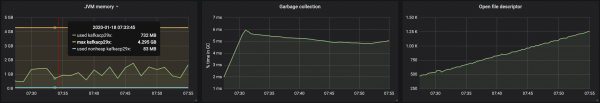
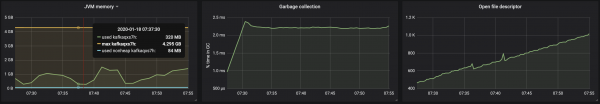
The work of brokers with drives was affected by the imbalance of partitions:
Conclusions
The iterative approach presented above can be extended to cover more complex scenarios involving hundreds of consumers, repartitioning, rolling updates, pod restarts, and so on. All this allows us to assess the limits of the Kafka cluster in various conditions, identify bottlenecks in its operation and find ways to deal with them.
We designed Supertubes to quickly and easily deploy a cluster, configure it, add/remove brokers and topics, respond to alerts, and ensure that Kafka in Kubernetes works properly in general. Our goal is to help focus on the main task ("generate" and "consume" Kafka messages), and leave all the hard work to Supertubes and Kafka operator'u.
If you are interested in technologies and Open Source projects of Banzai Cloud, subscribe to the company in , or .
PS from translator
Read also on our blog:
- «";
- «";
- «».
Source: habr.com
