

The ETL component of a data warehouse often finds itself overshadowed by the warehouse itself and receives less attention than the main database or front-end components like BI and reporting. However, from the perspective of filling the warehouse with data, ETL plays a crucial role and requires just as much attention from administrators as other components. My name is Alexander, and I currently manage the ETL at Rostelecom. In this article, I will share some of the challenges faced by the administrator of a well-known ETL system in a large data warehouse at Rostelecom.
If esteemed readers are already familiar with our data warehouse project and the Informatica PowerCenter product, we can proceed directly to the next section.
A few years ago, the idea of a unified corporate data warehouse matured at Rostelecom and began to be implemented. Several warehouses addressing specific tasks had already been created, but the number of scenarios was increasing, support costs were rising, and it became clear that the future lay in centralization. Architecturally, this warehouse comprises several layers, implemented on Hadoop and GreenPlum, with auxiliary databases, ETL mechanisms, and BI.
Due to the large number of geographically distributed, heterogeneous data sources, a special data extraction mechanism was created, managed by Informatica. As a result, data packets end up in the interface area of Hadoop, after which the data loading processes begin across the layers of the warehouse, in Hadoop and GreenPlum, managed by what is known as an ETL control mechanism implemented in Informatica. Thus, the Informatica system is one of the key elements ensuring the operation of the warehouse.
More detailed information about our warehouse will be shared in one of the upcoming posts.
Informatica PowerCenter/Big Data Management is currently considered leading software in the realm of data integration tools. This product is from the American company Informatica, which is one of the strongest players in ETL (Extract Transform Load), data quality management, MDM (Master Data Management), ILM (Information Lifecycle Management), and more.
The PowerCenter we use is an integrated Tomcat application server, running applications that implement Informatica’s services:
Domain, which is essentially the foundation for everything else; services, users, and GRID components operate within the domain.
Administrator Console, a web-based management and monitoring tool, aside from the Informatica Developer client, is the main tool for interacting with the product.
MRS, Model Repository Service, a metadata repository, serves as a layer between the database where metadata is physically stored and the Informatica Developer client where development takes place. The repositories store both data descriptions and additional information, including schedules for job executions (Schedules) or monitoring data, as well as application parametersets, particularly allowing the same application to work with various data sources and sinks.
DIS, Data Integration Service, this is the service where the main functional processes occur, where applications operate, and the actual launches of Workflows (descriptions of the sequence of mappings and their interactions) and Mappings (transformations, blocks where the actual data transformation takes place) occur.
GRID Configuration – essentially, a way to build a cluster using multiple servers, where the load triggered by DIS is distributed across nodes (i.e., servers within the domain). In this configuration, aside from the load distribution in DIS through an additional layer of abstraction GRID, which combines multiple nodes on which DIS operates instead of a specific single node, additional backup instances of MRS can also be created. It’s even possible to implement high availability, allowing external requests to be made through backup nodes in case of a failure of the primary one. We have temporarily decided against this construction option.
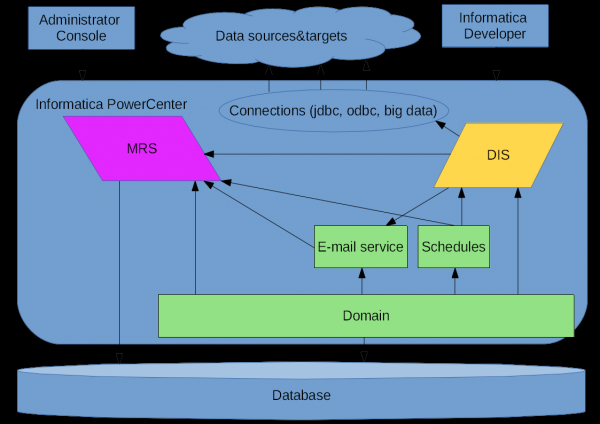
Informatica PowerCenter, schematically
In the early stages of working within the data supply chain, we regularly encountered problems, some of which were due to the unstable operation of Informatica at that time. I intend to share some memorable moments from this saga — mastering Informatica 10.

The former Informatica logo
The responsibilities of our department also include other Informatica environments, which have their own specifics due to different loads. For now, I'll focus on how Informatica evolved as the ETL component of the data warehouse.
How did this happen?
In 2016, when we began overseeing Informatica's operation, it had already reached version 10.0. For the optimistically-minded colleagues who made the decision to use a serious product with a minor version .0, everything seemed obvious—using the new version was a must! At that time, hardware resources were quite sufficient.
From the spring of 2016, a contractor was responsible for the operation of Informatica, and according to the few users of the system, 'it worked a couple of times a week.' It’s important to clarify that the data warehouse was de facto at the PoC stage, there were no administrators on the team, and the system constantly crashed for various reasons, after which the contractor's engineer had to restart it.
In the fall, the team welcomed three administrators who divided responsibilities among themselves, and a proper operational framework began to take shape for the systems in the project, including Informatica. It should be noted that this product is not widely distributed and does not have a large community where one can find answers to any questions or resolve any issues. Therefore, comprehensive technical support from the Russian partner of Informatica was crucial, enabling us to resolve all our mistakes and those of the still-young Informatica 10.
The first thing we had to do for our developers and contractors was to stabilize the operation of Informatica and ensure the functionality of the web administration console (Informatica Administrator).
Thus, Informatica developers often encountered us.
Leaving aside the process of identifying the causes, the main reason for the crashes was the interaction scheme of the Informatica software with the repository database, which was located on a comparatively distant server in terms of the network landscape. This led to delays and disrupted the mechanisms that ensured the monitoring of the state of the Informatica domain. After some database tuning and changing Informatica parameters to make it more tolerant to database delays, and ultimately upgrading Informatica to version 10.1 and relocating the database from the previous server to a server closer to Informatica, the issue became irrelevant, and since then we have not observed similar crashes.

One of the attempts to make Informatica Monitor work
The situation with the administration console was also critical. Since active development was ongoing directly on the conditionally production environment, colleagues constantly needed to analyze the performance of mappings and workflows 'on the fly'. In the new Informatica, the Data Integration Service lacks a separate tool for such monitoring, but the web administration console has introduced a monitoring section (Informatica Administrator Monitor), where one can observe the performance of applications, workflows, and mappings, as well as launches and logs. Occasionally, the console became completely inaccessible, or the information about current processes in the DIS stopped updating, or errors occurred when loading pages.
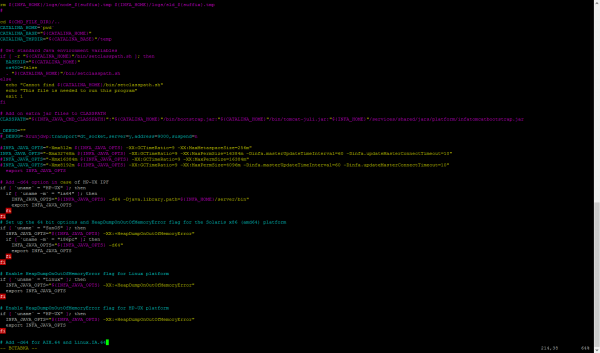
Tuning java parameters to stabilize performance
The problem was addressed through various means, experiments were conducted to change parameters, logs were collected, jstack was sent to support, simultaneously there was active googling and monitoring.
First of all, a separate MRS was created for monitoring, which later turned out to be one of the main resource consumers in our environments, as mappings were launched very intensively. Parameters related to Java heap and several others were adjusted.
As a result, by the next update of Informatica 10.1.1, the performance of the console and monitor was stabilized, developers began to work more efficiently, and regular processes became increasingly regular.
An interesting experience can be the interaction between development and administration. The issue of having a common understanding of how everything works, what can be done and what cannot, is always important when using complex systems. Therefore, it is advisable to first train the administration team on how to manage the software, and the development team on how to write code and design processes in the system, before sending them to work on the results. This is truly important when time is not an infinite resource. Many problems can be solved even through trial and error, but sometimes some require prior knowledge — our case confirms the importance of understanding this axiom.
For instance, when trying to enable versioning in MRS (as it turned out, a different SVN version was needed), after a while we anxiously discovered that the system restart time had increased to several dozen minutes. By identifying the reason for the startup delay and disabling versioning, we managed to restore normal operation.
Among the notable obstacles related to Informatica, we can recall the epic battle with growing Java threads. At one point, it was time for replication, meaning to spread the established processes across a large number of source systems. It turned out that not all processes in 10.1.1 worked well, and after a while DIS became inoperable. Tens of thousands of threads were detected, and their number grew especially noticeably during the application deployment procedure. Sometimes we had to restart several times a day to restore functionality.
Here, we must thank the support team; the issues were relatively quickly localized and resolved with the help of EBF (Emergency Bug Fix) — after that, everyone felt that the tool was indeed working.
It really works!
By the time we started operating in production mode, Informatica looked as follows: version Informatica 10.1.1HF1 (HF1 is HotFix1, a vendor build from the EBF package) with additional EBFs installed, fixing our scaling problems and some others, on one server out of three that made up the GRID, 20 cores x86_64, and storage on a huge, slow array of local disks — this was server configuration for the Hadoop cluster. On another identical server — Oracle DB, which works with both the Informatica domain and the ETL management mechanism. All this is monitored using standard monitoring tools employed by the team (Zabbix + Grafana), covering both Informatica with its services and the loading processes it manages. Currently, both performance and stability, excluding external factors, depend on settings that limit the load.
Separately, we can discuss GRID. The environment was built on three nodes with load balancing capabilities. However, during testing, it was discovered that due to issues with the interaction between running instances of our applications, this configuration did not work as expected. Consequently, we temporarily decided to abandon this scheme by removing two of the three nodes from the domain. The layout itself remains unchanged, and it is now a GRID service, albeit reduced to a single node.
Right now, there is still a challenge related to a drop in performance during regular monitor schema cleanups — simultaneous processes in the ETL and ongoing cleaning can lead to failures in the ETL management mechanism. This is currently being resolved in a makeshift manner — manually cleaning the monitor schema, which results in losing all previous data. This is not too critical for production under normal operations, but we are still searching for a proper solution.
From this situation, another problem also arises — sometimes there are multiple launches of our management mechanism.
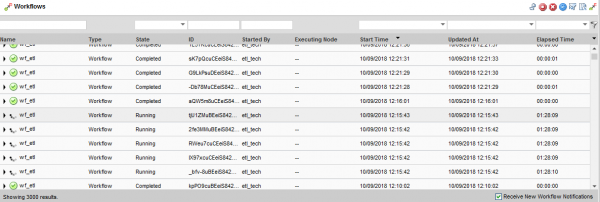
Multiple launches of the application lead to malfunctions of the mechanism.
When scheduled launches occur during times of high system load, there are sometimes situations that result in mechanism failures. To this day, the issue is being resolved manually, and a permanent solution is being sought.
In summary, it is crucial to provide adequate resources under significant load; this applies both to the hardware resources for Informatica itself and to its database repository, as well as to ensure optimal configurations for them. Additionally, the question remains regarding the best database hosting scheme — whether on a separate host or on the same one where Informatica runs. On one hand, having everything on a single server may be cheaper and can mitigate potential network interaction issues; on the other hand, the load on the host from the database will compound with the load from Informatica.
As with any serious product, Informatica has its quirky moments.
Once, while investigating an incident, I noticed that the MRS logs recorded the event timestamps strangely.
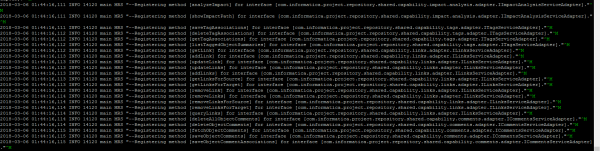
Temporal dualism in the MRS logs is 'by design'
It turned out that the timestamps are recorded in a 12-hour format without any indication of AM/PM, meaning it’s not clear whether it’s before or after noon. A ticket was even opened regarding this issue, and the official response was that it was indeed intended this way; MRS logs are meant to have timestamps in this format. This sometimes leaves a bit of intrigue about the timing of a certain ERROR occurrence...
Strive for the best
Today, Informatica is a fairly stable tool, convenient for administrators and users, and extremely powerful in its current capabilities and potential. It far exceeds our functional needs, and in practice, it is currently used in a manner that is not entirely typical for our project. The complexities are partly related to how the mechanisms work — the specificity is that a large number of threads are launched in a short time, which intensely update parameter sets and work with the repository database, while the server's hardware resources are nearly fully utilized by the CPU.
We are now on the verge of transitioning to Informatica 10.2.1 or 10.2.2, in which some internal mechanisms have been reworked, and support promises to resolve several current performance and functionality issues we face. Furthermore, from a hardware perspective, we expect servers optimally configured for us, taking into account the upcoming needs due to storage growth and development.
Of course, testing, compatibility checks, and possibly architectural changes regarding the HA GRID will be required. Development within Informatica will continue, as in the short term we cannot replace the current system.
Those who will be responsible for this system in the future will certainly be able to bring it up to the reliability and performance standards expected by clients.
This article was prepared by the data management team at Rostelecom.
Current Informatica logo
Source: habr.com
