

, designed for collecting, transforming, and sending log, metric, and event data.
→
Written in Rust, it features high performance and low memory consumption compared to its counterparts. Additionally, significant attention is given to correctness features, specifically the ability to buffer unsent events to disk and file rotation.
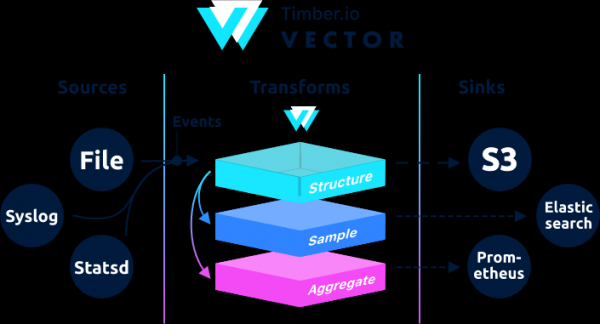
Architecturally, Vector is an event router that receives messages from one or more sources, optionally applying transformations to these messages , and sending them to one or moresinks. The following.
Vector is a replacement for filebeat and logstash, capable of acting as both (receiving and sending logs), more details can be found in their .
If in Logstash the chain is constructed as input → filter → output, then in Vector it is → →
Examples can be found in the documentation.
This instruction is a revised version of the instruction by . The original instruction includes geoip processing. When testing geoip from the internal network, vector returned an error.
Aug 05 06:25:31.889 DEBUG transform{name=nginx_parse_rename_fields type=rename_fields}: vector::transforms::rename_fields: Field did not exist field="geoip.country_name" rate_limit_secs=30If anyone needs to process geoip, please refer to the original instruction by .
We will configure the connection Nginx (Access logs) → Vector (Client | Filebeat) → Vector (Server | Logstash) → separately in Clickhouse and separately in Elasticsearch. We will set up 4 servers. Although it is possible to manage with 3 servers.
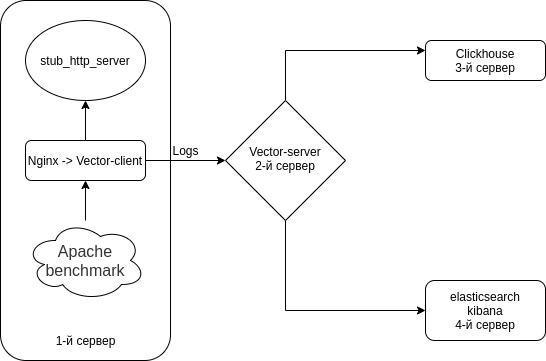
The schema is roughly like this.
We disable Selinux on all your servers
sed -i 's/^SELINUX=.*\/SELINUX=disabled/g' \/etc\/selinux\/config
reboot
On all servers, we install an HTTP server emulator + utilities
We will use from
Nodejs-stub-server has no rpm. we create an rpm for it. The rpm will be built using
Add the repository antonpatsev/nodejs-stub-server
yum -y install yum-plugin-copr epel-release
yes | yum copr enable antonpatsev/nodejs-stub-server
Install nodejs-stub-server, Apache benchmark, and the terminal multiplexer screen on all servers
yum -y install stub_http_server screen mc httpd-tools screenI corrected the response time in the file \/var\/lib\/stub_http_server\/stub_http_server.js to increase logging.
var max_sleep = 10;Let's start stub_http_server.
systemctl start stub_http_server
systemctl enable stub_http_serveron server 3
ClickHouse utilizes a set of SSE 4.2 instructions, so unless stated otherwise, support for it in the used processor becomes an additional system requirement. Here’s the command to check if the current processor supports SSE 4.2:
grep -q sse4_2 \/proc\/cpuinfo && echo "SSE 4.2 supported" || echo "SSE 4.2 not supported"First, connect the official repository:
sudo yum install -y yum-utils
sudo rpm --import https://repo.clickhouse.tech/CLICKHOUSE-KEY.GPG
sudo yum-config-manager --add-repo https://repo.clickhouse.tech/rpm/stable/x86_64
To install the packages, you need to execute the following commands:
sudo yum install -y clickhouse-server clickhouse-clientWe allow clickhouse-server to listen to the network card in the file /etc/clickhouse-server/config.xml
0.0.0.0We change the logging level from trace to debug
debug
The compression settings are standard:
min_compress_block_size  65536
max_compress_block_size  1048576
To activate Zstd compression, it is recommended not to touch the config, but rather to apply DDL.

I could not find how to apply zstd compression through DDL on Google. So I left it as is.
Colleagues, who uses zstd compression in Clickhouse — please share instructions.
To run the server as a daemon, execute:
service clickhouse-server startNow let's move on to configuring Clickhouse
Let's access Clickhouse
clickhouse-client -h 172.26.10.109 -m172.26.10.109 — The IP of the server where Clickhouse is installed.
Let's create the database vector
CREATE DATABASE vector;Let's check that the database exists.
show databases;Creating the table vector.logs.
/* Это таблица где хранятся логи как есть */

CREATE TABLE vector.logs
(
    `node_name` String,
    `timestamp` DateTime,
    `server_name` String,
    `user_id` String,
    `request_full` String,
    `request_user_agent` String,
    `request_http_host` String,
    `request_uri` String,
    `request_scheme` String,
    `request_method` String,
    `request_length` UInt64,
    `request_time` Float32,
    `request_referrer` String,
    `response_status` UInt16,
    `response_body_bytes_sent` UInt64,
    `response_content_type` String,
    `remote_addr` IPv4,
    `remote_port` UInt32,
    `remote_user` String,
    `upstream_addr` IPv4,
    `upstream_port` UInt32,
    `upstream_bytes_received` UInt64,
    `upstream_bytes_sent` UInt64,
    `upstream_cache_status` String,
    `upstream_connect_time` Float32,
    `upstream_header_time` Float32,
    `upstream_response_length` UInt64,
    `upstream_response_time` Float32,
    `upstream_status` UInt16,
    `upstream_content_type` String,
    INDEX idx_http_host request_http_host TYPE set(0) GRANULARITY 1
)
ENGINE = MergeTree()
PARTITION BY toYYYYMMDD(timestamp)
ORDER BY timestamp
TTL timestamp + toIntervalMonth(1)
SETTINGS index_granularity = 8192;
We check that the tables have been created. Starting clickhouse-client and making a query.
Let's go to the database vector.
use vector;

Ok.

0 rows in set. Elapsed: 0.001 sec.
Let's look at the tables.
show tables;

┌─name────────────────┐
│ logs                │
└─────────────────────┘
Installing elasticsearch on the 4th server to send the same data to Elasticsearch for comparison with Clickhouse
Let's add the public rpm key
rpm --import https://artifacts.elastic.co/GPG-KEY-elasticsearchLet's create 2 repos:
/etc/yum.repos.d/elasticsearch.repo
[elasticsearch]
name=Elasticsearch repository for 7.x packages
baseurl=https://artifacts.elastic.co/packages/7.x/yum
gpgcheck=1
gpgkey=https://artifacts.elastic.co/GPG-KEY-elasticsearch
enabled=0
autorefresh=1
type=rpm-md
/etc/yum.repos.d/kibana.repo
[kibana-7.x]
name=Kibana repository for 7.x packages
baseurl=https://artifacts.elastic.co/packages/7.x/yum
gpgcheck=1
gpgkey=https://artifacts.elastic.co/GPG-KEY-elasticsearch
enabled=1
autorefresh=1
type=rpm-md
We will install elasticsearch and kibana
yum install -y kibana elasticsearchSince it will be in 1 instance, we need to add to the file /etc/elasticsearch/elasticsearch.yml:
discovery.type: single-nodeTo enable vector to send data to elasticsearch from another server, we will change network.host.
network.host: 0.0.0.0To connect to kibana, we will change the server.host parameter in the file /etc/kibana/kibana.yml
server.host: "0.0.0.0"We start and enable elasticsearch to auto-start
systemctl enable elasticsearch
systemctl start elasticsearch
and kibana
systemctl enable kibana
systemctl start kibana
Configuring Elasticsearch for single-node mode 1 shard, 0 replicas. Most likely you will have a cluster of a large number of servers, and you don't need to do this.
For future indexes, we update the default template:
curl -X PUT http://localhost:9200/_template/default -H 'Content-Type: application/json' -d '{"index_patterns": ["*"],"order": -1,"settings": {"number_of_shards": "1","number_of_replicas": "0"}}' Installation as a replacement for Logstash on the 2nd server
yum install -y https://packages.timber.io/vector/0.9.X/vector-x86_64.rpm mc httpd-tools screenWe'll configure Vector as a replacement for Logstash. Edit the file /etc/vector/vector.toml
# /etc/vector/vector.toml

data_dir = "/var/lib/vector"

[sources.nginx_input_vector]
  # General
  type                          = "vector"
  address                       = "0.0.0.0:9876"
  shutdown_timeout_secs         = 30

[transforms.nginx_parse_json]
  inputs                        = [ "nginx_input_vector" ]
  type                          = "json_parser"

[transforms.nginx_parse_add_defaults]
  inputs                        = [ "nginx_parse_json" ]
  type                          = "lua"
  version                       = "2"

  hooks.process = """
  function (event, emit)

    function split_first(s, delimiter)
      result = {};
      for match in (s..delimiter):gmatch("(.-)"..delimiter) do
          table.insert(result, match);
      end
      return result[1];
    end

    function split_last(s, delimiter)
      result = {};
      for match in (s..delimiter):gmatch("(.-)"..delimiter) do
          table.insert(result, match);
      end
      return result[#result];
    end

    event.log.upstream_addr             = split_first(split_last(event.log.upstream_addr, ', '), ':')
    event.log.upstream_bytes_received   = split_last(event.log.upstream_bytes_received, ', ')
    event.log.upstream_bytes_sent       = split_last(event.log.upstream_bytes_sent, ', ')
    event.log.upstream_connect_time     = split_last(event.log.upstream_connect_time, ', ')
    event.log.upstream_header_time      = split_last(event.log.upstream_header_time, ', ')
    event.log.upstream_response_length  = split_last(event.log.upstream_response_length, ', ')
    event.log.upstream_response_time    = split_last(event.log.upstream_response_time, ', ')
    event.log.upstream_status           = split_last(event.log.upstream_status, ', ')

    if event.log.upstream_addr == "" then
        event.log.upstream_addr = "127.0.0.1"
    end

    if (event.log.upstream_bytes_received == "-" or event.log.upstream_bytes_received == "") then
        event.log.upstream_bytes_received = "0"
    end

    if (event.log.upstream_bytes_sent == "-" or event.log.upstream_bytes_sent == "") then
        event.log.upstream_bytes_sent = "0"
    end

    if event.log.upstream_cache_status == "" then
        event.log.upstream_cache_status = "DISABLED"
    end

    if (event.log.upstream_connect_time == "-" or event.log.upstream_connect_time == "") then
        event.log.upstream_connect_time = "0"
    end

    if (event.log.upstream_header_time == "-" or event.log.upstream_header_time == "") then
        event.log.upstream_header_time = "0"
    end

    if (event.log.upstream_response_length == "-" or event.log.upstream_response_length == "") then
        event.log.upstream_response_length = "0"
    end

    if (event.log.upstream_response_time == "-" or event.log.upstream_response_time == "") then
        event.log.upstream_response_time = "0"
    end

    if (event.log.upstream_status == "-" or event.log.upstream_status == "") then
        event.log.upstream_status = "0"
    end

    emit(event)

  end
  """

[transforms.nginx_parse_remove_fields]
    inputs                              = [ "nginx_parse_add_defaults" ]
    type                                = "remove_fields"
    fields                              = ["data", "file", "host", "source_type"]

[transforms.nginx_parse_coercer]

    type                                = "coercer"
    inputs                              = ["nginx_parse_remove_fields"]

    types.request_length = "int"
    types.request_time = "float"

    types.response_status = "int"
    types.response_body_bytes_sent = "int"

    types.remote_port = "int"

    types.upstream_bytes_received = "int"
    types.upstream_bytes_send = "int"
    types.upstream_connect_time = "float"
    types.upstream_header_time = "float"
    types.upstream_response_length = "int"
    types.upstream_response_time = "float"
    types.upstream_status = "int"

    types.timestamp = "timestamp"

[sinks.nginx_output_clickhouse]
    inputs   = ["nginx_parse_coercer"]
    type     = "clickhouse"

    database = "vector"
    healthcheck = true
    host = "http://172.26.10.109:8123" #  Адрес Clickhouse
    table = "logs"

    encoding.timestamp_format = "unix"

    buffer.type = "disk"
    buffer.max_size = 104900000
    buffer.when_full = "block"

    request.in_flight_limit = 20

[sinks.elasticsearch]
    type = "elasticsearch"
    inputs   = ["nginx_parse_coercer"]
    compression = "none"
    healthcheck = true
    # 172.26.10.116 - сервер где установен elasticsearch
    host = "http://172.26.10.116:9200"
    index = "vector-%Y-%m-%d"
You can adjust the transforms.nginx_parse_add_defaults section.
Since uses these configurations for a small CDN, and there can be multiple values in upstream_*
For example:
"upstream_addr": "128.66.0.10:443, 128.66.0.11:443, 128.66.0.12:443"
"upstream_bytes_received": "-, -, 123"
"upstream_status": "502, 502, 200"
If this is not your situation, you can simplify this section.
Let's create the service configuration for systemd at /etc/systemd/system/vector.service
# /etc/systemd/system/vector.service

[Unit]
Description=Vector
After=network-online.target
Requires=network-online.target

[Service]
User=vector
Group=vector
ExecStart=/usr/bin/vector
ExecReload=/bin/kill -HUP $MAINPID
Restart=no
StandardOutput=syslog
StandardError=syslog
SyslogIdentifier=vector

[Install]
WantedBy=multi-user.target
After creating the tables, you can start Vector.
systemctl enable vector
systemctl start vector
You can view the Vector logs like this:
journalctl -f -u vectorThe logs should contain the following entries:
INFO vector::topology::builder: Healthcheck: Passed.
INFO vector::topology::builder: Healthcheck: Passed.
On the client (Web server) — 1st server
On the server with nginx, you need to disable ipv6, as the field in the logs table in ClickHouse uses upstream_addr IPv4, since I do not use ipv6 within the network. If ipv6 is not disabled, there will be errors:
DB::Exception: Invalid IPv4 value.: (while reading the value of key upstream_addr)Readers may want to add ipv6 support.
Let's create the file /etc/sysctl.d/98-disable-ipv6.conf
net.ipv6.conf.all.disable_ipv6 = 1
net.ipv6.conf.default.disable_ipv6 = 1
net.ipv6.conf.lo.disable_ipv6 = 1
Apply the settings
sysctl --systemWe'll install nginx.
Added the nginx repository file /etc/yum.repos.d/nginx.repo
[nginx-stable]
name=nginx stable repo
baseurl=http://nginx.org/packages/centos/$releasever/$basearch/
gpgcheck=1
enabled=1
gpgkey=https://nginx.org/keys/nginx_signing.key
module_hotfixes=true
We'll install the nginx package
yum install -y nginxFirst, we need to configure the log format in Nginx in the file /etc/nginx/nginx.conf
user nginx;
# You must set worker processes based on your CPU cores; nginx does not benefit from setting more than that
worker_processes auto; # Some recent versions calculate it automatically

# Number of file descriptors used for nginx
# The limit for the maximum FDs on the server is usually set by the OS.
# If you don't set FDs, the OS settings will be used, which is by default 2000
worker_rlimit_nofile 100000;

error_log  /var/log/nginx/error.log warn;
pid        /var/run/nginx.pid;

# Provides the configuration file context for directives affecting connection processing.
events {
    # Determines how many clients will be served per worker
    # max clients = worker_connections * worker_processes
    # max clients is also limited by the number of socket connections available on the system (~64k)
    worker_connections 4000;

    # Optimized to serve many clients with each thread, essential for Linux -- for testing environment
    use epoll;

    # Accept as many connections as possible; may flood worker connections if set too low -- for testing environment
    multi_accept on;
}

http {
    include       /etc/nginx/mime.types;
    default_type  application/octet-stream;

    log_format  main  '$remote_addr - $remote_user [$time_local] "$request" '
                      '$status $body_bytes_sent "$http_referer" '
                      '"$http_user_agent" "$http_x_forwarded_for"';

log_format vector escape=json
    '{'
        '"node_name":"nginx-vector",'
        '"timestamp":"$time_iso8601",'
        '"server_name":"$server_name",'
        '"request_full": "$request",'
        '"request_user_agent":"$http_user_agent",'
        '"request_http_host":"$http_host",'
        '"request_uri":"$request_uri",'
        '"request_scheme": "$scheme",'
        '"request_method":"$request_method",'
        '"request_length":"$request_length",'
        '"request_time": "$request_time",'
        '"request_referrer":"$http_referer",'
        '"response_status": "$status",'
        '"response_body_bytes_sent":"$body_bytes_sent",'
        '"response_content_type":"$sent_http_content_type",'
        '"remote_addr": "$remote_addr",'
        '"remote_port": "$remote_port",'
        '"remote_user": "$remote_user",'
        '"upstream_addr": "$upstream_addr",'
        '"upstream_bytes_received": "$upstream_bytes_received",'
        '"upstream_bytes_sent": "$upstream_bytes_sent",'
        '"upstream_cache_status":"$upstream_cache_status",'
        '"upstream_connect_time":"$upstream_connect_time",'
        '"upstream_header_time":"$upstream_header_time",'
        '"upstream_response_length":"$upstream_response_length",'
        '"upstream_response_time":"$upstream_response_time",'
        '"upstream_status": "$upstream_status",'
        '"upstream_content_type":"$upstream_http_content_type"'
    '}';

    access_log  /var/log/nginx/access.log  main;
    access_log  /var/log/nginx/access.json.log vector;      # New log in JSON format

    sendfile        on;
    #tcp_nopush     on;

    keepalive_timeout  65;

    #gzip  on;

    include /etc/nginx/conf.d/*.conf;
}
To avoid breaking your current configuration, Nginx allows for multiple access_log directives.
access_log  /var/log/nginx/access.log  main;            # Default log
access_log  /var/log/nginx/access.json.log vector;      # New log in JSON format
Don't forget to add a rule for logrotate for the new logs (if the log file does not end with .log)
Remove default.conf from /etc/nginx/conf.d/
rm -f /etc/nginx/conf.d/default.confAdd virtual host /etc/nginx/conf.d/vhost1.conf
server {
    listen 80;
    server_name vhost1;
    location / {
        proxy_pass http://172.26.10.106:8080;
    }
}
Adding virtual host /etc/nginx/conf.d/vhost2.conf
server {
    listen 80;
    server_name vhost2;
    location / {
        proxy_pass http://172.26.10.108:8080;
    }
}
Adding virtual host /etc/nginx/conf.d/vhost3.conf
server {
    listen 80;
    server_name vhost3;
    location / {
        proxy_pass http://172.26.10.109:8080;
    }
}
Adding virtual host /etc/nginx/conf.d/vhost4.conf
server {
    listen 80;
    server_name vhost4;
    location / {
        proxy_pass http://172.26.10.116:8080;
    }
}
Adding virtual hosts to the file /etc/hosts (172.26.10.106 is the server IP where nginx is installed) on all servers:
172.26.10.106 vhost1
172.26.10.106 vhost2
172.26.10.106 vhost3
172.26.10.106 vhost4
And if everything is ready, then
nginx -t
systemctl restart nginx
Now let's install the actual
yum install -y https://packages.timber.io/vector/0.9.X/vector-x86_64.rpmLet's create the configuration file for systemd /etc/systemd/system/vector.service
[Unit]
Description=Vector
After=network-online.target
Requires=network-online.target

[Service]
User=vector
Group=vector
ExecStart=/usr/bin/vector
ExecReload=/bin/kill -HUP $MAINPID
Restart=no
StandardOutput=syslog
StandardError=syslog
SyslogIdentifier=vector

[Install]
WantedBy=multi-user.target
And configure the replacement of Filebeat in the config /etc/vector/vector.toml. The IP address 172.26.10.108 is the IP address of the log server (Vector-Server)
data_dir = "/var/lib/vector"

[sources.nginx_file]
  type                          = "file"
  include                       = [ "/var/log/nginx/access.json.log" ]
  start_at_beginning            = false
  fingerprinting.strategy       = "device_and_inode"

[sinks.nginx_output_vector]
  type                          = "vector"
  inputs                        = [ "nginx_file" ]

  address                       = "172.26.10.108:9876"
Don't forget to add the user vector to the necessary group so that it can read the log files. For example, nginx in CentOS creates logs with permissions for the adm group.
usermod -a -G adm vectorLet's start the vector service
systemctl enable vector
systemctl start vector
You can view the Vector logs like this:
journalctl -f -u vectorThere should be an entry in the logs like this
INFO vector::topology::builder: Healthcheck: Passed.Load Testing
We conduct testing using Apache benchmark.
The httpd-tools package has been installed on all servers
We start testing using Apache benchmark from 4 different servers in screen. First, we launch the terminal multiplexer screen, and then we start testing using Apache benchmark. You can find out how to work with screen in .
From the 1st server
while true; do ab -H "User-Agent: 1server" -c 100 -n 10 -t 10 http://vhost1/; sleep 1; doneFrom the 2nd server
while true; do ab -H "User-Agent: 2server" -c 100 -n 10 -t 10 http://vhost2/; sleep 1; doneFrom the 3rd server
while true; do ab -H "User-Agent: 3server" -c 100 -n 10 -t 10 http://vhost3/; sleep 1; doneFrom the 4th server
while true; do ab -H "User-Agent: 4server" -c 100 -n 10 -t 10 http://vhost4/; sleep 1; doneLet's check the data in Clickhouse
Let's access Clickhouse
clickhouse-client -h 172.26.10.109 -mMake SQL query
SELECT * FROM vector.logs;

┌─node_name────┬───────────timestamp─┬─server_name─┬─user_id─┬─request_full───┬─request_user_agent─┬─request_http_host─┬─request_uri─┬─request_scheme─┬─request_method─┬─request_length─┬─request_time─┬─request_referrer─┬─response_status─┬─response_body_bytes_sent─┬─response_content_type─┬───remote_addr─┬─remote_port─┬─remote_user─┬─upstream_addr─┬─upstream_port─┬─upstream_bytes_received─┬─upstream_bytes_sent─┬─upstream_cache_status─┬─upstream_connect_time─┬─upstream_header_time─┬─upstream_response_length─┬─upstream_response_time─┬─upstream_status─┬─upstream_content_type─┐
│ nginx-vector │ 2020-08-07 04:32:42 │ vhost1      │         │ GET \/ HTTP\/1.0 │ 1server            │ vhost1            │ \/           │ http           │ GET            │             66 │        0.028 │                  │             404 │                       27 │                       │ 172.26.10.106 │       45886 │             │ 172.26.10.106 │             0 │                     109 │                  97 │ DISABLED              │                     0 │                0.025 │                       27 │                  0.029 │             404 │                       │
└──────────────┴─────────────────────┴─────────────┴─────────┴────────────────┴────────────────────┴───────────────────┴─────────────┴────────────────┴────────────────┴────────────────┴──────────────┴──────────────────┴─────────────────┴──────────────────────────┴───────────────────────┴───────────────┴─────────────┴─────────────┴───────────────┴───────────────┴─────────────────────────┴─────────────────────┴───────────────────────┴───────────────────────┴───────────────────────┴──────────────────────────┴────────────────────────┴─────────────────┴───────────────────────
Let's find out the size of tables in Clickhouse
select concat(database, '.', table)                         as table,
       formatReadableSize(sum(bytes))                       as size,
       sum(rows)                                            as rows,
       max(modification_time)                               as latest_modification,
       sum(bytes)                                           as bytes_size,
       any(engine)                                          as engine,
       formatReadableSize(sum(primary_key_bytes_in_memory)) as primary_keys_size
from system.parts
where active
group by database, table
order by bytes_size desc;
Let's find out how much space logs have taken in Clickhouse.
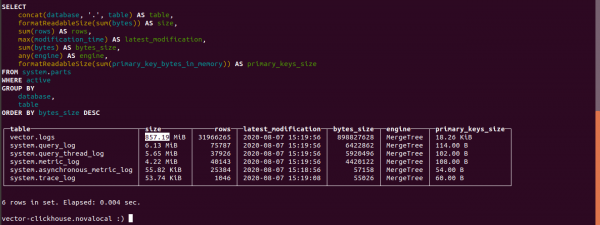
The size of the logs table is 857.19 MB.
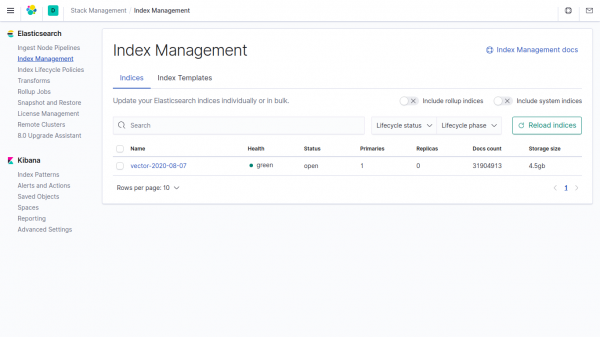
The size of the same data in the index in Elasticsearch takes 4.5GB.
If the vector parameters are not specified in Clickhouse, the data takes up 4500/857.19 = 5.24 times less than in Elasticsearch.
In the vector field, compression is used by default.
Telegram chat on
Telegram chat on
Telegram chat on ""
Source: habr.com
