

Three years ago, Viktor Tarnavsky and Alexey Milovidov from Yandex took the stage HighLoad++ , discussing how good ClickHouse is and how it doesn't lag. Meanwhile, on a neighboring stage was Alexander Zaytsev with talking about the transition to ClickHouse another analytics DBMS and concluding that ClickHouse, of course, it’s good, but not very convenient. When in 2016, the company LifeStreet, where Alexander was working at the time, was migrating a multi-petabyte analytics system to ClickHouse, it felt like an exciting 'yellow brick road,' full of unknown dangers — ClickHouse it resembled a minefield back then.
Three years later, ClickHouse it has significantly improved — during this time, Alexander founded Altinity, a company that not only helps migrate to ClickHouse dozens of projects but also enhances the product itself alongside colleagues from Yandex. Now, ClickHouse it’s still not a carefree stroll, but it’s no longer a minefield.
Alexander has been working with distributed systems since 2003, developing large projects on MySQL, Oracle, and Vertica.At the recent HighLoad++ 2019, Alexander, one of the pioneers in the use of ClickHouse, shared what this DBMS looks like today. We will learn about its main features ClickHouse: how it differs from other systems and in which cases it is more effective to use. We will review current and verified practices for building systems on ClickHouse.

Retrospective: What Was Three Years Ago
Three years ago, we were migrating the company LifeStreet to ClickHouse from another analytics database, and the migration of the advertising network’s analytics looked like this:
- June 2016. The OpenSource the ClickHouse and our project began;
- August. Proof Of Concept:a large advertising network, infrastructure, and 200-300 terabytes of data;
- October. The first production data;
- December. Full product load — 10-50 billion events per day.
- June 2017. Successful migration of users to ClickHouse, 2.5 petabytes of data on a cluster of 60 servers.
During the migration process, the understanding grew that ClickHouse — it is a good system that is pleasant to work with, but it is an internal project of Yandex. Therefore, there are nuances: Yandex will initially cater to its own internal customers and only then — to the community and the needs of external users, and ClickHouse did not meet many enterprise-level functional areas at that time. Therefore, in March 2017, we founded Altinity to make. ClickHouse even faster and more convenient not only for Yandex but also for other users. And now we:
- Teach and help build solutions on ClickHouse so that clients don't run into problems and the solution ultimately works;
- Provide 24/7 support ClickHouse-installations;
- Develop our own ecosystem projects;
- Actively commit to ClickHouse, responding to user requests for various features.
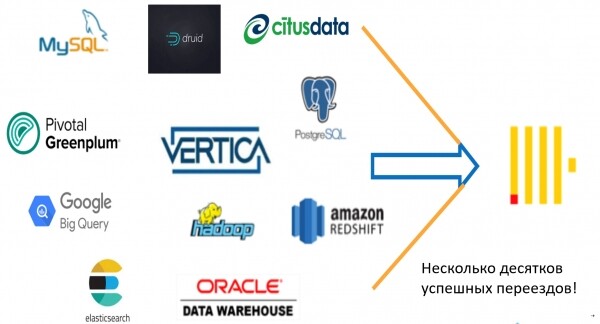
And of course, we help with migration to ClickHouse with MySQL, Vertica., Oracle, Greenplum, Redshift and other systems. We have participated in various migrations, and they have all been successful.
Why migrate to ClickHouse
It doesn't slow down! This is the main reason. ClickHouse — a very fast database for different scenarios:
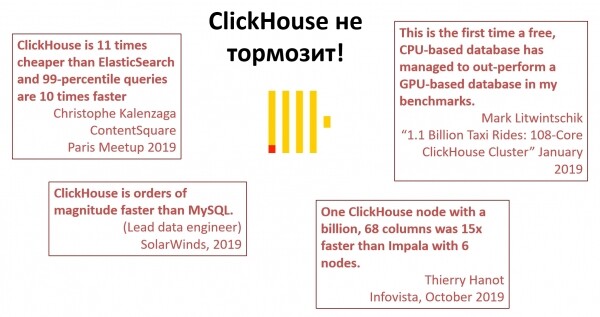
Random quotes from people who have been working with ClickHouse.
Scalability. On some other DB, decent performance can be achieved on a single machine, but ClickHouse you can scale not only vertically but also horizontally by simply adding servers. It doesn’t always work as smoothly as one would like, but it does work. You can grow the system along with the business. It is important that we are not limited by the solution right now and there's always potential for growth.
Portability. There’s no binding to something specific. For example, moving from Amazon Redshift is challenging. But you can install it on your laptop, server, deploy it in the cloud, or move to ClickHouse — there are no restrictions on infrastructure use. This is convenient for everyone, and it's a significant advantage that many other similar databases cannot boast. Kubernetes Flexibility
doesn’t stop at one thing, like Yandex.Metrica, but evolves and is used in an increasing number of different projects and industries. It can be expanded by adding new features to address new tasks. For instance, it is often believed that storing logs in a DB is outdated, which is why. ClickHouse was invented. However, thanks to the flexibility of Elasticsearch, it can also store logs, and often this is even better than in ClickHouseit requires ten times less hardware. Elasticsearch — in ClickHouse . There’s no need to pay for anything. No need to negotiate permission to install the system on your laptop or server. There are no hidden fees. No other Open Source database technology can compete with the speed of
Free Open SourceMySQL, MariaDB, Greenplum ClickHouse. – they are all significantly slower. Community, drive and
. fun. We ClickHouse a great community: meetups, chats, and Alexey Milovidov, who energizes us all with his enthusiasm and optimism.
Migration to ClickHouse
To migrate to ClickHouse from something else, you only need three things:
- Understand the limitations ClickHouse and for what it isn't suited.
- Leverage the advantages of the technology and its strongest features.
- Experiment. Even understanding how it works ClickHouse, it is not always possible to predict when it will be faster, when slower, when better, and when worse. So, try it out.
The problem of migration
There is only one 'but': if you're migrating to ClickHouse from something else, usually something goes wrong. We're used to certain practices and features that work in our favorite database. For example, anyone working with SQL-based databases considers the following set of functions mandatory:
- transactions;
- constraints;
- consistency;
- indexes;
- UPDATE/DELETE;
- NULLs;
- milliseconds;
- automatic type casting;
- multiple joins;
- arbitrary partitions;
- cluster management tools.
The set is mandatory, but three years ago, there were none of these functions in ClickHouse less than half of the unimplemented features remain: transactions, constraints, consistency, milliseconds, and type casting.
And most importantly, some standard practices and approaches in ClickHouse don't work or don't work the way we're used to. Everything that appears in ClickHousecorresponds to the 'ClickHouse way', meaning the functions differ from other databases. For example:
- Indexes do not select, but skip.
- UPDATE/DELETE are asynchronous, not synchronous.
- Multiple joins exist, but there is no query planner. How they are executed is quite puzzling to people from the database world.
ClickHouse Scenarios
In 1960, the American mathematician of Hungarian descent Wigner E. P. wrote a paper titled 'The unreasonable effectiveness of mathematics in the natural sciences' about how the surrounding world is remarkably well described by mathematical laws. Mathematics is an abstract science, and physical laws expressed in mathematical form are non-trivial, and Wigner E. P. he emphasized that this is very strange.
In my opinion, ClickHouse — is just as strange. Paraphrasing Wigner, one could say: the astonishing inexplicability of ClickHouse in a wide variety of analytical applications!
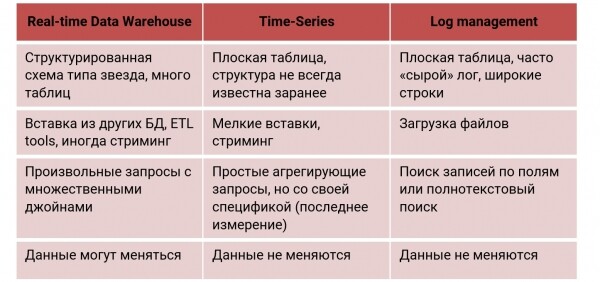
For instance, let's take Real-Time Data Warehouse, into which data is loaded almost continuously. We want to receive requests from it with a one-second delay. Please — let's use ClickHouse, because it was designed for this scenario. ClickHouse this is used not only in web applications, but also in marketing and financial analytics, AdTech, as well as in Fraud detection. In Real-time Data Warehouse a complex structured schema like 'star' or 'snowflake' is used, with many tables containing JOIN (sometimes multiple), and the data is usually stored and changed in some systems.
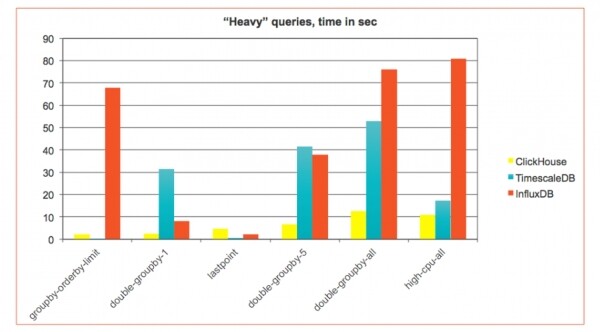
Let's consider another scenario — Time Series: monitoring devices, networks, usage statistics, Internet of Things. Here we encounter time-ordered quite simple events. ClickHouse it wasn't originally developed for this, but it has performed well, so large companies use ClickHouse it as a storage for monitoring information. To study whether ClickHouse is suitable for time-series, we benchmarked based on the approach and results InfluxDB and TimescaleDB — specialized time-series databases. , that ClickHouse, even without optimization for such tasks, excels in unfamiliar territory:
In time-series a narrow table is usually used — a few small columns. Monitoring can generate a massive amount of data — millions of records per second — and they typically arrive in small inserts (real-time streaming). Therefore, a different insertion scenario is needed, and requests have their own specific requirements.
Log Management. Collecting logs in a database is usually undesirable, but in ClickHouse this can be done with some caveats, as described above. Many companies use ClickHouse exactly for this purpose. In this case, a flat wide table is used, where we store logs in full (for example, in the form of JSON), or slice them into parts. Data is usually loaded in large batches (files), and we search by some field.
For each of these functions, specialized databases are usually used. ClickHouse one can do it all so well that it outperforms them in terms of performance. Let’s now take a closer look at time-series the scenario and how to properly 'prepare' ClickHouse for this scenario.
Time-Series
Currently, this is the primary scenario for which ClickHouse is considered a standard solution. Time-series is a series of time-ordered events that represent changes in some process over time. For example, this can be heart rate data over a day or the number of processes in a system. Anything that provides time ticks with some measurements is time-series:
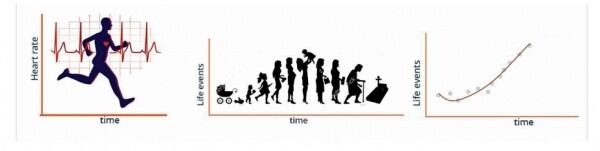
Most of these types of events come from monitoring. This can be monitoring not only of the web, but also of real devices: cars, industrial systems, IoT, manufacturing, or autonomous taxis, in which Yandex is already placing ClickHouse-servers.
For example, there are companies that collect data from ships. Every few seconds, sensors on a container ship send hundreds of different measurements. Engineers study them, build models, and try to understand how efficiently the vessel is being utilized, because a container ship should not sit idle for a second. Any downtime is a loss of money, so it’s important to forecast the route so that stops are minimal.
Currently, there is a growth of specialized databases that measure time-series. On the website DB-Engines different databases are ranked somehow, and they can be viewed by types:
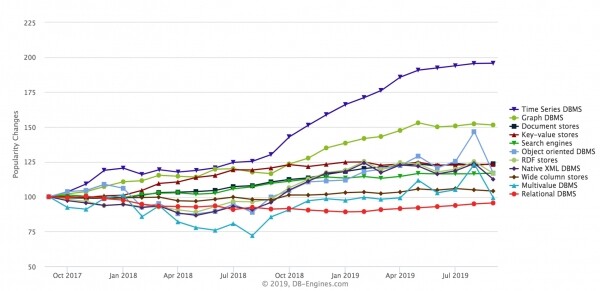
The fastest-growing type is time-seriesdatabases. Graph databases are also growing, but time-seriesthey have been growing faster in recent years. Typical representatives of this family of databases are InfluxDB, Prometheus, KDB, TimescaleDB (built on PostgreSQL), solutions from Amazon. ClickHouse can also be used here, and it is being utilized. I will provide some public examples.
One of the pioneers is the company CloudFlare (CDN-provider). They monitor their CDN via ClickHouse (DNS-requests, HTTP-requests) with a tremendous load — 6 million events per second. Everything goes through Kafka, sent to ClickHouse, which allows real-time viewing of event dashboards in the system.
Comcast — one of the leaders in telecommunications in the USA: internet, digital television, telephony. They created a similar management system CDN within the Open Source project Apache Traffic Control to work with their vast amounts of data. ClickHouse is used as a backend for analytics.
Percona integrated ClickHouse into their PMM, to store monitoring of various MySQL.
Specific requirements
Time-series databases have their specific requirements.
- Fast insertion from many agents.We need to insert data very quickly from many streams. ClickHouse does this well because it has all non-blocking inserts. Any insert — this is a new file on disk, and small inserts can be buffered in one way or another. In ClickHouse it's better to insert data in large batches rather than one line at a time.
- Flexible schema. In time-series we usually do not know the data structure completely. A monitoring system can be built for a specific application, but then it's difficult to use it for another application. A more flexible schema is needed for this. ClickHouse, allows this to be done, even though it is a strictly typed database.
- Efficient storage and 'forgetting' of data. Typically in time-series a huge volume of data, so it needs to be stored as efficiently as possible. For example, good compression is its main feature. But in addition to storage, there must also be a way to 'forget' old data and perform some kind of InfluxDB downsampling — automatic aggregate calculation. Fast queries for aggregated data
- . Sometimes it's interesting to look at the last 5 minutes with millisecond precision, but for monthly data, minute or second granularity may not be necessary — overall statistics might suffice. Support for this kind is essential; otherwise, a three-month query will take a very long time even inQueries like ' ClickHouse.
- last point, as of. These are typical for»queries: we look at the last measurement or the state of the system at a given time time-series . For databases, these are not very pleasant queries, but they also need to be executed. t‘Joining’ time series
- — is a time series. If there are two time series, they often need to be combined and correlated. Not all databases make this easy, especially with misaligned time series: here are one timestamps, there are others. Averaging can be done, but there might still be gaps, making it unclear.. Time-series Let's see how these requirements are met in
a schema for ClickHouse.
Scheme
In ClickHouse can be implemented in various ways, depending on the degree of regularity of the data. A system can be built on regular data when we know all metrics in advance. For example, that's how time-series with monitoring CloudFlare — is a well-optimized system. A more general system can be built that monitors the entire infrastructure, various services. In the case of irregular data, we do not know in advance what we are monitoring — and this is probably the most general case. CDN Regular data. Columns.
The schema is simple – columns with the required types: The schema is simple – columns with the required types:
CREATE TABLE cpu (
  created_date Date DEFAULT today(),
  created_at DateTime DEFAULT now(),
  time String,
  tags_id UInt32,
  /* join to dim_tag */
  usage_user Float64,
  usage_system Float64,
  usage_idle Float64,
  usage_nice Float64,
  usage_iowait Float64,
  usage_irq Float64,
  usage_softirq Float64,
  usage_steal Float64,
  usage_guest Float64,
  usage_guest_nice Float64
) ENGINE = MergeTree(created_date, (tags_id, created_at), 8192);
This is a regular table that monitors some activity regarding system load (user, system, idle, nice). Simple and convenient, but not flexible. If we want a more flexible schema, we can use arrays.
Irregular data. Arrays:
CREATE TABLE cpu_alc (
  created_date Date,
  created_at DateTime,
  time String,
  tags_id UInt32,
  metrics Nested(
    name LowCardinality(String),
    value Float64
  )
) ENGINE = MergeTree(created_date, (tags_id, created_at), 8192);

SELECT max(metrics.value[indexOf(metrics.name,'usage_user')]) FROM ...
Structure Nested — are two arrays: metrics.name and metrics.value. Here you can store arbitrary monitoring data, such as an array of names and an array of measurements for each event. For further optimization, instead of one such structure, you can create several. For instance, one for float-value, another for int-value, because int you want to store it more efficiently.
But this structure is more complex to access. You'll have to use a special construct, pulling out values first by index, then from the array:
SELECT max(metrics.value[indexOf(metrics.name,'usage_user')]) FROM ...But this still works sufficiently quickly. Another way to store irregular data is by rows.
Irregular data. Rows. In this traditional method, without arrays, both names and values are stored at once. If one device sends 5,000 measurements at once — 5,000 rows are generated in the DB:
CREATE TABLE cpu_rlc (
  created_date Date,
  created_at DateTime,
  time String,
  tags_id UInt32,
  metric_name LowCardinality(String),
  metric_value Float64
) ENGINE = MergeTree(created_date, (metric_name, tags_id, created_at), 8192);


SELECT
    maxIf(metric_value, metric_name = 'usage_user'),
    ...
FROM cpu_r
WHERE metric_name IN ('usage_user', ...)
ClickHouse copes with this — it has special extensions ClickHouse SQL. For example, maxIf — is a special function that calculates the maximum for a metric under certain conditions. You can write several such expressions in one query and immediately compute values for multiple metrics.
Let's compare three approaches:
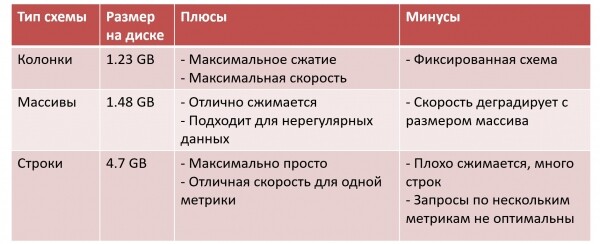
Here I added 'Data Size on Disk' for some test dataset. In the case of columns, we have the smallest data size: maximum compression, maximum query speed, but we pay for the necessity to fix everything right away.
In the case of arrays, it is a bit worse. Data still compresses well, and you can store an irregular schema. But ClickHouse — a columnar database, and when we start storing everything in an array, it turns into a string, and we pay for flexibility with efficiency. For any operation, we'll have to read the entire array into memory, then find the needed element — and if the array grows, the speed degrades.
In one of the companies that uses this approach (for example, ), arrays are split into chunks of 128 elements. Data from several thousand metrics with a volume of 200 TB of data per day is stored not in one array, but across 10 or 30 arrays with special logic for storage.
The simplest approach is with strings. However, data compresses poorly, the table size becomes large, and when queries occur across several metrics, ClickHouse operates suboptimally.
Hybrid schema
Let's assume we chose the schema with an array. But if we know that most of our dashboards show only user and system metrics, we can additionally materialize these metrics from the array at the table level into columns like this:
CREATE TABLE cpu_alc (
  created_date Date,
  created_at DateTime,
  time String,
  tags_id UInt32,
  metrics Nested(
    name LowCardinality(String),
    value Float64
  ),
  usage_user Float64
             MATERIALIZED metrics.value[indexOf(metrics.name,'usage_user')],
  usage_system Float64
             MATERIALIZED metrics.value[indexOf(metrics.name,'usage_system')]
) ENGINE = MergeTree(created_date, (tags_id, created_at), 8192);
When inserting ClickHouse it will automatically calculate them. This combines the pleasant with the useful: the schema is flexible and general, but we extracted the most frequently used columns. I would note that this did not require changing the insertion and ETL, which continues to insert arrays into the table. We simply did ALTER TABLE, added a couple of columns, and ended up with a hybrid and faster schema that can be used right away.
Codecs and compression
For time-series are important, as well as how well you pack the data, because the amount of information can be very large. In ClickHouse there is a set of tools for achieving compression ratios of 1:10, 1:20, or sometimes even more. This means that uncompressed data of 1 TB on disk occupies 50-100 GB. A smaller size is beneficial, allowing for faster reading and processing of data.
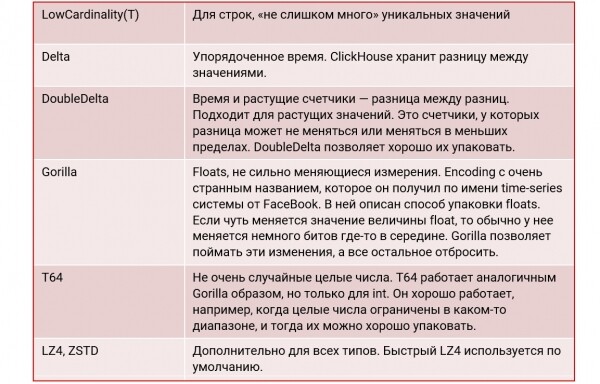
To achieve a high level of compression, ClickHouse it supports the following codecs:
Example table:
CREATE TABLE benchmark.cpu_codecs_lz4 (
    created_date Date DEFAULT today(),
    created_at DateTime DEFAULT now() Codec(DoubleDelta, LZ4),
    tags_id UInt32,
    usage_user Float64 Codec(Gorilla, LZ4),
    usage_system Float64 Codec(Gorilla, LZ4),
    usage_idle Float64 Codec(Gorilla, LZ4),
    usage_nice Float64 Codec(Gorilla, LZ4),
    usage_iowait Float64 Codec(Gorilla, LZ4),
    usage_irq Float64 Codec(Gorilla, LZ4),
    usage_softirq Float64 Codec(Gorilla, LZ4),
    usage_steal Float64 Codec(Gorilla, LZ4),
    usage_guest Float64 Codec(Gorilla, LZ4),
    usage_guest_nice Float64 Codec(Gorilla, LZ4),
    additional_tags String DEFAULT ''
)
ENGINE = MergeTree(created_date, (tags_id, created_at), 8192);
Here we define the codec DoubleDelta in one case, and in the other — Gorilla, and we must also add LZ4 compression. As a result, the size of the data on disk is significantly reduced:
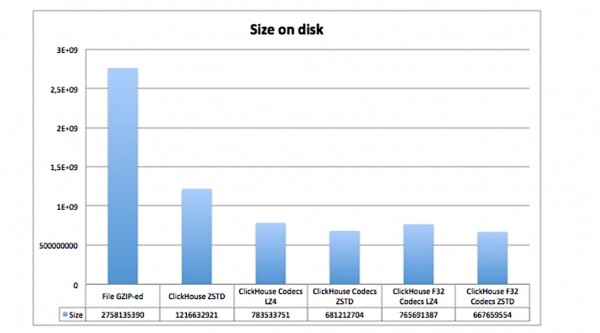
This shows how much space the same data occupies when using different codecs and compressions:
- in a GZIP file on disk;
- in ClickHouse without codecs, but with ZSTD compression;
- in ClickHouse with codecs and LZ4 and ZSTD compression.
It is evident that tables with codecs occupy much less space.
Size matters
Equally important is the correct data type:
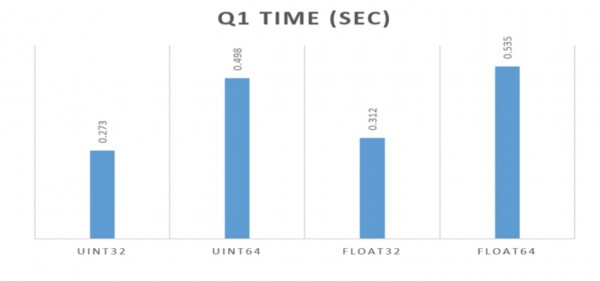
In all the above examples, I used Float64. But if we had chosen Float32, it would have been even better. This was well demonstrated by the folks at Percona in the article linked above. It is crucial to use the most compact type suitable for the task: even less so for disk size, but more so for query speed. ClickHouse is very sensitive to this.
If you can use int32 instead of int64, then expect nearly a twofold increase in performance. The data occupies less memory, and all the "arithmetic" operates much faster. ClickHouse internally — it is a strongly typed system, leveraging all the capabilities provided by modern systems.
Aggregation and Materialized Views
Aggregation and materialized views allow for different aggregations for various use cases:
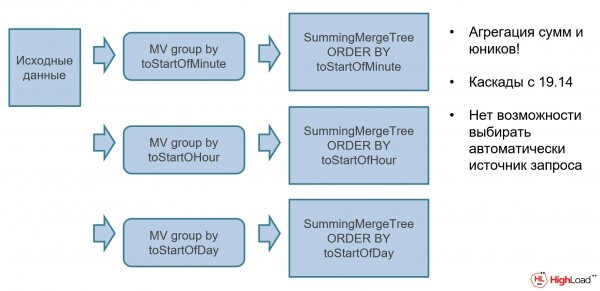
For example, you might have non-aggregated source data, and you can attach various materialized views with automatic summarization through a special engine. SummingMergeTree (SMT). SMT is a special aggregating data structure that automatically computes aggregates. Raw data is inserted into the database, it is automatically aggregated, and dashboards can be used immediately over it.
TTL is used to “forget” old data.
How to “forget” data that is no longer needed? ClickHouse This is possible. When creating tables, you can specify TTL expressions: for example, that minute data is stored for one day, daily data for 30 days, while weekly or monthly data is never touched:
CREATE TABLE aggr_by_minute
…
TTL time + interval 1 day

CREATE TABLE aggr_by_day
…
TTL time + interval 30 day

CREATE TABLE aggr_by_week
…
/* no TTL */
Multi-tier is used to separate data across disks.
Expanding on this idea, data can be stored in ClickHouse different locations. Suppose we want to keep hot data from the last week on a very fast local SSD, while more historical data is stored elsewhere. Currently, in ClickHouse this is possible:
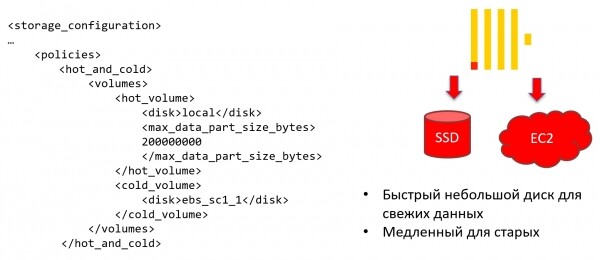
You can configure a storage policy (storage policy) such that ClickHouse automatically transfers data to another storage upon reaching certain conditions.
But that's not all. At the level of a specific table, you can define rules on when data transitions to cold storage based on time. For example, data is kept on a very fast disk for 7 days, after which everything older is moved to a slow disk. This is beneficial as it allows the system to maintain maximum performance while controlling costs and avoiding unnecessary expenses on cold data:
CREATE TABLE
...
TTL date + INTERVAL 7 DAY TO VOLUME 'cold_volume',
    date + INTERVAL 180 DAY DELETE
Unique capabilities ClickHouse
In almost everything, there are these "highlights" in ClickHouse that are leveled by exclusivity — things that are not available in other databases. For example, here are some unique features ClickHouse:
- Arrays. In ClickHouse very good support for arrays, as well as the ability to perform complex computations on them.
- Aggregating data structures. This is one of the "killer features" ClickHouse. Despite what the folks at Yandex may say about not wanting to aggregate data, everyone aggregates in ClickHouse, because it’s fast and convenient.
- Materialized viewsAlong with aggregate data structures, materialized views allow for convenient real-time aggregation.
- ClickHouse SQL. This is an extension of the language SQL with some additional and exclusive features that are only available in ClickHouse. Previously, it was seen as both an extension and a drawback. Now, we have eliminated almost all the disadvantages compared to SQL 92 , and it is now solely an extension.
- Lambdaexpressions. Are they present in any other database?
- ML-support. This exists in various databases, some better than others.
- Open source. We can extend it ClickHouse together. Currently, there are around 500 contributors, and this number is constantly growing. ClickHouse There are clever queries
with many different ways to achieve the same result. For example, you can retrieve the last value from the table in three different ways for
In ClickHouse there's even a fourth way, but it's even more exotic. CPU The first method shows how convenient it is to perform queries when you want to check what
is contained in a subquery. This is something I personally missed in other databases. If I want to compare something with a subquery, in other databases, I can only compare it with a scalar, while for multiple columns, I have to write ClickHouse you can use a tuple: tuple SELECT * FROM cpu WHERE (tags_id, created_at) IN (SELECT tags_id, max(created_at) FROM cpu GROUP BY tags_id) JOIN. In ClickHouse The second method does the same thing but uses the aggregate function
argMaxSELECT argMax(usage_user), created_at), argMax(usage_system), created_at), ... FROM cpu there are several dozen aggregate functions, and if you use combinators, combinatorial rules yield about a thousand.:
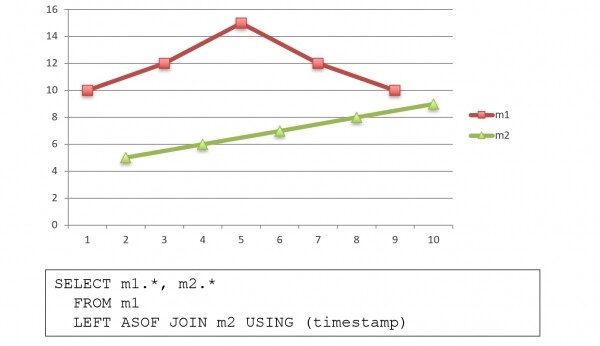
ArgMax In ClickHouse is one of the functions that calculates the maximum value: the query returns the value of usage_user , at which the maximum value is reached. SELECT now() as created_at, cpu.* FROM (SELECT DISTINCT tags_id from cpu) base ASOF LEFT JOIN cpu USING (tags_id, created_at)ASOF JOIN created_at:
is the 'gluing' of rows with different times.
This is a unique function for databases, also found only in kdb+ . If there are two time series with different times, it allows them to be offset and glued in one query. For each value in one time series, the nearest value in the other is found, and they are returned in one line:Analytical functions This is a unique function for databases, also found only in In the standard
SQL-2003
you can write it like this: SQL-2003 you can write like this:
SELECT origin,
       timestamp,
       timestamp -LAG(timestamp, 1) OVER (PARTITION BY origin ORDER BY timestamp) AS duration,
       timestamp -MIN(timestamp) OVER (PARTITION BY origin ORDER BY timestamp) AS startseq_duration,
       ROW_NUMBER() OVER (PARTITION BY origin ORDER BY timestamp) AS sequence,
       COUNT() OVER (PARTITION BY origin ORDER BY timestamp) AS nb
  FROM mytable
ORDER BY origin, timestamp;
In ClickHouse this isn't allowed – it doesn't support the standard SQL-2003 and probably never will. Instead, in ClickHouse it is customary to write it like this:
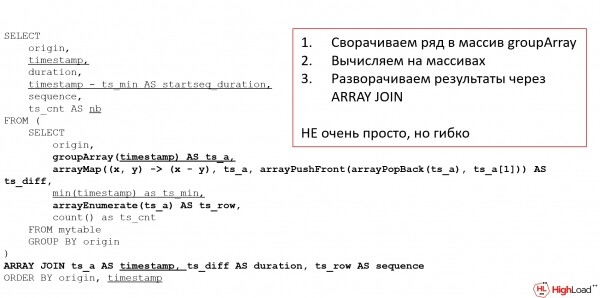
I promised lambdas – here they are!
This is analogous to the analytical query in the standard SQL-2003: it calculates the difference between two timestamp, duration, sequence number – everything we typically consider as analytical functions. In ClickHouse we consider them through arrays: first, we aggregate the data into an array, then we can do whatever we want on the array, and afterwards, we unroll it back. This is not very convenient, requires a love for functional programming at least, but it's very flexible.
Special functions
Additionally, in ClickHouse there are many specialized functions. For example, how to determine how many sessions are occurring simultaneously? A typical monitoring task is to identify the maximum load from a single query. In ClickHouse there is a special function for this purpose:
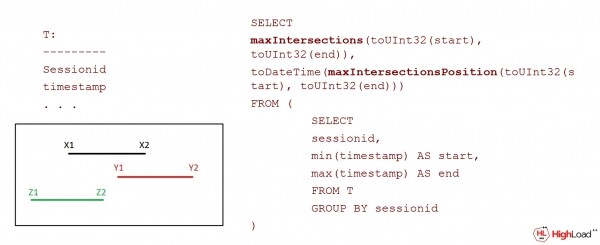
In general, for many purposes, ClickHouse has special functions:
- runningDifference, runningAccumulate, neighbor;
- sumMap(key, value);
- timeSeriesGroupSum(uid, timestamp, value);
- timeSeriesGroupRateSum(uid, timestamp, value);
- skewPop, skewSamp, kurtPop, kurtSamp;
- WITH FILL / WITH TIES;
- simpleLinearRegression, stochasticLinearRegression.
This is not a complete list of functions, there are about 500-600 in total. Hint: all functions in ClickHouse are present in the system table (not all documented, but all are interesting):
select * from system.functions order by nameClickHouse itself stores a lot of information about itself, including log tables, query_log, trace log, data block operation log (part_log), metrics log, and a system log, which is normally written to disk. The metrics log is time-series downward API support (simultaneously with this in ClickHouse in itself ClickHouse: the database can serve as a role time-series of databases, thus 'consuming' itself.
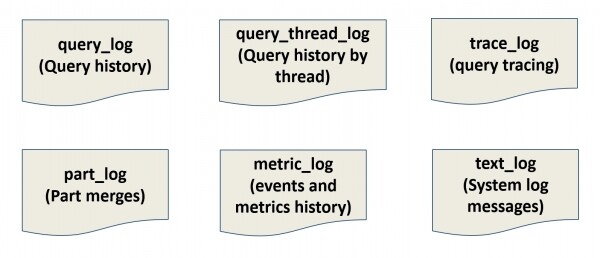
This is also a unique thing – since we do our job well for time-series, why can't we store everything we need within ourselves? We don't need Prometheus, we store everything internally. We connect Grafana and monitor ourselves. However, if ClickHouse fails, we won't see it – why, – therefore, it's usually not done this way.
A big cluster or many small ones ClickHouse
What’s better – one big ClickHouse cluster or many small ones? The traditional approach to DWH — this is a large cluster where schemas are allocated for each application. We approached the database administrator — give us the schema, and we got it.
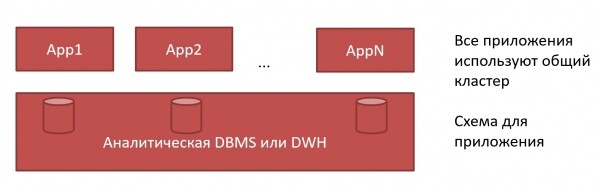
In ClickHouse this can be done differently. Each application can have its own. ClickHouse:
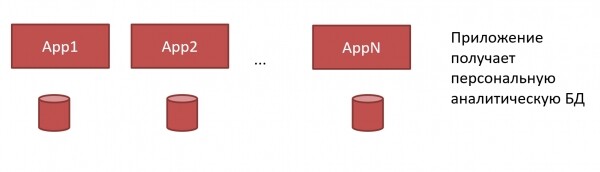
We no longer need a large monolithic DWH and unyielding admins. We can provide each application with its own. ClickHouse, and the developer can do this themselves, since ClickHouse it is very easy to set up and does not require complex administration.
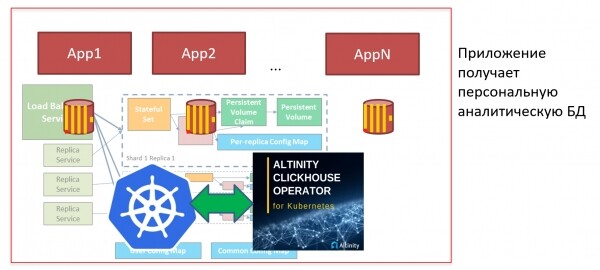
But if we have many ClickHouse, and need to install it frequently, we would like to automate this process. For this, we can use, for example, the Kubernetes and clickhouse-operator. In Kubernetes ClickHouse can be deployed with a click: I can press a button, launch the manifest, and the database is ready. You can immediately create a schema, start loading metrics into it, and in 5 minutes I already have a dashboard. Grafana. It’s that simple!
What’s the result?
So, ClickHouse is:
- Fast. This is well known.
- Simple. This is somewhat debatable, but I believe that tough training leads to easy combat. Once you understand how ClickHouse it works, everything becomes very simple.
- Universal. It fits different scenarios: DWH, Time Series, Log Storage.But this is not an OLTP database, so do not try to make short inserts and reads there.
- Interesting. Probably, anyone who works with ClickHouse, has experienced many interesting moments in both good and bad senses. For example, a new release comes out, and everything stops working. Or when you struggle with a task for two days, but after a question in a Telegram chat, the task is resolved in two minutes. Or like at a conference during Alexey Milovidov's presentation, a screenshot from ClickHouse broke the stream. HighLoad++Such things happen all the time and make our life with ClickHouse bright and interesting!
You can view the presentation .
The long-awaited meeting of developers of high-load systems will take place on November 9 and 10 in Skolkovo. Finally, this will be an offline conference (albeit with all precautionary measures), as the energy of HighLoad++ cannot be contained online.
For the conference, we find and showcase cases about the maximum capabilities of technologies: HighLoad++ has been, is, and will be the only place where you can learn in two days how Facebook, Yandex, VKontakte, Google, and Amazon are structured.
Having held our meetings continuously since 2007, this year we will meet for the 14th time. Over this period, the conference has grown tenfold, with last year's key industry event gathering 3,339 participants, 165 speakers for talks and meetups, and featuring 16 tracks simultaneously.
Last year, we provided 20 buses, 5,280 liters of tea and coffee, 1,650 liters of fruit drinks, and 10,200 bottles of water. Additionally, there were 2,640 kilograms of food, 16,000 plates, and 25,000 cups. By the way, with the money earned from recycled paper, we planted 100 oak saplings 🙂Tickets can be purchased , to receive news about the conference — , and to chat — on all social media: , , and .
Source: habr.com
