

You asked to see real usage examples of our enterprise SSDs and professional tests. We present to you a detailed overview of our SSDs from our partner Truesystems. The experts at Truesystems built a real server and simulated real tasks encountered by all enterprise-class solid-state drives. Let’s read about their results!

Kingston's product line for 2019
First, a bit of dry theory. All Kingston solid-state drives can be divided into four major groups. This classification is conditional, as the same drives can belong to several families at once.
- SATA SSDs in 2.5″, M.2, and mSATA form factors Kingston UV500 and two NVMe interface drive models — Kingston A1000 and Kingston KC2000;
- . The same models as in the previous group plus SATA SSD Kingston A400;
- : UV500 and KC2000;
- . The DC500 series drives, which are the hero of this overview. The DC500 line is divided into DC500R (read-intensive, 0.5 DWPD) and DC500M (mixed workload, 1.3 DWPD).
In testing by Truesystems, there were Kingston DC500R with a capacity of 960 GB and Kingston DC500M with 1920 GB of memory. Let’s refresh our memory about their specifications:
Kingston DC500R
- Capacity: 480, 960, 1920, 3840 GB
- Form factor: 2.5″, height 7 mm
- Interface: SATA 3.0, 6 Gb/s
- Declared performance (for the 960 GB model)
- Sequential access: read — 555 MB/s, write — 525 MB/s
- Random access (4 KB block): read — 98,000 IOPS, write — 20,000 IOPS
- QoS latency (4 KB block, QD=1, percentile 99.9%): read — 500 µs, write — 2 ms
- Emulated sector size: 512 bytes (logical/physical)
- Endurance: 0.5 DWPD
- Warranty period: 5 years
Kingston DC500M
- Capacity: 480, 960, 1920, 3840 GB
- Form factor: 2.5″, height 7 mm
- Interface: SATA 3.0, 6 Gb/s
- Declared performance (for the 1920 GB model)
- Sequential access: read — 555 MB/s, write — 520 MB/s
- Random access (4 KB block): read — 98,000 IOPS, write — 75,000 IOPS
- QoS latency (4 KB block, QD=1, percentile 99.9%): read — 500 µs, write — 2 ms
- Emulated sector size: 512 bytes (logical/physical)
- Endurance: 1.3 DWPD
- Warranty period: 5 years
Truesystems experts noted that Kingston drives specify total latency QoS values as the maximum percentile value of 99.9% (99.9% of all values will be below the specified value). This is a very important indicator, especially for server drives, as they require predictability, stability, and the absence of unexpected lags. If you know the QoS latencies listed in the drive specifications, you can predict its performance, which is very convenient.
Testing Parameters
Both drives were tested in a test setup simulating a server. Its specifications are:
- Intel Xeon E5-2620 V4 processor (8 cores, 2.1 GHz, HT enabled)
- 32 GB of memory
- Supermicro X10SRi-F motherboard (1x socket R3, Intel C612)
- CentOS Linux 7.6.1810
- FIO version 3.14 was used to generate the load
And once again about which SSD drives were tested:
- Kingston DC500R 960 GB (SEDC500R960G)
- Firmware: SCEKJ2.3
- Capacity: 960,197,124,096 bytes
- Kingston DC500M 1920 GB (SEDC500M1920G)
- Firmware: SCEKJ2.3
- Capacity: 1,920,383,410,176 bytes
Testing methodology
A popular test suite was used as a basis , however, the testers made adjustments to make the workloads more representative of actual enterprise SSD use in 2019. In the description of each test, we will note what specifically was changed and why.
IOPS Test
This test measures the number of input/output operations per second for blocks of various sizes (1024 KB, 128 KB, 64 KB, 32 KB, 16 KB, 8 KB, 4 KB, 0.5 KB) and random access with different read/write ratios (100/0, 95/5, 65/35, 50/50, 35/65, 5/95, 0/100). Truesystems experts used the following test parameters: 16 threads with a queue depth of 8. The 0.5 KB (512 byte) block was not tested at all, as its size is too small to significantly load the drives.
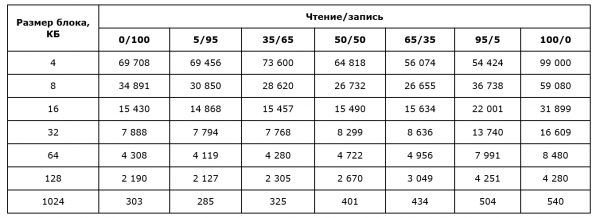
Kingston DC500R in the IOPS test
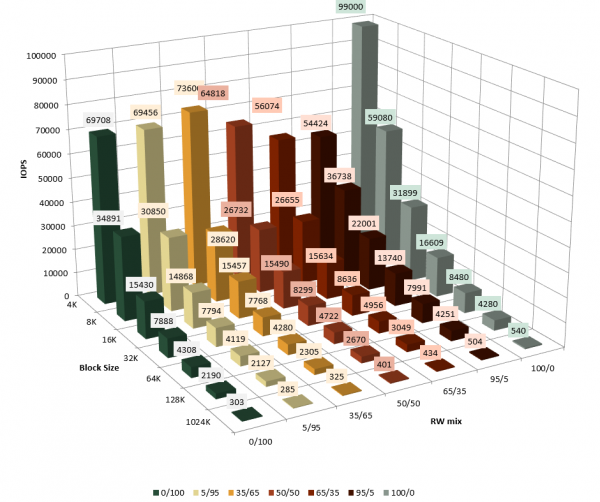
Table data:
Kingston DC500M in the IOPS test
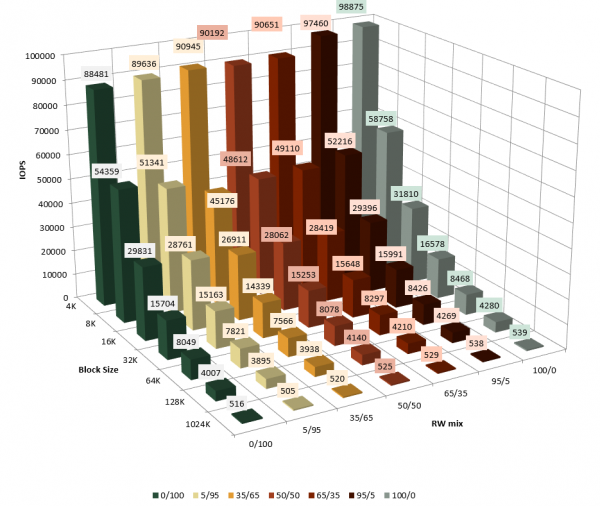
Table data:
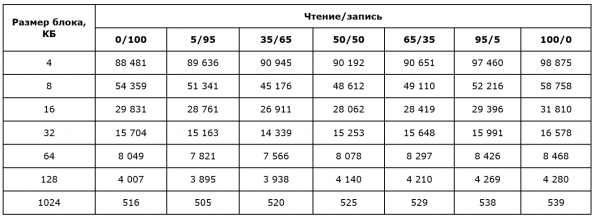
The IOPS test does not assume saturation mode, so it is quite easy to pass. Both drives performed excellently, fully matching the declared factory specifications. The subjects demonstrated outstanding performance in writing blocks of 4 KB: 70 and 88 thousand IOPS. This is great, especially for the read-oriented Kingston DC500R. As for the actual read operations, these SSDs not only exceed their own factory values but also generally approach the peak performance of the SATA interface.
Throughput Test
This test examines the throughput in sequential access. Both SSDs perform sequential read and write operations with blocks of 1 MB and 128 KB. 8 threads with a queue depth of 16 for each thread.
Kingston DC500R:
- 128 KB sequential read: 539.81 MB/s
- 128 KB sequential write: 416.16 MB/s
- 1 MB sequential read: 539.98 MB/s
- 1 MB sequential write: 425.18 MB/s
Kingston DC500M:
- 128 KB sequential read: 539.27 MB/s
- 128 KB sequential write: 518.97 MB/s
- 1 MB sequential read: 539.44 MB/s
- 1 MB sequential write: 518.48 MB/s
And here we also see that the sequential read speed of the SSDs has approached the limit of the SATA 3 interface's throughput. No issues with sequential reading were found with Kingston drives at all.
Sequential write slightly lags behind, which is especially noticeable with the Kingston DC500R, which belongs to the read intensive class, meaning it is designed for intensive reading. Therefore, the Kingston DC500R produced values in this part of the test that were even lower than claimed. However, Truesystems experts believe that for a drive not designed for such loads (recall that the resource for the DC500R is 0.5 DWPD), these over 400 MB/s can still be considered a good result.
Latency Test
As we have noted, this is the most important test for enterprise drives. It allows us to determine the problems that arise during prolonged daily use of an SSD. In the standard SNIA PTS test, the average and maximum latency is measured for various block sizes (8 KB, 4 KB, 0.5 KB) and read/write ratios (100/0, 65/35, 0/100) at a minimum queue depth (1 thread with QD=1). However, in the Truesystems edition, significant enhancements were made to obtain more realistic values:
- The 0.5 KB block was excluded;
- Instead of a single-thread load with queues of 1 and 32, the load varies by the number of threads (1, 2, 4) and queue depth (1, 2, 4, 8, 16, 32);
- Instead of the ratio of 65/35, a 70/30 ratio is used, which is more realistic;
- Not only are average and maximum values provided, but also the 99%, 99.9% percentiles;
- For the selected number of threads, graphs showing the dependency of latency (99%, 99.9%, and average values) on IOPS for all blocks and read/write ratios are constructed.
The data was averaged over four of the 25 rounds lasting 35 seconds each (5 'warm-up' + 30 seconds of load). For the graphs, the Truesystems edition selected a series of values with queue depths from 1 to 32 at 1–4 threads. This was done to assess the performance of the drives considering latency, that is, to obtain the most realistic indicator.
Average latency indicators:
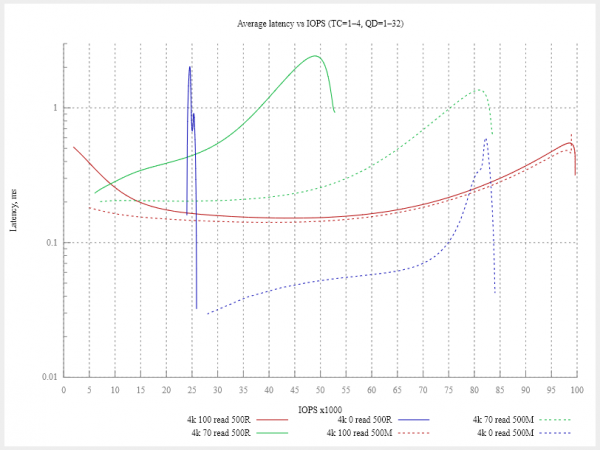
This graph clearly shows the difference between the DC500R and DC500M models. The Kingston DC500R is designed for intensive read operations, so the number of write operations practically does not increase with load, remaining at 25,000.
Looking at a mixed load (70% write and 30% read), the difference between the DC500R and DC500M is also noticeable. If we take the load corresponding to a latency of 400 microseconds, it can be seen that the universal DC500M has three times the performance. This is quite natural and stems from the characteristics of the drives.
An interesting detail is that the DC500M outperforms the DC500R even at 100% read, providing lower latency at the same number of IOPS. The difference is small but very intriguing.
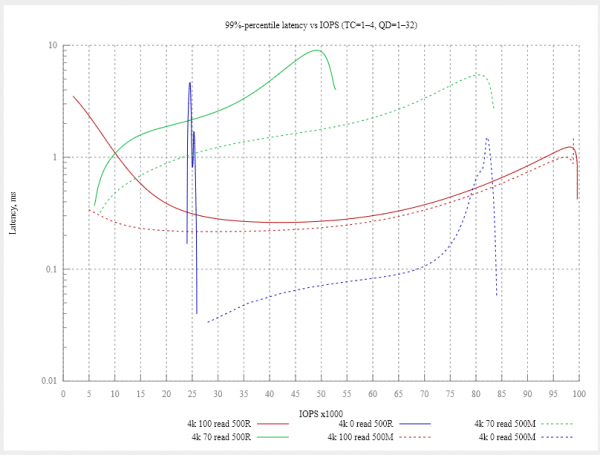
99% latency percentile:
99.9% latency percentile:
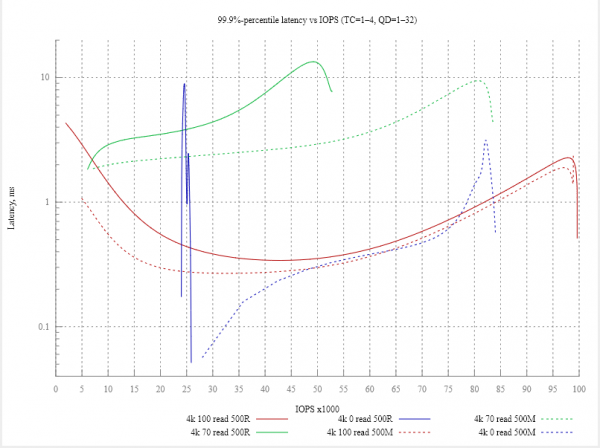
According to these charts, Truesystems experts verified the accuracy of the claimed characteristics regarding QoS latency. The specifications indicated a value of 0.5 ms for read and 2 ms for write for a 4 KB block at a queue depth of 1. We are proud to report that these figures have been confirmed, and by a significant margin. Interestingly, the minimum read latency (280–290 µs for DC500R and 250–260 µs for DC500M) is achieved not at QD=1, but at 2–4.
The write latency at QD=1 was 50 µs (such a low latency is due to the fact that under low load, the cache of the storage is reliably cleared, and we always see the latency when writing to cache). This figure is 40 times lower than the stated value!
Continuous performance test
Another extremely realistic check that studies the change in performance (IOPS and latency) during prolonged intensive operation. A random write scenario with 4 KB blocks over a period of 600 minutes was chosen. The purpose of this test is that under such a load, the SSD drive enters a saturation mode, where the controller continuously engages in garbage collection to prepare free memory blocks for writing. This is the most exhausting mode — exactly what SSDs designed for enterprise use face when installed in real servers.
At the end of the test, Truesystems obtained the following performance metrics:
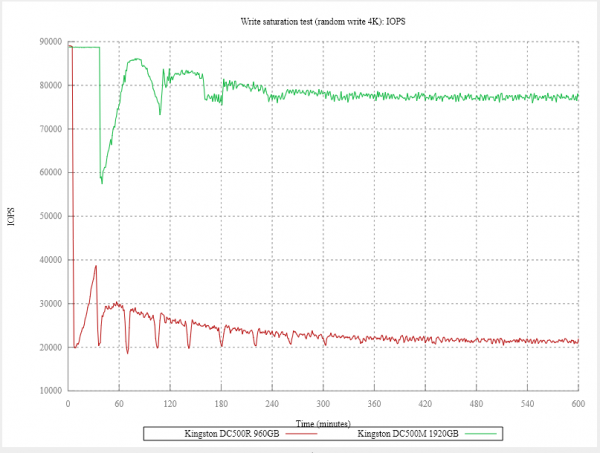
The main result of this part of the test: both Kingston DC500R and Kingston DC500M in real work exceed their own factory values. When the prepared blocks run out, it enters saturation mode, with Kingston DC500R maintaining a level of 22,000 IOPS (instead of 20,000 IOPS). Kingston DC500M stays in the range of 77,000 to 78,000, although the drive profile states 75,000 IOPS. Also, this test clearly shows the difference between the drives: if the workload on the drive involves a high share of write operations, Kingston DC500M proves to be more than three times more productive (also remember that in read operations, DC500M demonstrated better latency).
The latencies during continuous write operations are displayed in the following graph. Median value, percentiles 99%, 99.9% and 99.99%.
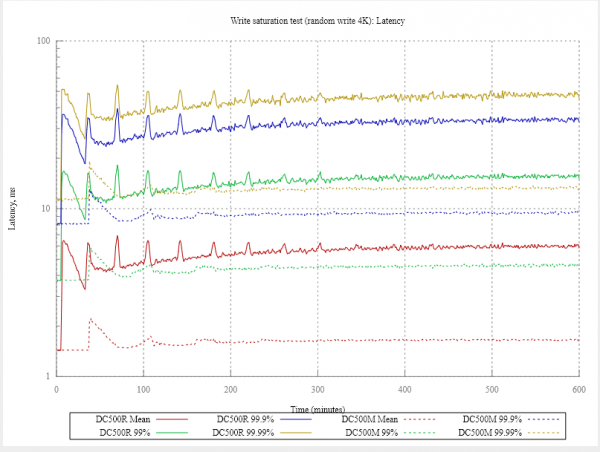
We see that latency for both drives increases proportionally to the drop in performance, without sharp declines or unexplained spikes. This is very good, as predictability is exactly what enterprises expect from storage solutions. Truesystems experts emphasize that the testing was conducted with 8 threads and a queue depth of 16 for each thread, so it's important not just to look at absolute values but at the dynamics. When they tested the DC400, significant latency occurred due to the controller's operation, but in this graph, there are no such issues with Kingston DC500R and Kingston DC500M.
Latency distribution under load
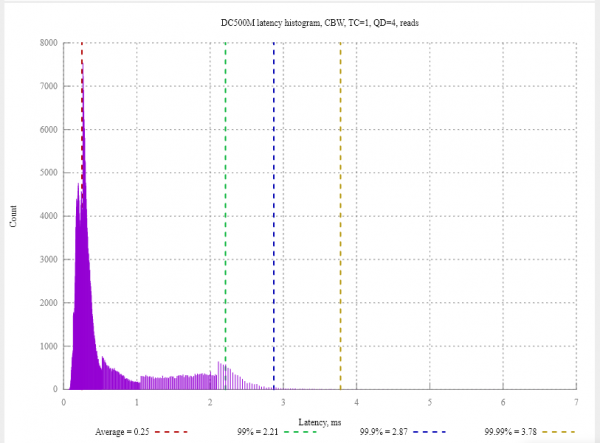
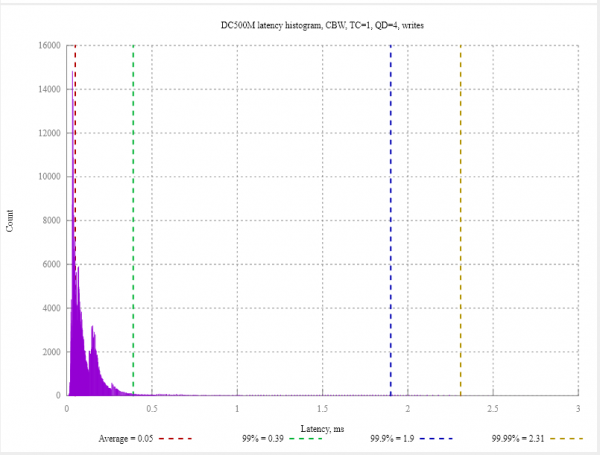
As a bonus, the Truesystems edition ran Kingston DC500R and Kingston DC500M through a simplified test #13 of the SNIA SSS PTS 2.0.1 specification. The distribution of latency under load was investigated using a specific CBW pattern:
Block sizes:
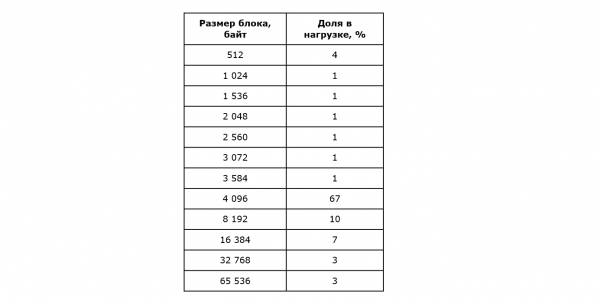
Load distribution by storage volume:

Read/write ratio: 60/40%.
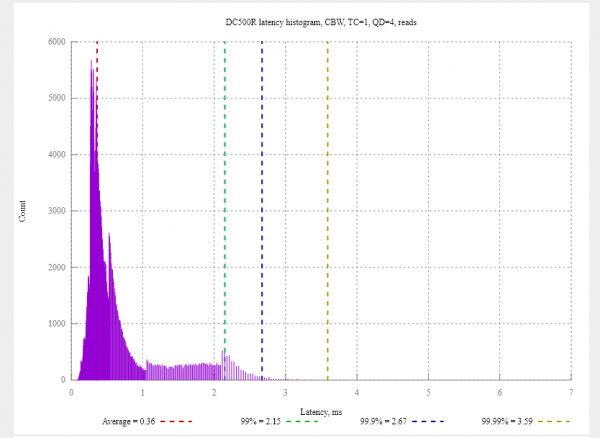
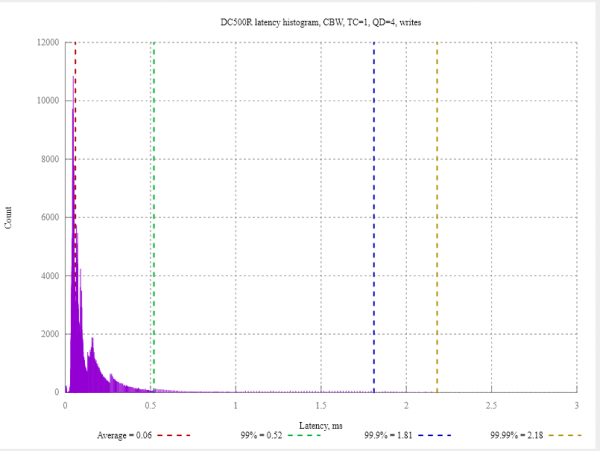
After secure erase and preliminary loading, testers conducted 10 rounds of 60-second main tests for number of threads 1–4 and queue depth 1–32. The result was a histogram of the distribution of values from the rounds corresponding to average performance (IOPS). For both drives, it was reached at one thread with a queue depth of 4.
As a result, the following values were obtained:
DC500R: 17949 IOPS at 594 µs latency
DC500M: 18880 IOPS at 448 µs.
Latency distribution was analyzed separately for reading and writing.
Conclusion
The Truesystems edition concluded that the test results of Kingston DC500R and Kingston DC500M are clearly interpreted as good. Kingston DC500R performs very well with read operations and can be recommended as professional equipment for the appropriate tasks. For mixed loads and increased resource needs, Truesystems recommends Kingston DC500M. The publication also notes the attractive prices for the entire line of Kingston enterprise drives and acknowledges that the transition to TLC 3D-NAND has indeed helped reduce prices without sacrificing quality. Truesystems experts also appreciated the high level of technical support from Kingston and the five-year warranty on the DC500 series drives.
P.S. We remind you that .
For more information about Kingston Technology products, please contact us .
Source: habr.com
