

TL;DR: Four years ago, I left Google with an idea for a new server monitoring tool. The idea was to combine typically isolated functions into a single service. and log analysis, metric collection, and a monitoring dashboard. One of the principles is that the service must be truly fast, providing DevOps with an easy, interactive, enjoyable experience. This requires processing datasets of several gigabytes in fractions of a second without exceeding the budget. Existing log management tools are often slow and clunky, so we faced a solid challenge: to develop a tool that gives users a new experience.
This article describes how we at Scalyr solved this issue by applying time-tested methods with a brute-force approach, eliminating unnecessary layers and avoiding complex data structures. You can apply these lessons to your own engineering challenges.
Old-School Power
Log analysis typically starts with searching: finding all messages that match a certain pattern. In Scalyr, this includes tens or hundreds of gigabytes of logs from many servers. Modern approaches usually involve building some complex data structure optimized for search. I’ve certainly seen this at Google, where they’re quite good at such things. But we settled on a much rougher approach: linear log scanning. And it worked—we provide a search interface that is an order of magnitude faster than the competition (see the animation at the end).
The key insight was that modern processors are incredibly fast at simple, straightforward operations. This can easily be overlooked in complex, multi-layered systems that rely on I/O speed and network operations, which are very common today. Thus, we designed a system that minimizes the number of layers and unnecessary clutter. With multiple processors and servers working in parallel, the search speed reaches 1 TB per second.
Key takeaways from this article:
- Brute-force searching is a perfectly viable approach to solving real, large-scale problems.
- Brute force is a design technique, not a way to avoid work. Like any technique, it is better suited for some problems than others, and it can be implemented poorly or well.
- Brute force is particularly effective for achieving stable performance.
- Effective use of brute force requires code optimization and timely application of sufficient resources. It is suitable if your servers are under heavy load unrelated to user traffic, while user operations remain a priority.
- Performance depends on the design of the entire system, not just the algorithm of the inner loop.
(This article discusses searching data in memory. In most cases, when a user searches logs, Scalyr servers have already cached them. In the next article, we will discuss searching uncached logs. The same principles apply: efficient code, brute-force method with large computational resources).
The brute-force method
Traditionally, searching through a large dataset is done by keyword index. In relation to server logs, this means searching for each unique word in the log. A list of all instances must be compiled for each word. This makes it easy to find all messages containing that word, such as 'error', 'firefox', or 'transaction_16851951' — simply look it up in the index.
I used this approach at Google, and it worked well. But at Scalyr, we search logs byte by byte.
Why? From an abstract algorithmic perspective, keyword indexes are much more efficient than brute-force searches. However, we don’t sell algorithms; we sell performance. And performance not only relies on algorithms but also on systems engineering. We have to consider everything: data volume, type of search, available hardware, and software context. We decided that for our specific problem, a solution like 'grep' is better than an index.
Indexes are great, but they have limitations. Finding a single word is easy. However, searching for messages containing multiple words, such as 'googlebot' and '404', is much more complex. Searching for a phrase like 'uncaught exception' requires a bulkier index that not only logs all messages with that word but also the specific location of the word.
The real challenge arises when you are not searching for words. Suppose you want to see how much traffic comes from bots. The first thought is to search the logs for the word 'bot'. This will help you find some bots: Googlebot, Bingbot, and many others. However, 'bot' here is not a word but a part of one. If you search for 'bot' in the index, you won’t find entries with the word 'Googlebot'. If you check each word in the index and then scan the index by the found keywords, the search will slow down significantly. As a result, some log processing tools do not allow partial word searches or, at best, permit a special syntax with lower performance. We want to avoid that.
Another problem is punctuation. Want to find all requests from 50.168.29.7? Что насчёт отладки логов, содержащих [error]? Индексы обычно пропускают пунктуацию.
Finally, engineers love powerful tools, and sometimes a problem can only be solved with a regular expression. The keyword index is not very suitable for this.
Moreover, indexes are complex. Each entry needs to be added to several keyword lists. These lists should constantly be kept in a searchable format. Queries with phrases, word fragments, or regular expressions need to be translated into operations with multiple lists, and results scanned and combined to produce a resulting set. In the context of a large-scale multi-user service, such complexity creates performance issues that are not visible when analyzing algorithms.
Keyword indexes also take up a lot of space, and storage is a major cost factor in log management systems.
On the other hand, a lot of computational power can be spent on every search. Our users appreciate high-speed searches on unique queries, but such queries are relatively rare. For typical search queries, like those for the dashboard, we employ special techniques (which we will describe in the next article). Other queries are quite infrequent, so it’s rare to handle more than one at a time. But that doesn’t mean our servers aren’t busy: they’re engaged in receiving, analyzing, and compressing new messages, assessing alerts, compressing old data, and so on. Thus, we have quite a substantial reserve of processors that can be utilized for handling requests.
Brute force works if you have a brute problem (and a lot of force).
Brute force works best on simple tasks with small inner loops. Often you can optimize the inner loop to work at very high speeds. If the code is complex, it becomes much harder to optimize.
Initially, our search code had quite a large inner loop. We store messages on 4K pages; each page contains some messages (in UTF-8) and metadata for each message. The metadata is a structure that encodes the value length, internal message ID, and other fields. The search loop looked like this:

This is a simplified version compared to the actual code. But even here, several object placements, data copies, and function calls are visible. The JVM optimizes function calls and allocates ephemeral objects quite well, so this code performed better than we deserved. During testing, clients used it quite successfully. But eventually, we moved to a new level.
(You may wonder why we store messages in such a format with 4K pages, text, and metadata, rather than working directly with logs. There are many reasons that boil down to the fact that the Scalyr engine is more like a distributed database than a file system. Text search is often combined with database-style filters on fields after log parsing. We can simultaneously search across many thousands of logs, and simple text files are not suitable for our transactional, replicated, distributed data management.)
Initially, it seemed that such code was not very suitable for brute-force optimization. The "real work" in String.indexOf() didn't even dominate the CPU profile. In other words, optimizing just this method wouldn’t yield substantial results.
It so happened that we store metadata at the beginning of each page, while the text of all messages in UTF-8 is packed at the other end. Taking advantage of this, we rewrote the loop to search across the entire page at once:
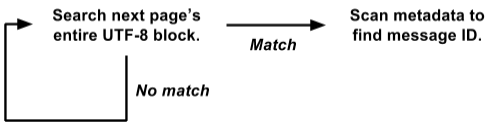
This version operates directly on the raw byte[] view and performs a search for all messages across the entire 4K page at once.
It’s much easier to optimize for the brute-force method. The internal search loop is invoked simultaneously for the entire 4K page, rather than separately for each message. There’s no data copying or object allocation. More complex operations involving metadata are triggered only when a positive result is found, not for every message. Thus, we eliminated a ton of overhead, and the remaining load is concentrated in a small internal search loop, which is well-suited for further optimization.
Our actual search algorithm is based on . It resembles the Boyer–Moore algorithm with a skip of approximately the length of the search string at each step. The main difference is that it checks two bytes at a time to minimize false matches.
Our implementation requires the creation of a 64K search table for each query, but that is trivial compared to the gigabytes of data we are searching through. The internal loop processes several gigabytes per second on a single core. In practice, stable performance is around 1.25 GB per second on each core, and there is potential for improvement. Some overheads outside the internal loop can be eliminated, and we plan to experiment with the internal loop in C instead of Java.
Harnessing power
We discussed that log searching could be implemented 'bruteforce', but how much 'power' do we have? Quite a bit.
1 core: when used correctly, a modern processor core is quite powerful on its own.
8 cores: we are currently running on Amazon servers hi1.4xlarge and i2.4xlarge SSD, each with 8 cores (16 threads). As mentioned earlier, these cores are usually occupied with background operations. When a user performs a search, the background operations are paused, freeing all 8 cores for the search. The search typically completes in a fraction of a second, after which background work resumes (the control program ensures that the flood of search queries does not interfere with important background tasks).
16 cores: for reliability, we organize servers into master/slave groups. Each master has one SSD server and one EBS in its charge. If the master server goes down, the SSD server immediately takes its place. Most of the time, the master and slave operate normally, so each data block is available for searching on two different servers (the slave EBS server has a weak processor, so we do not consider it). We divide the task between them, giving us a total of 16 cores available.
Many cores: in the near future, we will distribute the data across servers in such a way that all of them participate in processing each non-trivial request. Every core will be utilized. [Note: we have implemented a plan and increased the search speed to 1 TB/s, see the note at the end of the article].
Simplicity ensures reliability
Another advantage of the brute force method is its fairly stable performance. Generally, searching is not very sensitive to the specifics of the task and the dataset (I think this is why it is called 'bruteforce').
The keyword index sometimes provides incredibly fast results, while other times it does not. Suppose you have 50 GB of logs where the term 'customer_5987235982' appears exactly three times. A search for this term counts three locations directly from the index and completes instantly. But a complex search with wildcards can scan thousands of keywords and take a long time.
On the other hand, a brute force search for any query runs at more or less the same speed. Searching for long words is better, but even searching for a single character happens quite quickly.
The simplicity of the brute force method means that its performance is close to the theoretical maximum. There are fewer chances for unexpected disk overload, locking conflicts, pointer chasing, and thousands of other reasons for failures. I just looked at the queries made by Scalyr users last week on our busiest server. There were 14,000 queries. Exactly eight of them took more than one second; 99% completed within 111 milliseconds (if you haven’t used log analysis tools, trust me: it's fast).
Stable, reliable performance is crucial for the usability of the service. If it occasionally lags, users will perceive it as unreliable and will be reluctant to use it.
Log search in action
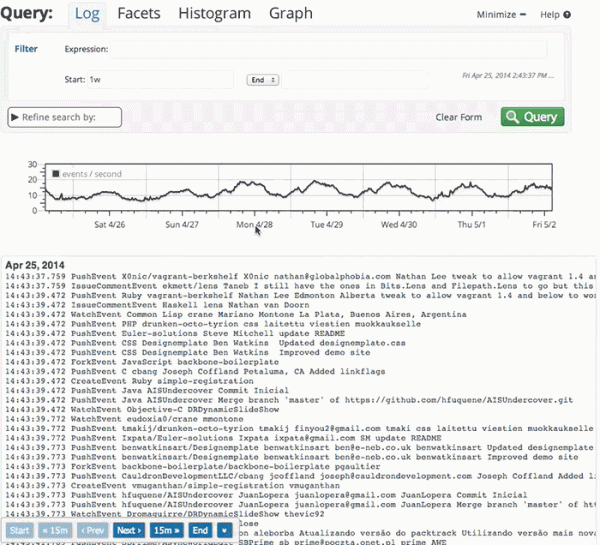
Here’s a short animation showing Scalyr's search in action. We have a demo account where we import every event from every public Github repository. In this demonstration, I’m examining data from the past week: about 600 MB of raw logs.
The video was recorded live, without special preparation, on my desktop (about 5000 kilometers from the server). The performance you will see is largely thanks to , as well as a fast and reliable backend. Whenever there is a pause without a 'loading' indicator, that’s me pausing so you have time to read what I’m about to click.
In conclusion
When processing large volumes of data, it's important to choose a good algorithm, but 'good' doesn't mean 'fancy'. Consider how your code will perform in practice. Some factors that may be significant in the real world fall out of theoretical algorithm analysis. Simpler algorithms are easier to optimize and more stable in edge cases.
Also, think about the context in which the code will be executed. In our case, powerful servers are required to handle background tasks. Users relatively rarely initiate searches, so we can temporarily borrow a whole pool of servers for the short period necessary to execute each search.
Using the brute force method, we implemented a fast, reliable, and flexible search across a set of logs. We hope these ideas will be useful for your projects.
Edit: the headline and text changed from 'Search at 20 GB per second' to 'Search at 1 TB per second' to reflect the performance increase over the past few years. This speed increase is primarily due to changes in the type and number of EC2 servers we are deploying today to serve the growing customer base. Upcoming changes are expected to provide another significant boost in efficiency, and we look forward to sharing this news.
Source: habr.com
