

Six months ago — a public for PostgreSQL.
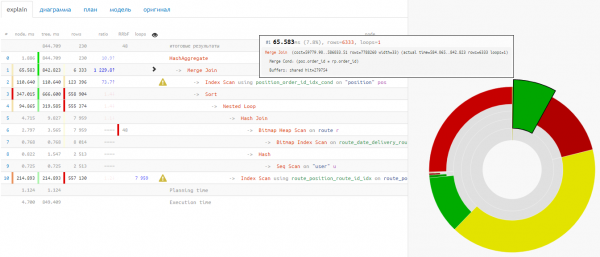
Over the past months, we have made a report on it , prepared a summary based on the recommendations it provides… but most importantly, we gathered your feedback and observed real use cases.
And now we are ready to discuss the new features you can use.
Support for different plan formats
The plan from the log, along with the query
We highlight the entire block directly from the console, starting from the line with Query Text, with all leading spaces:
        Query Text: INSERT INTO dicquery_20200604 VALUES ($1.*) ON CONFLICT (query)
                           DO NOTHING;
        Insert on dicquery_20200604  (cost=0.00..0.05 rows=1 width=52) (actual time=40.376..40.376 rows=0 loops=1)
          Conflict Resolution: NOTHING
          Conflict Arbiter Indexes: dicquery_20200604_pkey
          Tuples Inserted: 1
          Conflicting Tuples: 0
          Buffers: shared hit=9 read=1 dirtied=1
          ->  Result  (cost=0.00..0.05 rows=1 width=52) (actual time=0.001..0.001 rows=1 loops=1)
… and we just paste everything copied directly into the plan field, without separating anything:
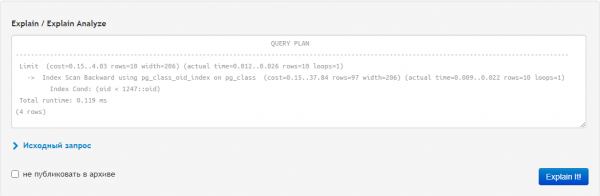
In the end, we also get as a bonus to the analyzed plan the 'context' tab, where our query is presented in full glory:
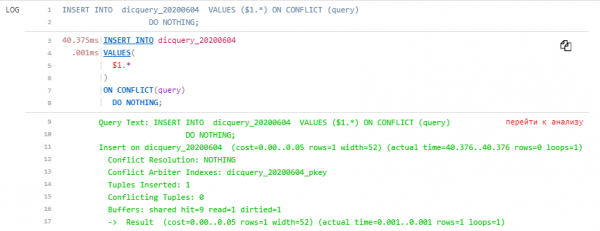
JSON and YAML
EXPLAIN (ANALYZE, BUFFERS, FORMAT JSON)
SELECT * FROM pg_class;
"[
{
"Plan": {
"Node Type": "Seq Scan",
"Parallel Aware": false,
"Relation Name": "pg_class",
"Alias": "pg_class",
"Startup Cost": 0.00,
"Total Cost": 1336.20,
"Plan Rows": 13804,
"Plan Width": 539,
"Actual Startup Time": 0.006,
"Actual Total Time": 1.838,
"Actual Rows": 10266,
"Actual Loops": 1,
"Shared Hit Blocks": 646,
"Shared Read Blocks": 0,
"Shared Dirtied Blocks": 0,
"Shared Written Blocks": 0,
"Local Hit Blocks": 0,
"Local Read Blocks": 0,
"Local Dirtied Blocks": 0,
"Local Written Blocks": 0,
"Temp Read Blocks": 0,
"Temp Written Blocks": 0
},
"Planning Time": 5.135,
"Triggers": [
],
"Execution Time": 2.389
}
]"Whether with external quotes, as pgAdmin copies it, or without — we throw it into the same field, and the output is beautiful:

Extended visualization
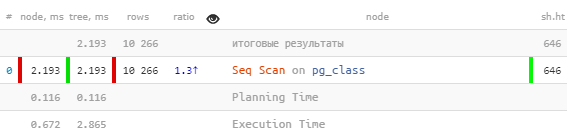
Planning Time / Execution Time
Now it is clearer where the extra time went during query execution:
I/O Timing
Sometimes, we encounter a situation where the plan shows not much resource reading/writing, yet the execution time seems disproportionately large.
Here, we have to say: "Oh, probably at that moment the disk on the server was too overloaded, so reading took so long!" But that's not very precise…
But this can be determined absolutely reliably. The fact is that among the configuration options for the PG server, there is :
Includes measuring the time of input/output operations. This parameter is disabled by default because it requires constantly querying the current time from the operating system, which can significantly slow down performance on some platforms. To evaluate the timing overhead on your platform, you can use the pg_test_timing utility. I/O statistics can be obtained through the pg_stat_database view, in the output of EXPLAIN (when using the BUFFERS parameter) and through the pg_stat_statements view.
This parameter can also be enabled within a local session:
SET track_io_timing = TRUE;Now, the most exciting part — we have learned to understand and display this data considering all execution tree transformations:
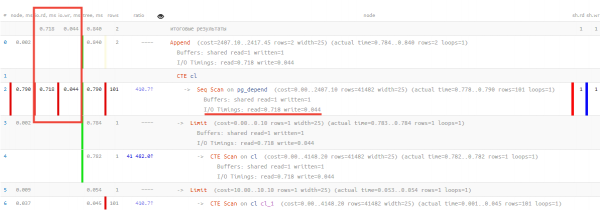
Here, we can observe that out of 0.790ms of total execution time, 0.718ms was spent reading a single data page, 0.044ms on writing it back, and only 0.028ms on all other useful activities!
The Future with PostgreSQL 13
You can check out the complete overview of the new features in , and we will specifically address the changes in plans.
Planning Buffers
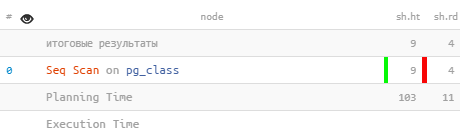
The accounting of resources allocated to the planner has also been reflected in another patch unrelated to pg_stat_statements. EXPLAIN with the BUFFERS option will report the number of buffers used at the planning stage:
 Seq Scan on pg_class (actual rows=386 loops=1)
   Buffers: shared hit=9 read=4
 Planning Time: 0.782 ms
   Buffers: shared hit=103 read=11
 Execution Time: 0.219 ms
Incremental Sorting
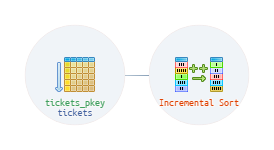
In cases where sorting by multiple keys (k1, k2, k3…) is necessary, the planner can now make use of the knowledge that data is already sorted by some of the initial keys (e.g., k1 and k2). In this scenario, it is possible to avoid re-sorting all the data, splitting it into sequential groups with the same k1 and k2 values, and “doing a partial sort” by the k3 key.
Thus, the entire sorting is broken down into several sequential sorts of smaller size. This reduces the amount of memory required and also allows the first data to be released earlier than the entire sorting process is completed.
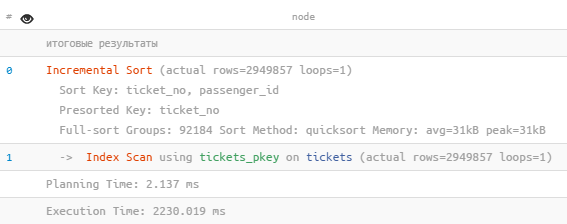
 Incremental Sort (actual rows=2949857 loops=1)
   Sort Key: ticket_no, passenger_id
   Presorted Key: ticket_no
   Full-sort Groups: 92184 Sort Method: quicksort Memory: avg=31kB peak=31kB
   ->  Index Scan using tickets_pkey on tickets (actual rows=2949857 loops=1)
 Planning Time: 2.137 ms
 Execution Time: 2230.019 ms
UI/UX improvements
Screenshots are everywhere!
Now, each tab has the ability to quickly take a screenshot of the tab to the clipboard full width and depth of the tab — the ‘crosshair’ at the top right:
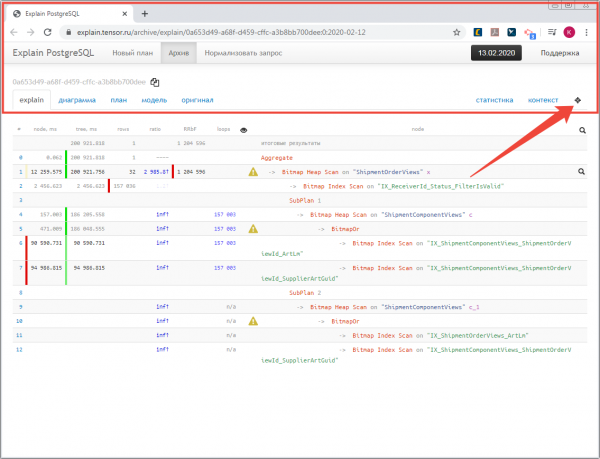
In fact, most images for this publication were obtained this way.
Recommendations on nodes
Not only have there been more, but you can also , following the link:

Removal from the archive
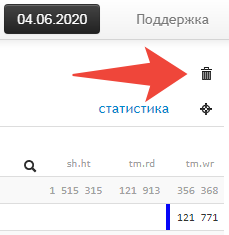
Some have really asked to add the ability to delete 'completely' even unpublished plans in the archive — just click the corresponding icon:
Also, don't forget that we have a , where you can send your comments and suggestions.
Source: habr.com
