

Metrics are nonsense, you might say, and you would be right. In some respects.
Indeed, when it comes to metrics, the very first one that comes to mind is traffic.
Many enjoy meditating for hours while looking at their website's traffic graph.
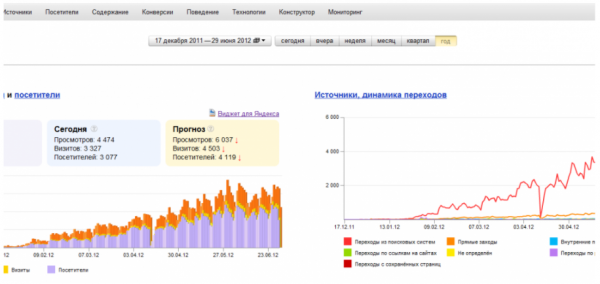
How awesome it is to watch the line jump up and down, back and forth... Even cooler when the website traffic keeps increasing steadily.
Then a blissful warmth flows through the body, and the mind ascends to the heavens in anticipation of heavenly manna.
Oh, what joy, what bliss!

And even if the picture is dreary...
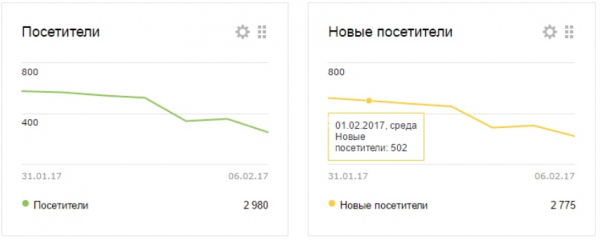
You just can't take your eyes off the graph; it's so captivating.

It seems that a secret meaning is hidden in the graph. Just a little more, and the picture will reveal its secrets and tell an incredibly simple and effective way to attract a huge number of clients. Then the money will surely flow in like a river.
But in reality, traffic is a typical 'syrupy (vain) metric' that doesn't hold any useful meaning.
And most metrics are like that. Most of the metrics you see are syrupy. And that’s why metrics have gained a bad reputation as a pointless waste of time and effort.
But that's really not the case. Proper metrics provide extremely important, sometimes invaluable information for a business or project.
The main bonus and purpose of metrics is that they give you the ability to manage your business or project.
How can you determine if a metric is bad?
Let’s consider a very simple example—car speed.
Please tell me, what does speed mean...
100 km/h?

Hmm...
Hmm...
So what does it actually mean?
I think you might have guessed that... it means nothing!
Okay. Now, the second question:
Is 100 km/h good or bad?
Hmm...
Neither?
Right!
Speed is a completely useless and pointless metric by itself. Of course, when used in conjunction with other metrics it might convey something, but by itself—definitely not.
Website traffic is exactly the same as speed.

That's why staring at a website's traffic graph makes no sense at all. It won't reveal the secret of life to you. Do you understand now?
So what metrics are good then?
For example, the Churn rate. This metric indicates how many customers have permanently left the company/website over time.
A Churn rate of 1% means we are losing only 1% of customers. In other words, we are hardly losing anyone.
However, if the Churn rate is 90%, it means we are losing almost all of our customers. That's terrible!
Do you see the difference between this metric and speed?
The Churn rate is a meaningful metric that answers the question of whether this is good or bad. And you don't have to guess what it means.
This is a metric that speaks for itself!
And now we are ready to take urgent action to reduce customer churn.
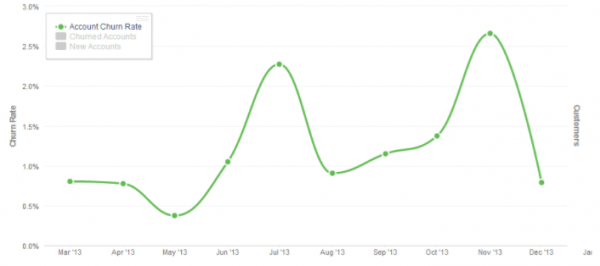
This is why such metrics are called actionable. Because they prompt action.
The criterion of 'vanity' metrics
There’s a very simple way to determine if a metric is 'vanity'.
Most absolute metrics, such as traffic, downloads, retweets, email subscribers, likes, etc. are considered vanity metrics..
Relative, weighted metrics are often actionable. But not all of them!
When it comes to qualitative metrics, there is no clarity, as qualitative assessment itself cannot be precise and unambiguous.
On the other hand, the convenience of the program should and can be assessed solely by the level of perception of end-users and nothing else.
How should we approach metrics in general?
First, you need to shift your mindset.
No joke.
Everyone(!) who encounters metrics starts by looking for the reason for their existence. Unfortunately, they won’t show it.
Metrics are just like an ordinary ruler that measures everything we want.

You wouldn’t look for the reason for existence in an ordinary wooden ruler, would you?

Looking for the meaning of life in a ruler is what we call a 'bottom-up approach'.
To work correctly with metrics, you need to change the paradigm and start working the other way around, top-down.
That is, first, take some action, and then use metrics to measure the resulting effect.
Metrics should be used as ordinary measuring tools and nothing more.
Think about these words.
Measure the effect of your actions using metrics, rather than invent actions based on the readings of a wooden ruler.
This approach is also referred to as “Hypothesis->Measurement.”
Okay, that's clear.
Question #2: “What exactly should we measure? How to find the right metrics?”
How to create your own set of metrics?
If you browse the Internet, you will surely find dozens, if not hundreds, of various metrics on the same topic.
For example, there are about a hundred metrics for software quality. These include GOST R ISO standards, metrics calculated in SonarQube, some custom ones, and even “qualitative” metrics based on user feedback.
So which ones should be used, and which ones shouldn’t?
The best approach is to be guided by the “core value.”
OMTM (One Metric That Matters)
Let’s consider an example.
It’s clear that if you want to improve the quality of your software product, you can measure that quality in various ways.
Quality is not just the number of errors. If you look at quality as a whole, it includes:
the number of incidents in production,
ease of use and simplicity of perception,
speed of operation,
completeness and timeliness of the implementation of planned functionality,
security.
There are many criteria, and it’s impossible to work with all of them at once. The approach is quite simple: choose one, the most important criterion at the moment, and work only with that.
This approach is called OMTM (One Metric That Matters) — One (Single) Important Metric.
For software quality, it makes sense to choose the number of serious (important and critical) incidents in the production environment.
For online stores, there’s no need to think too hard about OMTM — it’s sales volume or profit (depending on your decision).
This One Important Metric will be the core value for your set of metrics. It will directly influence their final composition.
Value Inside
Often, metric sets are compiled “randomly,” diving into the Internet and selecting the best options found based on the principle: “Oh! This will work for us!”
As you can understand, this is not the best approach, right?
But how to decide which metric to take and which to leave?
For example, various types of user conversions are often measured.
But why specifically measure users, and not something else? Have you ever thought about this question?
Naturally, there is an answer.
Let’s consider an online store as the simplest example to understand.
Suppose you want to increase sales volume. What metrics do you need for this? How should you approach it?
There is one simple, logical, and effective way. Everything falls into place when you answer the question:
WHO CREATES VALUE?
After all, we are working to increase sales volume, right? We want to boost it, correct?
Who and what needs to be influenced to increase sales volume?
Of course,
You need to influence the cause —
the one who 'creates' value.
Who generates revenue in an online store? Where does the money come from?
Very simply: from customers.
Where exactly in the online store can we influence customers?
Anywhere!
That's right. At every stage of the customer lifecycle.
To visualize the customer lifecycle, it is convenient to build a so-called 'funnel' of customer movement through the process.
Example of an online store funnel:
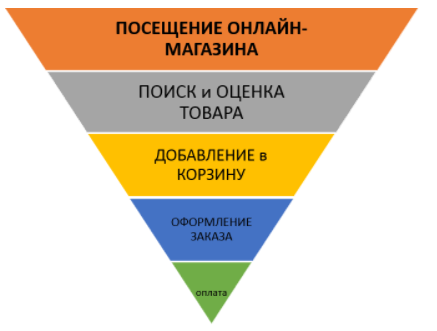
Why just so? Because customers get lost precisely during transitions from one step of the funnel to another.
By increasing the number of customers at any level of the funnel, we automatically increase the resulting sales volume.
A simple example.
The metric 'Abandoned Cart Rate' essentially shows conversion from the shopping cart to a completed order.
Suppose, in the first measurement, you found that 90% of carts are abandoned; that is, out of 10 carts, only 1 order is completed.
Something is clearly wrong with the shopping cart, right?
For simplicity, let's assume the total amount of one order is 100 rubles. Thus, the total sales volume will be only 100 rubles.
As a result of the cart modifications, the abandoned cart rate decreased by 10% to 80%. How does this look in numbers?
Out of 10 carts, 2 orders are now completed. 100 rubles * 2 = 200 rubles.
But that's a 100% increase in sales volume! Bingo!
By increasing the step conversion by just 10%, you increased sales volume by 100%.
Fantastic!
But that's exactly how it works.
Do you now understand the beauty of well-structured metrics?
With their help, you can achieve fantastic influence on your processes.
It's quite straightforward with an online store, but how do we apply this, say, to the quality of a software product? Just the same way:
- We choose the main value we are working on. For example, reducing the number of incidents in production.
- We understand who and what generates this value. For example, the source code.
- We build a lifecycle funnel for the source code and set metrics at each stage of the funnel. Everything.
For example, here are some quality metrics that could be derived (off the top of my head)...
Value Indicator:
- defect density in production per 1,000 lines of code
Metrics based on the source code lifecycle:
- percentage of failed compilations,
- test coverage,
- percentage of failed tests,
- percentage of failed deployments.
Metrics based on the defect lifecycle:
- defect detection dynamics,
- fixing dynamics,
- reopening dynamics,
- defect deviation dynamics,
- average wait time for fixes,
- average fix time.
Summary
As you can see, the topic of metrics is indeed very important, necessary, and interesting.
How to choose metrics correctly:
Select OMTM, consider its main value, and measure its value producers.
Build metrics based on the lifecycle funnel of the producer.
Try not to use absolute metrics.
What else to read on this topic
The topic of metrics has gained popularity with the Lean Startup movement, so it's best to start reading from the primary sources — the book 'Lean Startup' (translated into Russian as 'Business from Scratch: The Lean Startup Method' on Ozon) and 'Lean Analytics' (there's no translation, but the book is available in English on Ozon).
Some information can be found online even in Russian, but, unfortunately, a comprehensive textbook has yet to be found, even in the western segment.
By the way, there are now even specialists known as 'productologists,' whose task is to build the right metrics system for their product and suggest ways to improve it.
That's all.
If this article helped you better understand the essence of the issue, the author would appreciate a 'like' and a share.
Source: habr.com
