

This is the second part of a series of articles about analytical systems ().
Today, there is no doubt that the accurate processing of data and the interpretation of results can help almost any type of business. In this regard, analytical systems are becoming more and more loaded with parameters, the number of triggers and user events in applications is growing.
Because of this, companies are giving their analysts more and more "raw" information to analyze and turn it into the right decisions. The importance of an analytics system for a company should not be underestimated, and the system itself should be reliable and sustainable.
Client analysts
Client analytics is a service that a company connects for its website or application through the official SDK, integrates it into its own codebase, and selects event triggers. This approach has an obvious drawback: all the collected data cannot be fully processed as you would like, due to the limitations of any chosen service. For example, on one system it will not be easy to run MapReduce tasks, on another you will not be able to run your model. Another disadvantage will be a regular (impressive) bill for services.
There are many client analytics solutions on the market, but sooner or later, analysts are faced with the fact that there is no one universal service suitable for any task (while the prices for all these services are constantly growing). In such a situation, companies often decide to create their own analytics system with all the necessary custom settings and features.
Server Analysts
Server-side analytics is a service that can be deployed internally on a company's own servers and (usually) in-house. In this model, all user events are stored on internal servers, allowing developers to try different databases for storage and choose the most convenient architecture. And even if you still want to use third-party client-side analytics for some tasks, it will still be possible.
Server-side analytics can be deployed in two ways. First: choose some open source utilities, deploy them on your machines and develop business logic.
pros
Cons
You can customize anything
Often it is very difficult and separate developers are needed
Second: take SaaS services (Amazon, Google, Azure) instead of deploying it yourself. We will talk about SaaS in more detail in the third part.
pros
Cons
It can be cheaper on medium volumes, but with a large increase it will still become too expensive
Not able to control all parameters
Administration is entirely shifted to the shoulders of the service provider
It is not always known what is inside the service (may not be needed)
How to collect server analytics
If we want to get away from using client analytics and build our own, first of all we need to think over the architecture of the new system. Below I will tell you step by step what you need to consider, why each of the steps is needed and what tools you can use.
1. Data acquisition
Just as in the case of client analytics, first of all, company analysts select the types of events that they want to study further and collect them in a list. Usually, these events occur in a certain order, which is called the "event scheme".
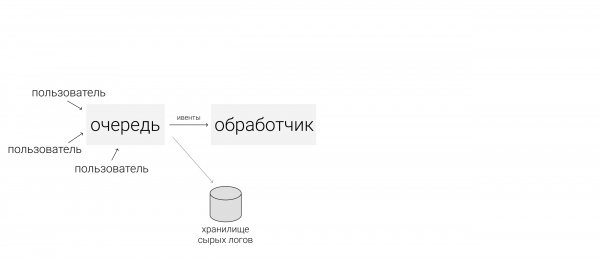
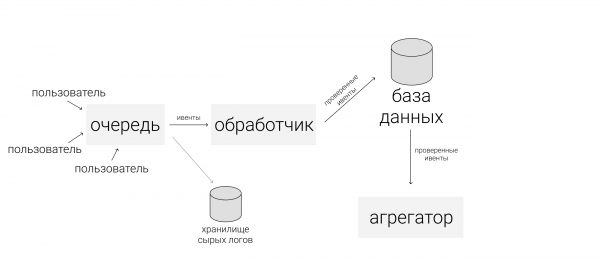
Further, let's imagine that a mobile application (website) has regular users (devices) and many servers. To securely transfer events from devices to servers, an intermediate layer is needed. Depending on the architecture, several different event queues can occur.
- Is , which is used as a queue for collecting events.
According to in 2014, the creator of Apache Kafka decided to name the software after Franz Kafka because “it's a write-optimized system” and because he loved Kafka's writings. —
In our example, there are many data producers and their consumers (devices and servers), and Kafka helps connect them to each other. Consumers will be described in more detail in the next steps, where they will be the main actors. Now we will consider only data producers (events).
Kafka encapsulates the concepts of queue and partition, more specifically about this it is better to read elsewhere (for example, in ). Without going into details, let's imagine that a mobile application is launched for two different operating systems. Then each version creates its own separate event stream. Producers send events to Kafka, they are recorded in a suitable queue.
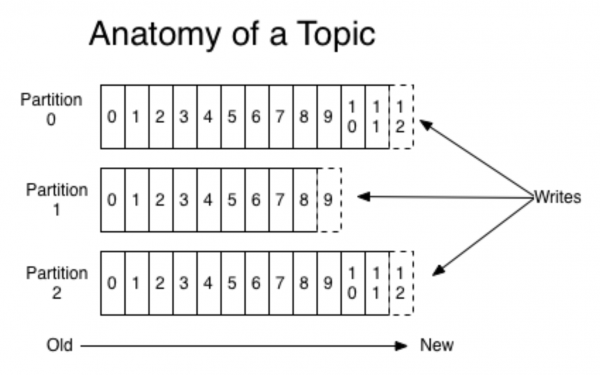
(picture )
At the same time, Kafka allows you to read in chunks and process the flow of events in mini-batches. Kafka is a very convenient tool that scales well with growing needs (for example, by geolocation of events).
Usually one shard is enough, but things get more complicated with communication when scaling (as always). Probably no one wants to use only one physical shard in production, since the architecture must be fault-tolerant. In addition to Kafka, there is another well-known solution - RabbitMQ. We didn't use it in production as a queue for event analytics (if you have such experience, tell us about it in the comments!). However, AWS Kinesis was used.
Before moving on to the next step, one more additional layer of the system needs to be mentioned - the storage of raw logs. This is not a mandatory layer, but it will be useful in case something goes wrong and the event queues in Kafka are reset to zero. Storing raw logs does not require a complex and expensive solution, you can simply write them somewhere in the correct order (even to a hard drive).

2. Handling event streams
After we have prepared all the events and placed them in the appropriate queues, we move on to the processing step. Here I will talk about the two most common processing options.
The first option is to enable Spark Streaming on an Apache system. All Apache products live on HDFS, a secure replica file system. Spark Streaming is an easy-to-use tool that processes streaming data and scales well. However, it can be hard to maintain.
Another option is to build your own event handler. To do this, for example, you need to write a Python application, build it in docker, and subscribe to Kafka's queues. When triggers come to handlers in the docker, processing will start. With this method, you need to keep constantly running applications.
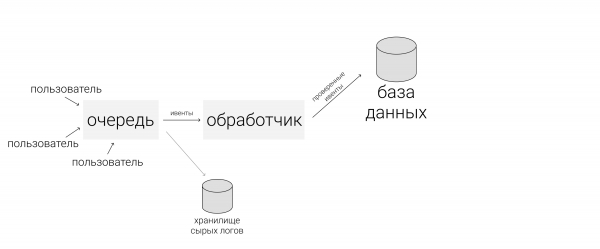
Let's assume that we have chosen one of the options described above and move on to the processing itself. Processors should start by checking the validity of the data, filtering out garbage and "broken" events. For validation we usually use . After that, data mapping can be done: data from different sources are normalized and standardized in order to be added to a common table.
3. Database
The third step is to save normalized events. When working with a ready-made analytical system, we will often have to access them, so it is important to choose a convenient database.
If the data fits well on a fixed schema, you can choose or some other column database. So aggregations will work very quickly. The downside is that the scheme is rigidly fixed and therefore it will not work to add arbitrary objects without refinement (for example, when a non-standard event occurs). But it can be done really fast.
For unstructured data, you can take NoSQL, for example, . It runs on HDFS, replicates well, you can raise many instances, and is fault tolerant.
You can raise something simpler, for example, . It is quite slow even for small volumes. But the plus is that it is very simple and therefore suitable for starting.
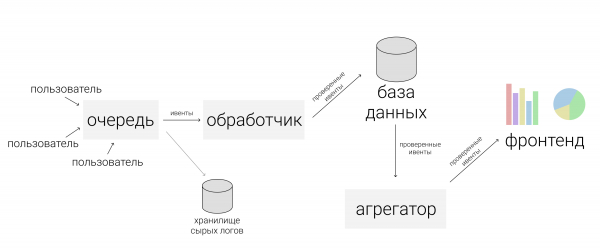
4. Aggregations
Having carefully saved all the events, we want to collect all the important information from the batch that came and update the database. Globally, we want relevant dashboards and metrics. For example, from events to collect a user profile and somehow measure behavior. Events are aggregated, collected, and saved again (already in user tables). At the same time, it is possible to build a system in such a way that a filter is also connected to the coordinating aggregator: to collect users only from a certain type of events.
After that, if someone in the team needs only high-level analytics, you can connect external analytics systems. You can take Mixpanel again. but since it is quite expensive, not all user events are sent there, but only what is needed. To do this, we need to create a coordinator that will transfer some raw events or something that we ourselves have aggregated earlier to external systems, APIs or advertising platforms.
5. Frontend
You need to connect the frontend to the created system. A good example is service. , is a database GUI that helps build panels. How the interaction works:
- The user makes a SQL query.
- In response, he receives a sign.
- Creates a 'new visualization' for it and gets a beautiful graph that you can already save yourself.
Visualizations in the service are auto-updating, you can configure and track your monitoring. Redash is free, in the case of self-hosted, but as SaaS it will cost $50 per month.
Conclusion
After completing all the steps above, you will create your server-side analytics. Please note that this is not as easy as just connecting client analytics, because everything needs to be configured on your own. Therefore, before creating your own system, it is worth comparing the need for a serious analytics system with the resources that you are ready to allocate to it.
If you did all the math and found that the costs are too high, in the next part I will talk about how to make a cheaper version of back-end analytics.
Thanks for reading! I will be glad to questions in the comments.
Source: habr.com
