


Recently, there has been a wealth of material available online regarding traffic analysis at the network perimeter.However, everyone seems to completely overlook local traffic analysis,which is equally important. This article is dedicated to this topic. Using an example from we will revisit the good old Netflow (and its alternatives), explore interesting cases, possible anomalies in the network, and learn about the benefits of a solution where the entire network operates as a single sensor.Most importantly — conducting such a local traffic analysis can be completely free under a trial license (45 days). If you find this topic interesting, feel free to explore further. If you're lazy to read, you can register for the where we will demonstrate everything and provide detailed explanations (you will also learn about the upcoming training for the product).
What is Flowmon Networks?
First and foremost, Flowmon is a European IT vendor. The company is Czech, headquartered in Brno (the issue of sanctions is not even a consideration). The company has been present in its current form in the market since 2007. Before that, it was known under the brand Invea-Tech. Thus, nearly 20 years have been spent on the development of products and solutions.
Flowmon is positioned as a top-tier brand. It develops premium solutions for enterprise clients and is noted in Gartner's quadrants for Network Performance Monitoring and Diagnostics (NPMD). Interestingly, among all companies in the report, Flowmon is the only vendor recognized by Gartner as a provider of solutions for both network monitoring and information protection (Network Behavior Analysis). While it doesn't hold the top spot, it also doesn't cost as much as a Boeing wing.
What tasks can the product solve?
Globally, the following set of tasks can be highlighted that are addressed by the company's products:
- increasing network stability and resource uptime by minimizing downtime and unavailability;
- enhancing overall network performance;
- improving the productivity of the administrative staff by utilizing:
- modern tools for innovative network monitoring based on IP flow information;
- providing detailed analytics on the operation and state of the network – users and applications operating within the network, transmitted data, interacting resources, services, and nodes;
- responding to incidents before they occur, instead of after users and clients experience service loss;
- reducing the time and resources needed for network and IT infrastructure administration;
- simplifying troubleshooting tasks.
- increasing the level of security for the network and the company's information resources by using non-signature technologies to detect abnormal and malicious network activity, as well as zero-day attacks;
- ensuring the required level of SLA for network applications and databases.
The product portfolio of Flowmon Networks
Now let's take a closer look at the Flowmon Networks product portfolio and find out exactly what the company does. As many have guessed from the name, the main specialization is in solutions for flow monitoring, along with a number of additional modules that expand the basic functionality.
In fact, Flowmon can be described as a one-product company, or rather – as having one solution. Let's figure out whether this is good or bad.
The core of the system is the collector, responsible for gathering data across various flow protocols, such as NetFlow v5/v9, jFlow, sFlow, NetStream, IPFIX… It is quite logical that for a company not affiliated with any network equipment manufacturers, it is important to offer the market a universal product that is not tied to any specific standard or protocol.
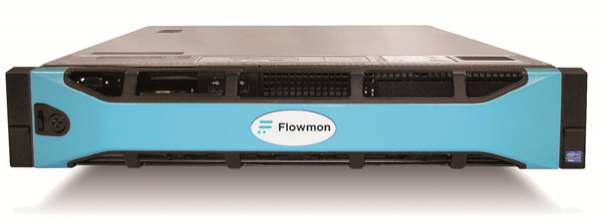
Flowmon Collector
The collector is available as both a hardware server and a virtual machine (VMware, Hyper-V, KVM). By the way, the hardware platform is implemented on customized DELL servers, which automatically alleviates many warranty and RMA concerns. The only proprietary hardware components are the FPGA traffic capture boards developed by a subsidiary of Flowmon, allowing monitoring at speeds of up to 100 Gbps.
But what to do if there is no way to generate quality flow on the existing network equipment? Or if the load on the equipment is too high? No problem:
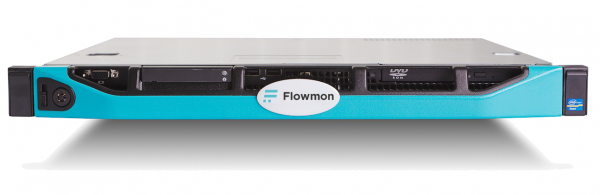
Flowmon Prob
In this case, Flowmon Networks offers its own probes (Flowmon Probe) that connect to the network via the switch's SPAN port or by using passive TAP splitters.
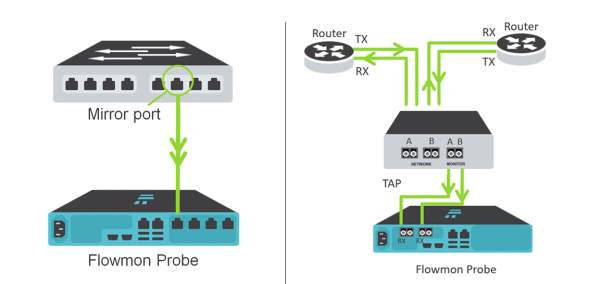
SPAN (mirror port) and TAP deployment options
In this scenario, the 'raw' traffic arriving at the Flowmon Probe is converted into an extended IPFIX format, containing more 240 metrics with information. While the standard NetFlow protocol generated by network devices contains no more than 80 metrics. This provides visibility to protocols not only on the 3rd and 4th levels but also on the 7th level of the ISO OSI model. As a result, network administrators can monitor the functioning of such applications and protocols as email, HTTP, DNS, SMB...
Conceptually, the logical architecture of the system looks as follows:
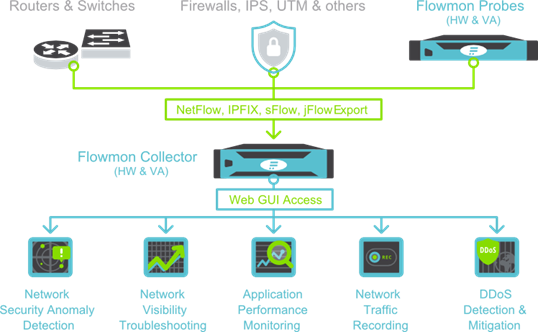
The central part of the entire Flowmon Networks 'ecosystem' is the Collector, which receives traffic from existing network equipment or its own probes (Probe). However, providing functionality exclusively for monitoring network traffic for an Enterprise solution would be too simplistic. Open Source solutions can also do this, albeit not with the same performance. The value of Flowmon lies in the additional modules that extend the basic functionality:
- module Anomaly Detection Security – detection of anomalous network activity, including 'zero-day' attacks, based on heuristic traffic analysis and a typical network profile;
- module Application Performance Monitoring – performance monitoring of network applications without installing 'agents' and impacting target systems;
- module Traffic Recorder – recording fragments of network traffic according to a predefined set of rules or triggered by the ADS module, for further troubleshooting and/or investigation of security incidents;
- module DDoS Protection – perimeter network protection against volumetric denial of service attacks DoS/DDoS, including application attacks (OSI L3/L4/L7).
In this article, we will explore how everything works live using the example of 2 modules – Network Performance Monitoring and Diagnostics and Anomaly Detection Security.
Input data:
- Lenovo RS 140 server with VMware 6.0 hypervisor;
- the Flowmon Collector virtual machine image, which can be ;
- a pair of switches supporting flow protocols.
Step 1. Installation of Flowmon Collector
Deploying a virtual machine on VMware occurs in a completely standard way from an OVF template. As a result, we get a virtual machine running CentOS with the necessary software ready for use. The resource requirements are quite reasonable:
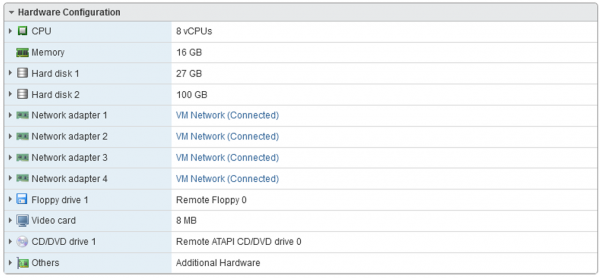
We just need to perform the basic initialization with the command sysconfig:
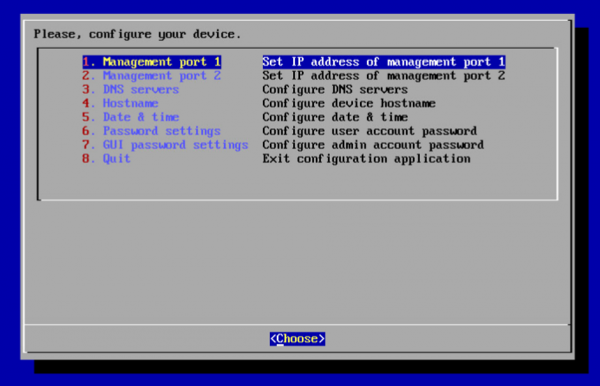
We configure the IP on the management port, DNS, time, Hostname, and we can connect to the WEB interface.
Step 2. License Installation
A trial license for one and a half months is generated and downloaded along with the virtual machine image. It is uploaded via Configuration Center -> License. As a result, we see:
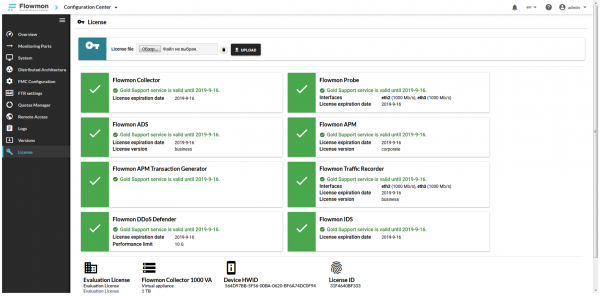
All set. We can start working.
Step 3. Configuring the Receiver on the Collector
At this stage, you need to determine how data will flow into the system from the sources. As mentioned earlier, this could be one of the flow protocols or a SPAN port on the switch.
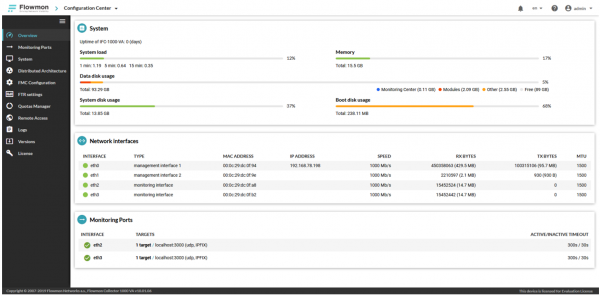
In our example, we will use data reception via the protocols NetFlow v9 and IPFIX. In this case, we specify the IP address of the Management interface as the target – 192.168.78.198. Interfaces eth2 and eth3 (of the Monitoring interface type) are used to receive a copy of the 'raw' traffic from the switch's SPAN port. We will skip these; they are not relevant to our case.
Next, we check the collector port where the traffic should arrive.
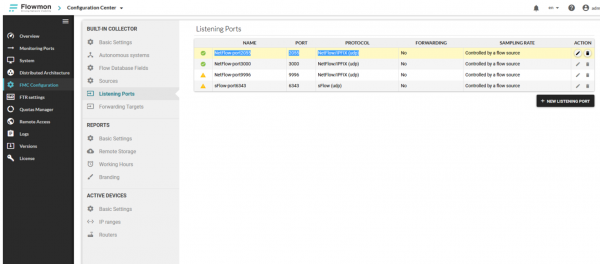
In our case, the collector is expecting traffic on port UDP/2055.
Step 4. Configuring Network Equipment for Flow Export
Configuring NetFlow on Cisco Systems equipment can be considered quite standard for any network administrator. For our example, we will choose something a bit more unusual, like the MikroTik RB2011UiAS-2HnD router. Surprisingly, this budget solution for small and home offices also supports NetFlow v5/v9 and IPFIX protocols. In the settings, we specify the target (collector address 192.168.78.198 and port 2055):
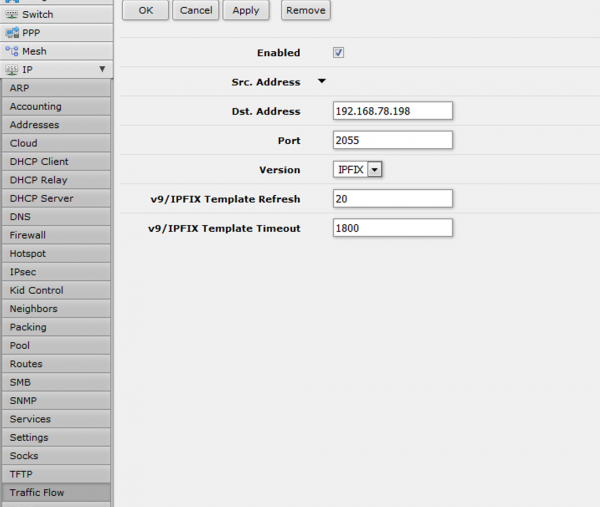
And add all available metrics for export:
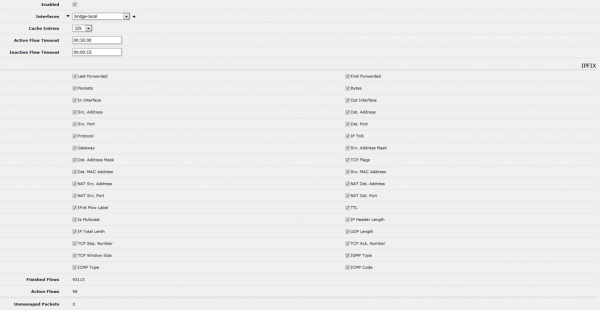
At this point, we can say that the basic configuration is complete. Let's check if traffic is being received in the system.
Step 5. Checking and Operating the Network Performance Monitoring and Diagnostics Module
You can check for traffic from the source in the section Flowmon Monitoring Center -> Sources:
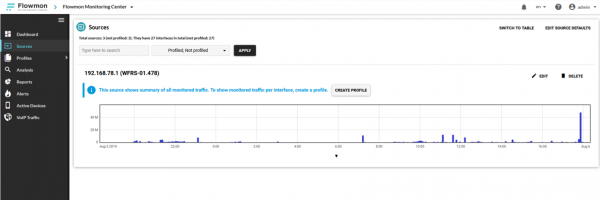
We see that data is coming into the system. After some time, when the collector accumulates traffic, the widgets will start displaying information:
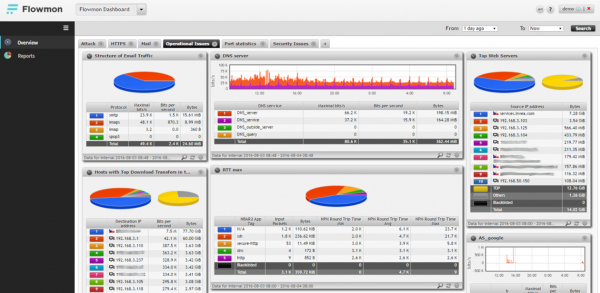
The system is built on the drill down principle. This means that the user, upon selecting an interesting fragment on the schematic or chart, 'dives down' to the level of data depth that they need:
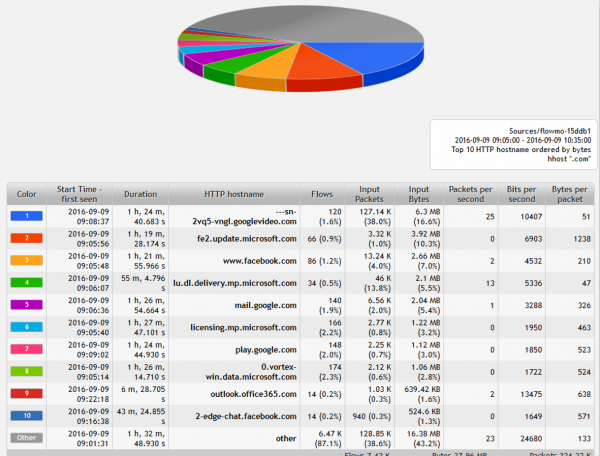
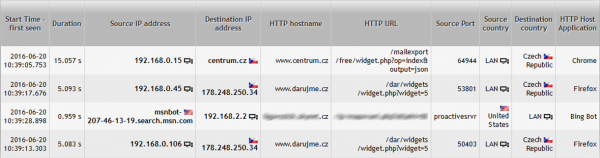
Right down to information about each network connection and link:
Step 6. Anomaly Detection Security Module
This module can be considered one of the most interesting, thanks to the use of signature-less methods for detecting anomalies in network traffic and malicious network activity. However, it is not an equivalent to IDS/IPS systems. Working with the module begins with its 'training'. For this, a special wizard specifies all the key components and services of the network, including:
- gateway addresses, DNS, DHCP, and NTP servers,
- addressing in user and server segments.
After this, the system enters the training mode, which lasts on average from 2 weeks to 1 month. During this time, the system forms a baseline of traffic characteristic to our network. Simply put, the system studies:
- what behavior is typical for network nodes?
- what data volumes are usually transferred and considered normal for the network?
- what working times are standard for users?
- what applications are running on the network?
- and much more..
As a result, we obtain a tool that detects any anomalies in our network and deviations from typical behavior. Here are a couple of examples that the system can identify:
- the spread of new malware in the network, undetectable by antivirus signatures;
- the creation of DNS, ICMP, or other tunnels transmitting data bypassing the firewall;
- the appearance of a new computer in the network posing as a DHCP and/or DNS server.
Let's see how this looks in action. Once your system has been trained and established a traffic baseline for the network, it begins to detect incidents:
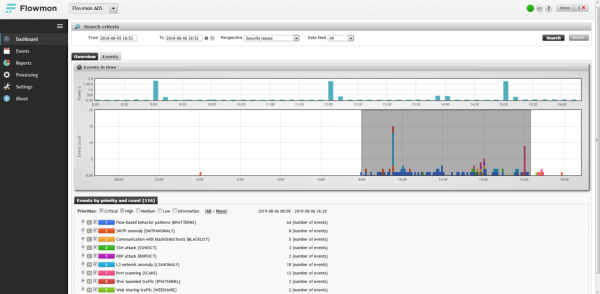
The module's main page features a timeline displaying detected incidents. In our example, we see a clear spike, roughly between 9 and 16 hours. We highlight it and take a closer look.
Anomalous behavior from an attacker in the network is clearly evident. It all starts when a host with the address 192.168.3.225 begins horizontal scanning of the network on port 3389 (Microsoft RDP service) and identifies 14 potential 'victims':
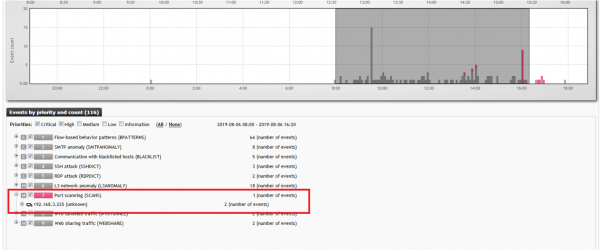
and
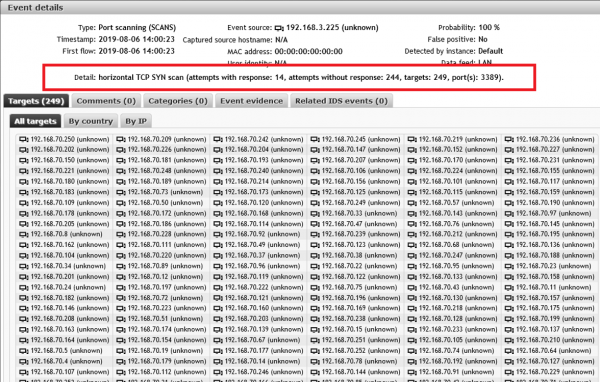
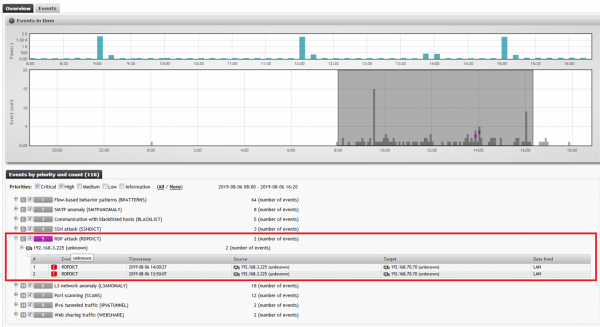
The next recorded incident involves host 192.168.3.225 launching a brute-force attack to guess passwords on the RDP service (port 3389) on previously identified addresses:
As a result of the attack, an SMTP anomaly was recorded on one of the compromised hosts. In other words, spam distribution began:
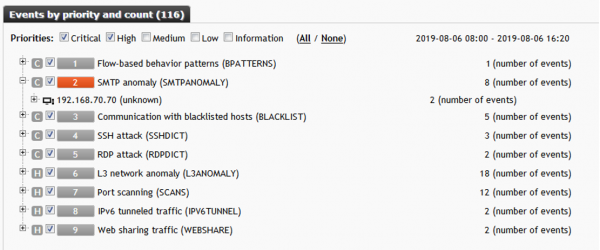
This example serves as a clear demonstration of the capabilities of the Anomaly Detection Security system and module, in particular. You can judge the effectiveness for yourself. We conclude this functional overview of the solution here.
Conclusion
In summary, what conclusions about Flowmon can we draw from the remaining evidence:
- Flowmon is a premium-level solution for corporate clients;
- thanks to its versatility and compatibility, data collection is available from any source: network equipment (Cisco, Juniper, HPE, Huawei…) or our own probes (Flowmon Probe);
- the solution's scalability allows for extending system functionality by adding new modules, as well as improving performance through a flexible licensing approach;
- through the use of signature-less analysis technologies, the system can detect even unknown zero-day attacks that antivirus and IDS/IPS systems are unaware of;
- thanks to complete 'transparency' in terms of installation and the system's presence on the network, the solution does not impact the operation of other nodes and components of your IT infrastructure;
- Flowmon is the only solution on the market that supports traffic monitoring at speeds of up to 100 Gbps;
- Flowmon is suitable for networks of any scale;
- it offers the best price/functionality ratio among similar solutions.
In this review, we covered less than 10% of the overall functionality of the solution. In the next article, we will discuss the remaining modules of Flowmon Networks. Using the Application Performance Monitoring module as an example, we will show how business application administrators can ensure availability at the specified SLA level and diagnose problems as quickly as possible.
We would also like to invite you to our webinar (09/10/2019) dedicated to the vendor Flowmon Networks solutions. For pre-registration, please .
That's all for now, thank you for your interest!
Only registered users can participate in the survey. , please.
Are you using NetFlow for network monitoring?
Yes
No, but I plan to
No
9 users voted. 3 users abstained.
Source: habr.com
