

Today, there is a need to monitor changes to specific files on the server, and there are many different ways to do this, for example , but since I recently started using , I decided to monitor files using Elasticsearch, one of its .
I won't describe the installation of the Elastic stack and Auditbeat, everything is available in the manuals, the only thing is to edit the file after installation auditbeat.yml, in the module file_integrity add the path to the file to be monitored.
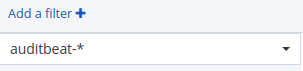
After configuration and startup, an index will appear in Kibana auditbeat-*
Next, we create the monitoring configuration, specifying the name of the monitoring, the check interval, as well as the type of monitoring and index file:
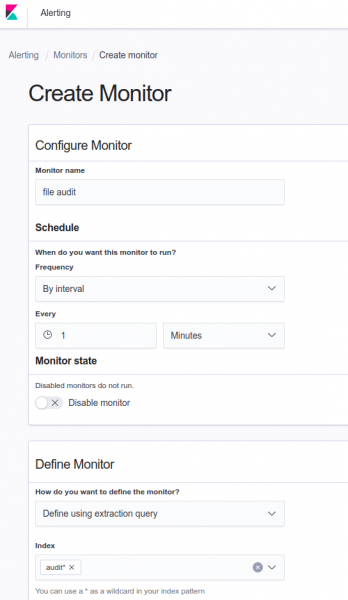
downward API support (simultaneously with this in Define extraction query we write the following:
Define extraction query
{
    "query": {
        "bool": {
            "must": [
                {
                    "match_phrase": {
                        "file.path": {
                            "query": ""

                        }
                    }
                }
            ],
            "filter": [
                {
                    "term": {
                        "event.action": {
                            "value": "attributes_modified"    #attributes changes, possibly created or deleted

                        }
                    }
                },
                {
                    "range": {
                        "@timestamp": {
                            "from": "now-1m" #period during which changes are tracked

                        }
                    }
                }
            ],
            "adjust_pure_negative": true,
            "boost": 1
        }
    }
}
After that, click the Run button and check the query; you should see something like this:

Try to modify the target file and run the query again:

as you can see, hits changed to 2, click update and create a trigger for value change:
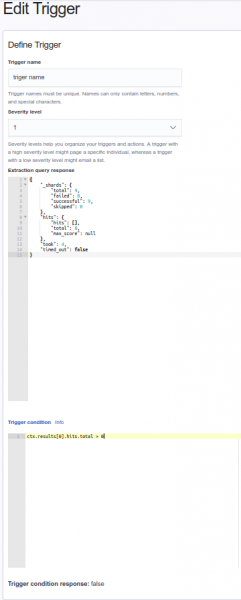
Leave everything as shown in the picture.
Next, you can set up notifications in Slack or another messenger.
Source: habr.com
