

It's no secret that the control of blocked content according to the list of prohibited information in Russia is monitored by the automated system "Revizor". The workings of this system are well explained in this , with an image from there:
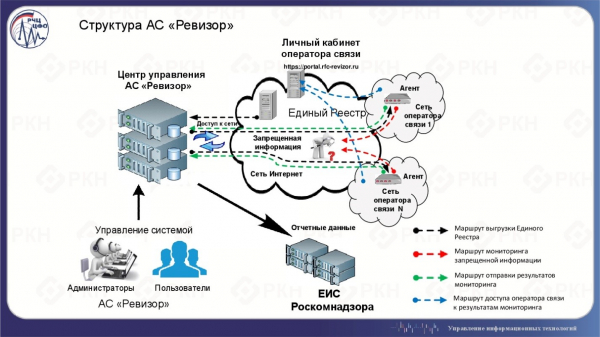
Directly at the provider, there is installed :
The "Revizor Agent" module is a structural element of the automated system "Revizor" (AS "Revizor"). This system is designed to monitor communication operators' compliance with the requirements for restricting access as stipulated by articles 15.1-15.4 of the Federal Law No. 149-FZ of July 27, 2006 "On Information, Information Technologies and Information Protection."
The primary goal of creating the AS "Revizor" is to ensure monitoring of compliance by communication operators with the requirements specified in articles 15.1-15.4 of the Federal Law No. 149-FZ of July 27, 2006 "On Information, Information Technologies and Information Protection" regarding the identification of facts of access to prohibited information and obtaining corroborating materials (data) about violations of the restrictions on access to prohibited information.
Considering that if not all, then many providers have installed this device, a large network of probes-beacons akin to and even more should have formed, but with restricted access. However, a beacon is indeed a beacon that sends signals in all directions, so what if we catch them and see what we have caught and how much?
Before counting, let's examine why this might even be possible.
A Bit of Theory
Agents check the accessibility of resources, including through HTTP(S) requests, like this one for example:
TCP, 14678  >  80, "[SYN] Seq=0"
TCP, 80  >  14678, "[SYN, ACK] Seq=0 Ack=1"
TCP, 14678  >  80, "[ACK] Seq=1 Ack=1"

HTTP, "GET /somepage HTTP/1.1"
TCP, 80  >  14678, "[ACK] Seq=1 Ack=71"
HTTP, "HTTP/1.1 302 Found"

TCP, 14678  >  80, "[FIN, ACK] Seq=71 Ack=479"
TCP, 80  >  14678, "[FIN, ACK] Seq=479 Ack=72"
TCP, 14678  >  80, "[ACK] Seq=72 Ack=480"
The request, in addition to the payload, consists of a connection establishment phase: the exchange of SYN and SYN-ACK, and the connection termination phase: FIN-ACK.
The registry of prohibited information contains several types of blocking. Clearly, if a resource is blocked by IP address or domain name, then we won't see any requests. These are the most destructive types of blocking, leading to the unavailability of all resources on a single IP address or all information on a domain. There is also a type of blocking 'by URL'. In this case, the filtering system must analyze the HTTP request header to precisely determine what to block. Before that, as mentioned above, the connection establishment phase should occur, which can be attempted to trace since the filter is likely to let it pass.
To do this, you need to choose a suitable free domain with a blocking type 'by URL' and HTTP to ease the filtering system's tasks, preferably an abandoned one, to minimize the influx of external traffic other than from Agents. This task turned out to be quite simple; there are many free domains in the registry of prohibited information to choose from. Therefore, the domain was acquired and linked to the IP addresses on the VPS with running tcpdump and the counting began.
Revision of 'Inspectors'
I expected to see periodic spikes in requests, which, in my opinion, would indicate managed activity. I can't say I didn't see this at all, but there was definitely no clear picture:
That's not surprising; even a completely unused domain on an IP that has never been used will receive a mass of unsolicited information, such is the modern Internet. Fortunately, I only needed requests for a specific URL, so all scanners and password brute-forcers were quickly identified. It was also quite simple to understand where the spam came from due to the mass of similar requests. Next, I compiled the frequencies of IP addresses and manually sifted through the entire top, separating those who slipped through previous stages. Additionally, I trimmed all sources that sent just one packet, and there weren't many of those left. And this is what I got:
A brief lyrical digression. A little more than a day later, my hosting provider sent a letter with rather vague content, stating that there is a resource on your servers from the prohibited list of the RKN, and therefore it is being blocked. At first, I thought my account was blocked, but that wasn't the case. Then I thought they were simply warning me about something I was already aware of. But it turned out that the host had activated its filter in front of my domain, and as a result, I ended up under double filtering: from the providers' side and from the host's side. The filter allowed only the ends of requests through: FIN-ACK and RST cutting off all HTTP on the prohibited URL. As seen from the graph above, after the first day, I started receiving less data, but I still managed to get enough for the task of counting the sources of requests.
Getting to the point. In my opinion, it is clearly visible that there are two spikes every day, the first smaller one occurs just after midnight Moscow time, and the second is closer to 6 AM, lasting until noon. The peak does not occur at exactly the same time each day. Initially, I wanted to highlight the IP addresses that appeared only during these periods and each one during all periods, assuming that checks by the Agents are carried out periodically. However, upon closer inspection, I quickly discovered periods that fell into other intervals with different frequencies, down to one request every hour. Then I considered time zones and thought that might be a factor, and afterward, I wondered if the system might not be globally synchronized. Additionally, NAT will surely play a role, and the same Agent may make requests from different public IPs.
Since my original goal was not precision, I counted all the addresses that appeared over the week and found — 2791. The average number of TCP sessions established from one address is 4, with a median of 2. The top sessions per address are: 464, 231, 149, 83, 77. The maximum from the 95% sample is 8 sessions per address. The median is not very high; I remind you that the graph shows a clear daily periodicity, so something around 4 to 8 sessions over 7 days could be expected. If we exclude all sessions that occurred only once, we would get a median exactly equal to 5. However, I could not exclude them based on a clear criterion. On the contrary, a spot check showed that they are related to requests for the prohibited resource.
Addresses are important, but in the Internet, autonomous systems—AS—are what matter. 1510, averaging 2 addresses per AS with a median of 1. Top addresses on AS: 288, 77, 66, 39, 27. The maximum from 95% of the sample is 4 addresses per AS. The expected median is one Agent per provider. The top is also expected—comprised of major players. In a large network, Agents should likely be present in every region where the operator exists, and we shouldn't forget about NAT. Looking by country, the maxima are: 1409—RU, 42—UA, 23—CZ, 36 from other regions, not RIPE NCC. Requests not from Russia draw attention. This may be due to geolocation errors or registrars' mistakes when filling in data. Or the fact that a Russian company may have non-Russian roots or an overseas representative, as dealing with a foreign organization like RIPE NCC makes this simpler. Some parts are undoubtedly excess, but it's hard to distinguish them accurately since the resource is under blocking, and for the second day, it has been under double blocking, with most sessions being merely an exchange of a few control packets. Let's agree that this is a small part.
These figures can already be compared with the number of providers in Russia. the licenses for 'Data transmission services, excluding voice'—total 6387, but this is a highly inflated upper estimate; not all of these licenses pertain specifically to Internet providers who need to set up Agents. In the RIPE NCC zone, a similar number of AS registered in Russia is 6230, of which not all are providers. and found 3940 companies in 2017, and this is rather an upper estimate. In any case, we have a number of visible AS that is two and a half times smaller. However, it's important to understand that AS does not strictly equal a provider. Some providers do not have their own AS; some have more than one. If we assume that Agents do exist with all, then someone is filtering more strongly than others, making their requests indistinguishable from garbage if they even reach the destination. But for rough estimates, this is quite acceptable, even if something was lost due to my oversight.
About DPI
Although my hosting provider activated their filter starting from the second day, the data from the first day suggests that the blocks are working effectively. Only 4 sources managed to get through and have fully completed HTTP and TCP sessions (as shown in the example above). Another 460 may attempt to send packets, GET, but the session immediately drops due to RST. Note that TTL:
TTL 50, TCP, 14678 > 80, "[SYN] Seq=0"
TTL 64, TCP, 80 > 14678, "[SYN, ACK] Seq=0 Ack=1"
TTL 50, TCP, 14678 > 80, "[ACK] Seq=1 Ack=1"

HTTP, "GET /filteredpage HTTP/1.1"
TTL 64, TCP, 80 > 14678, "[ACK] Seq=1 Ack=294"

#This was sent by the filter
TTL 53, TCP, 14678 > 80, "[RST] Seq=3458729893"
TTL 53, TCP, 14678 > 80, "[RST] Seq=3458729893"

HTTP, "HTTP/1.1 302 Found"

#This is an attempt by the source node to detect loss
TTL 50, TCP ACKed unseen segment, 14678 > 80, "[ACK] Seq=294 Ack=145"
TTL 50, TCP, 14678 > 80, "[FIN, ACK] Seq=294 Ack=145"
TTL 64, TCP, 80 > 14678, "[FIN, ACK] Seq=171 Ack=295"
TTL 50, TCP Dup ACK 14678 > 80 "[ACK] Seq=295 Ack=145"

#The source node realizes that the session has been severed
TTL 50, TCP, 14678 > 80, "[RST] Seq=294"
TTL 50, TCP, 14678 > 80, "[RST] Seq=295"
Variations of this can differ: fewer RST or more retransmissions—this also depends on what the filter sends to the source node. In any case, this is the most reliable pattern that clearly shows that a forbidden resource was requested. Plus, there is always a response that appears in the session with TTL greater than in the previous and following packets.
From the others, there is not even a response seen. GET:
TTL 50, TCP, 14678 > 80, "[SYN] Seq=0"
TTL 64, TCP, 80 > 14678, "[SYN, ACK] Seq=0 Ack=1"

#This was sent by the filter
TTL 53, TCP, 14678 > 80, "[RST] Seq=1"
Or like this:
TTL 50, TCP, 14678 > 80, "[SYN] Seq=0"
TTL 64, TCP, 80 > 14678, "[SYN, ACK] Seq=0 Ack=1"
TTL 50, TCP, 14678 > 80, "[ACK] Seq=1 Ack=1"

#This was sent by the filter
TTL 53, TCP, 14678 > 80, "[RST, PSH] Seq=1"

TTL 50, TCP ACKed unseen segment, 14678 > 80, "[FIN, ACK] Seq=89 Ack=172"
TTL 50, TCP ACKed unseen segment, 14678 > 80, "[FIN, ACK] Seq=89 Ack=172"

#Again by the filter, many times
TTL 53, TCP, 14678 > 80, "[RST, PSH] Seq=1"
...
A clear difference is always visible in TTL if anything is sent from the filter. But often, nothing may come at all:
TCP, 14678 > 80, "[SYN] Seq=0"
TCP, 80 > 14678, "[SYN, ACK] Seq=0 Ack=1"
TCP Retransmission, 80 > 14678, "[SYN, ACK] Seq=0 Ack=1"
...
Or like this:
TCP, 14678 > 80, "[SYN] Seq=0"
TCP, 80 > 14678, "[SYN, ACK] Seq=0 Ack=1"
TCP, 14678 > 80, "[ACK] Seq=1 Ack=1"

#Several seconds passed without traffic

TCP, 80 > 14678, "[FIN, ACK] Seq=1 Ack=1"
TCP Retransmission, 80 > 14678, "[FIN, ACK] Seq=1 Ack=1"
...
And all of this repeats and repeats and repeats, as seen in the graph, definitely not just once, every day.
About IPv6
The good news is that it exists. I can say for sure that periodic requests are coming from 5 different IPv6 addresses to the blocked resource, exactly the behavior of the Agents that I expected. Moreover, one of the IPv6 addresses is not subject to filtering, and I see a full session. From the other two, I saw only one incomplete session each, one of which was interrupted due to RST filtering, and the other due to time. In total, there are 7.
Since there are few addresses, I studied all of them in detail and found that there are actually only 3 providers; they deserve a standing ovation! Another address is cloud hosting in Russia (not filtered), and one more is a research center in Germany (there's a filter, where?). The question of why they are checking the availability of blocked resources on a schedule is a good one. The remaining two made one request each and are located outside of Russia, and one of them is filtered (still on transit?).
Blockages and Agents are a significant hindrance for IPv6, whose implementation is already progressing slowly. It’s unfortunate. Those who have fully addressed this issue can be proud of themselves.
In conclusion
I wasn't chasing 100% accuracy, and I apologize for that; I hope someone might want to repeat this work with greater precision. For me, it was important to understand whether such an approach would work in principle. The answer is that it will. The numbers obtained are preliminary, but I think they are quite reliable.
What else could have been done and what I was too lazy to do is count the requests to DNS. They are not filtered, but they don't provide great accuracy as they only work for the domain, not for the entire URL. The periodicity should be visible. If combined with what is directly visible in the requests, this would help filter out the excess and obtain more information. It might even be possible to identify the DNS developers used by the providers and much more.
I absolutely did not expect that my VPS host would also implement its own filter. Perhaps this is common practice. After all, the Roscomnadzor sends a request to remove the resource directly to the host. But I was not surprised by this, and it even worked to my advantage in some way. The filter operated very effectively, cutting all legitimate HTTP requests to the blocked URL, while the illegitimate ones, which had already passed through the providers' filter, got through, albeit only in the form of endings: FIN-ACK and RST — minus a minus equals almost a plus. By the way, the IPv6 host was not filtered. Of course, this affected the quality of the gathered data, but it still allowed us to see the periodicity. It turned out to be an important factor when choosing a platform for resource placement; don’t forget to inquire about the organization of work with the list of banned sites and requests from the Roskomnadzor.
At the beginning, I compared the AS "Revisor" with . This comparison is quite justified, and a large network of Agents can be beneficial. For example, determining the accessibility quality of a resource from various providers across different parts of the country. You can calculate delays, build graphs, analyze everything, and observe changes that occur both locally and globally. This is not the most straightforward path, but astronomers use 'standard candles'; why not use Agents? By knowing (or finding) their standard behavior, one can determine the changes happening around them and how this affects the quality of services provided. Moreover, there’s no need to independently place probes across the network; they’ve already been installed by Roskomnadzor.
Another point I want to touch upon is that every tool can be a weapon. The AS "Revisor" is a closed network, but Agents report everyone in detail, sending requests to all resources from the banned list. Obtaining such a resource presents absolutely no problems. Thus, providers, through Agents, often unwittingly reveal much more about their network than would be preferable: types of DPI and DNS, Agent location (central nodes and service network?), network markers of delays and losses — and this is just the most obvious. Just as someone can monitor the actions of Agents to improve the accessibility of their own resources, someone else can do this for different purposes, and there are no obstacles to this. The tool has become a double-edged sword, versatile, and anyone can verify this.
Source: habr.com
