

Structuring Unstructured Data with GROK
If you are using the Elastic (ELK) stack and are interested in mapping user logs from Logstash to Elasticsearch, then this post is for you.

The ELK stack is an acronym for three open-source projects: Elasticsearch, Logstash, and Kibana. Together, they form a log management platform.
- Elasticsearch is a search and analytics system.
- Logstash is a server-side data processing pipeline that ingests data from multiple sources simultaneously, transforms it, and then sends it to a 'stash', such as Elasticsearch.
- Kibana allows users to visualize data with charts and graphs in Elasticsearch.
Beats was introduced later and is a lightweight data shipper. The introduction of Beats transformed the ELK Stack into the Elastic Stack, but that’s not the main focus.
This article is dedicated to Grok, which is a feature in Logstash that can transform your logs before they're sent to the stash. For our purposes, I will only be discussing data processing from Logstash to Elasticsearch.

Grok is a filter within Logstash that is used to parse unstructured data into something structured and queryable. It sits above regular expressions (regex) and uses text patterns to match strings in log files.
As we will see in the following sections, using Grok is essential for effective log management.
Without Grok, your log data is Unstructured
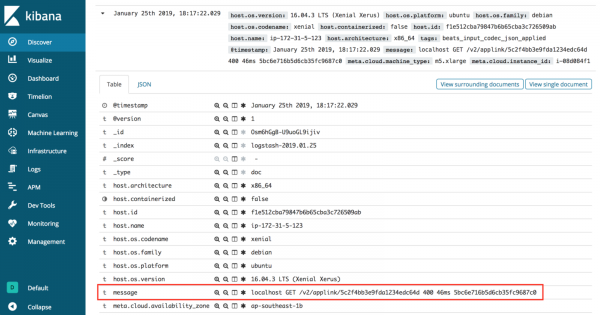
Without Grok, when logs are sent from Logstash to Elasticsearch and visualized in Kibana, they only appear in the message field.
Querying meaningful information in this state is difficult, as all log data is stored under one key. It would be better if log messages were better organized.
Unstructured Data from Logs
localhost GET /v2/applink/5c2f4bb3e9fda1234edc64d 400 46ms 5bc6e716b5d6cb35fc9687c0If you take a close look at the raw data, you will see that it actually consists of different parts, each separated by a space.
For more experienced developers, you can likely guess what each part means and recognize that this log message is from an API call. Each item is defined below.
The Structured View of Our Data
- localhost == environment
- GET == method
- /v2/applink/5c2f4bb3e9fda1234edc64d == url
- 400 == response_status
- 46ms == response_time
- 5bc6e716b5d6cb35fc9687c0 == user_id
As we see in the structured data, there is an order for unstructured logs. The next step is the programmatic processing of the raw data. This is where Grok shines.
Grok Templates
Logstash comes with over 100 built-in templates for structuring unstructured data. You should definitely take advantage of this when possible for common system logs like apache, linux, haproxy, aws, and so on.
But what happens when you have custom logs, like in the example above? You need to build your own Grok template.
Custom Grok Templates
You need to experiment to build your own Grok template. I used
Grok Debugger and .
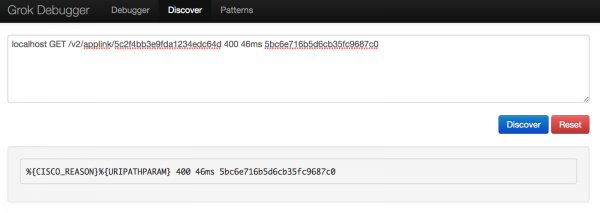
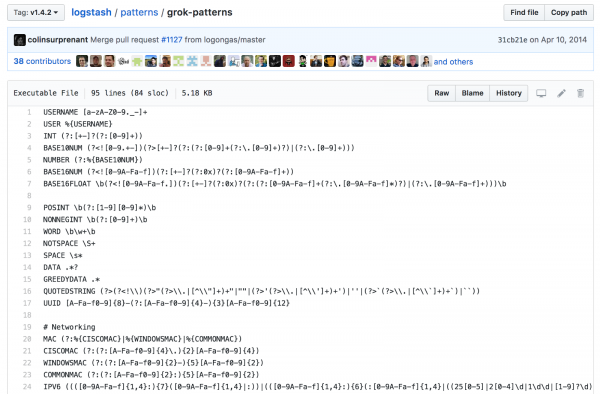
%{SYNTAX:SEMANTIC} The first thing I tried to do was go to the
Discover tab in the Grok debugger. I thought it would be great if this tool could automatically generate a Grok template, but it wasn't very useful as it only found two matches. Using this discovery, I began to create my own template in the Grok debugger using the syntax found on the Elastic Github page.
Playing around with different syntaxes, I finally managed to structure the log data the way I wanted.
Link to the Grok Debugger
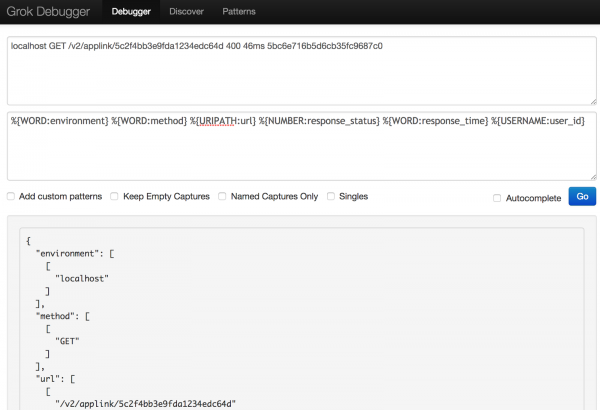
Original text:
Pattern:
localhost GET /v2/applink/5c2f4bb3e9fda1234edc64d 400 46ms 5bc6e716b5d6cb35fc9687c0%{WORD:environment} %{WORD:method} %{URIPATH:url} %{NUMBER:response_status} %{WORD:response_time} %{USERNAME:user_id}
What I ended up with{ "environment": [ [ "localhost" ] ], "method": [ [ "GET" ] ], "url": [ [ "/v2/applink/5c2f4bb3e9fda1234edc64d" ] ], "response_status": [ [ "400" ] ], "BASE10NUM": [ [ "400" ] ], "response_time": [ [ "46ms" ] ], "user_id": [ [ "5bc6e716b5d6cb35fc9687c0" ] ] }
With the Grok template and matched data in hand, the last step is to add it to Logstash.Updating the Logstash.conf configuration file
On the server where you installed the ELK stack, go to the Logstash configuration:
sudo vi /etc/logstash/conf.d/logstash.conf
Paste the changes.input { file { path => "/your_logs/*.log" } } filter{ grok { match => { "message" => "%{WORD:environment} %{WORD:method} %{URIPATH:url} %{NUMBER:response_status} %{WORD:response_time} %{USERNAME:user_id}"} } } output { elasticsearch { hosts => [ "localhost:9200" ] } }
input {
  file {
    path => "/your_logs/*.log"
  }
}
filter{
  grok {
    match => { "message" => "%{WORD:environment} %{WORD:method} %{URIPATH:url} %{NUMBER:response_status} %{WORD:response_time} %{USERNAME:user_id}"}
  }
}
output {
  elasticsearch {
    hosts => [ "localhost:9200" ]
  }
}
After saving changes, restart Logstash and check its status to ensure it is still running.
sudo service logstash restart
sudo service logstash status
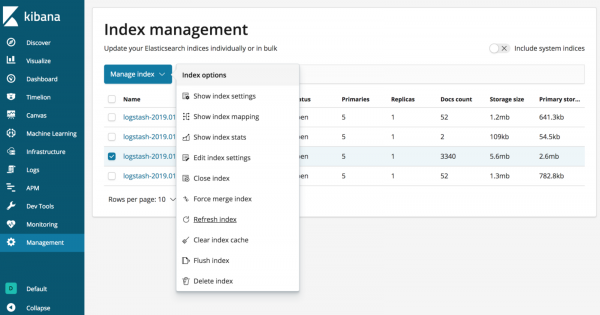
Finally, to ensure the changes take effect, be sure to refresh the Elasticsearch index for Logstash in Kibana!
With Grok, your log data is structured!
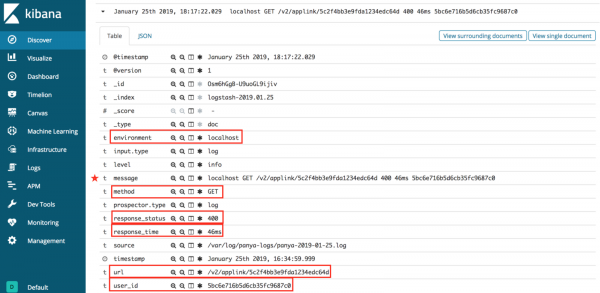
As we see in the image above, Grok can automatically map log data to Elasticsearch. This makes log management easier and allows for quick information queries. Instead of sifting through log files for debugging, you can simply filter what you're looking for, such as the environment or URL.
Give Grok expressions a try! If you have another way of doing this or face any issues with the examples above, just leave a comment below to let me know.
Thank you for reading — and please follow me here on Medium for more interesting articles on software engineering!
Resources
P.S
Telegram channel about
Source: habr.com
