

Hello, colleagues! Having defined the minimum requirements for deploying StealthWatch in , we can begin product deployment.
1. Methods of deploying StealthWatch
There are several ways to 'touch' StealthWatch:
- – cloud-based lab service;
- Cloud Based: – here, Netflow from your device will flow into the cloud and will be analyzed by StealthWatch software there;
- On-premise POV () – the approach I took, you will receive 4 OVF files of virtual machines with built-in licenses for 90 days, which can be deployed on a dedicated server in your corporate network.
Despite the multitude of downloaded virtual machines, only 2 are sufficient for a minimal working configuration: StealthWatch Management Console and FlowCollector. However, if there is no network device that can export Netflow to FlowCollector, then you also need to deploy FlowSensor, as the latter allows collecting Netflow using SPAN/RSPAN technologies.
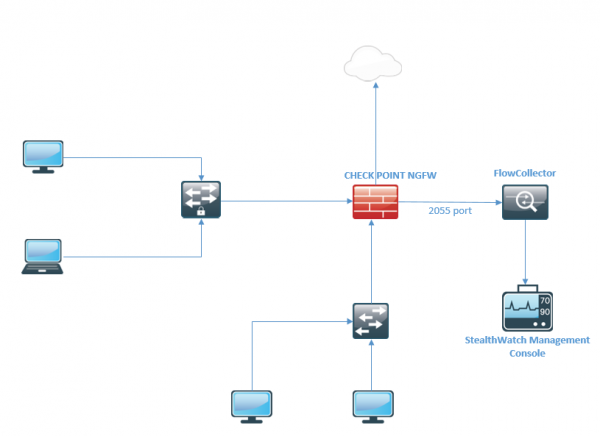
As a lab setup, as I mentioned earlier, your actual network can serve since StealthWatch only requires a copy, or more precisely, a distilled copy of the traffic. In the illustration below, my network is presented, where I will configure a Netflow Exporter on the security gateway, and as a result, I will be sending Netflow to the collector.
To access the future VMs, on your firewall, if you have one, you should allow the following ports:
TCP 22 l TCP 25 l TCP 389 l TCP 443 l TCP 2393 l TCP 5222 l UDP 53 l UDP 123 l UDP 161 l UDP 162 l UDP 389 l UDP 514 l UDP 2055 l UDP 6343
Some of these are well-known services, while some are reserved for Cisco services.
In my case, I simply deployed StealthWatch in the same network as Check Point, and no rules had to be configured.
2. Installing FlowCollector using VMware vSphere
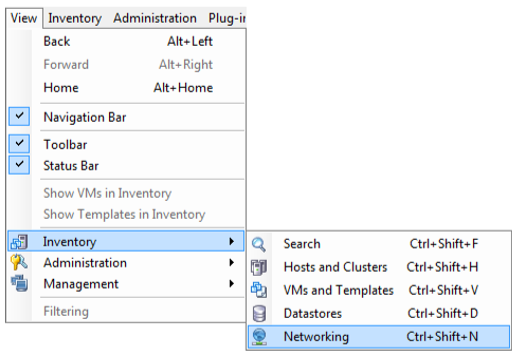
2.1. Click Browse and select the OVF file. After confirming resource availability, go to the menu View, Inventory → Networking (Ctrl+Shift+N).
2.2. In the Networking tab, select New Distributed port group in the virtual switch settings.
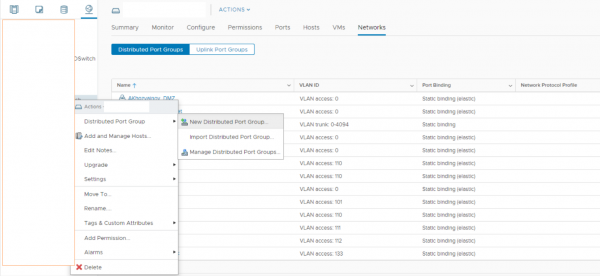
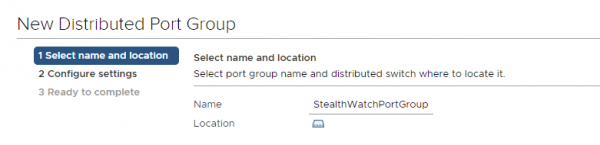
2.3. Assign a name, let's call it StealthWatchPortGroup, the other settings can be made as shown in the screenshot, and click Next.
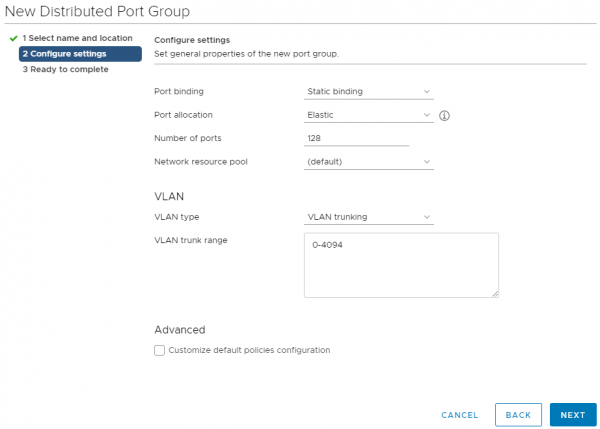
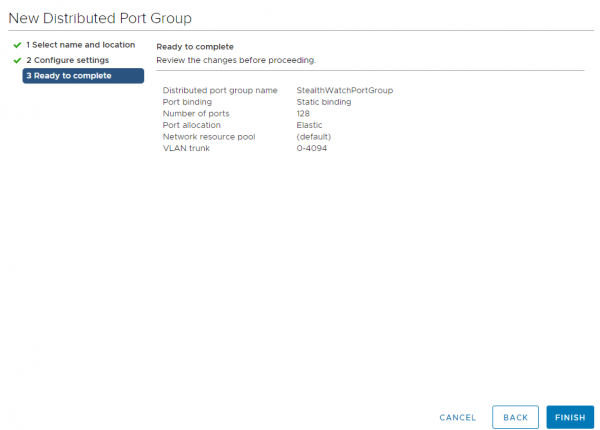
2.4. Complete the creation of the Port Group by clicking Finish.
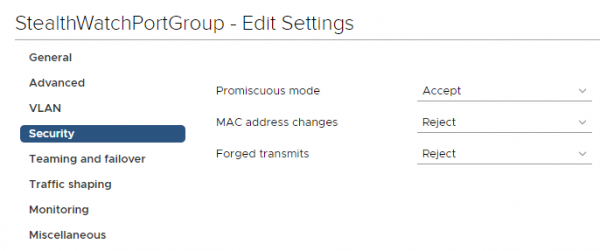
2.5. For the created Port Group, edit the settings by right-clicking on the port group and selecting Edit Settings. In the Security tab, be sure to enable 'promiscuous mode', Promiscuous Mode → Accept → OK.
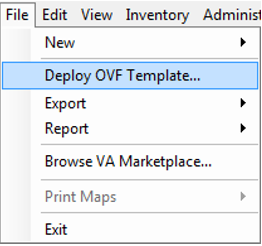
2.6. As an example, we will import the OVF FlowCollector, the download link for which was sent by a Cisco engineer after the GVE request. Right-click on the host where you plan to deploy the VM and choose Deploy OVF Template. Regarding the allocated space, it will run with 50 GB, but for production conditions, it is recommended to allocate around 200 GB.
2.7. Select the folder where the OVF file is located.
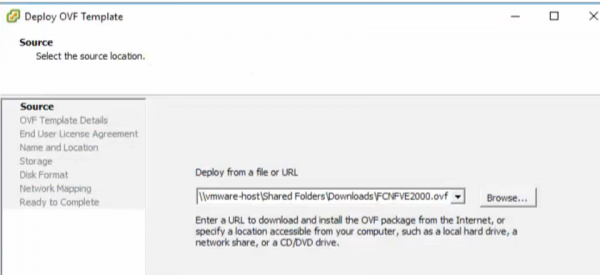
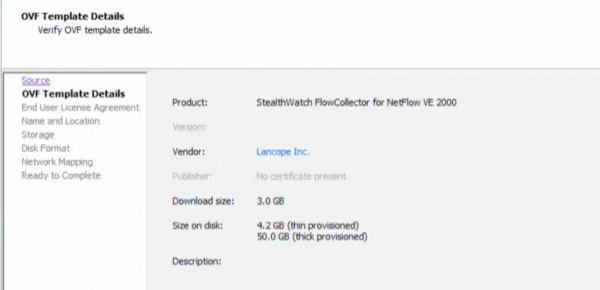
2.8. Click 'Next'.
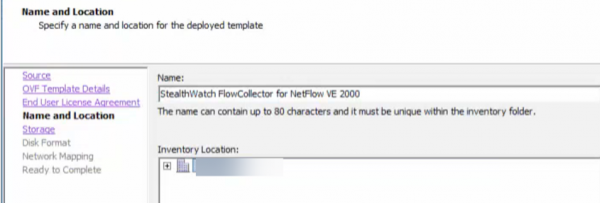
2.9. Specify the name and the server where we are deploying this.
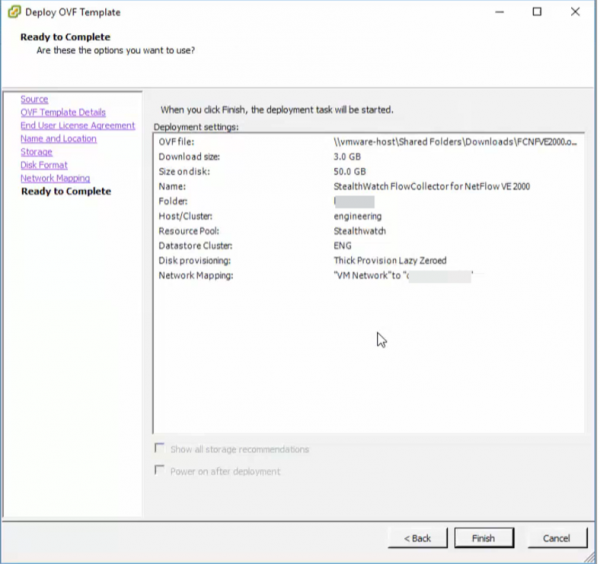
2.10. As a result, we get the following screen and click 'Finish'.
2.11. Repeat the same steps to deploy the StealthWatch Management Console.

2.12. Now, specify the necessary networks in the interfaces so that the FlowCollector can see both SMC and the devices from which NetFlow will be exported.
3. Initializing StealthWatch Management Console
3.1. Once you access the console of the installed SMCVE machine, you will see a place to enter the username and password, which by default is sysadmin/lab1cope.

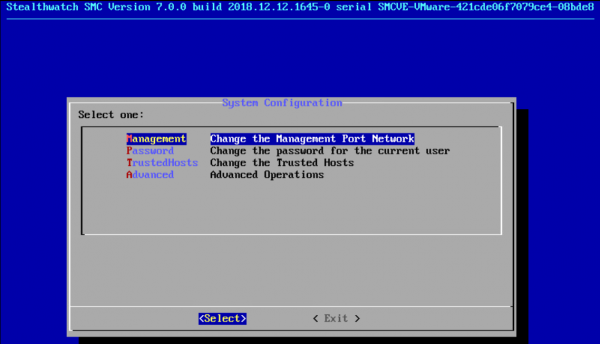
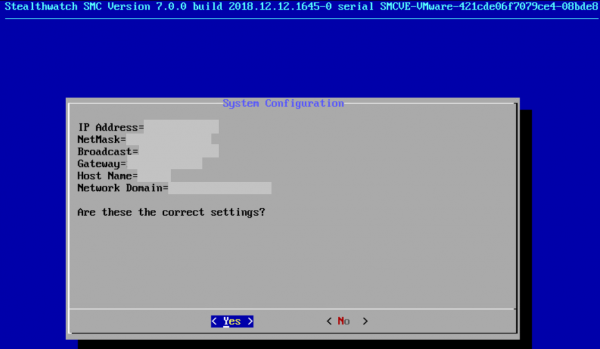
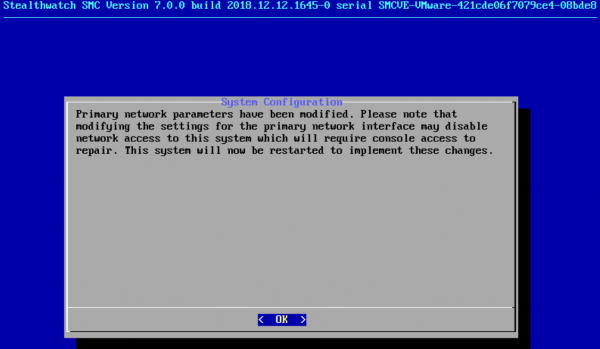
3.2. Go to the Management section, set the IP address and other network parameters, then confirm the changes. The device will reboot.
3.3. Navigate to the web interface (using HTTPS at the address assigned to SMC) and initialize the console; the default username/password is admin/lab411cope.
P.S.: Sometimes it won't open in Google Chrome, but Explorer will always work.
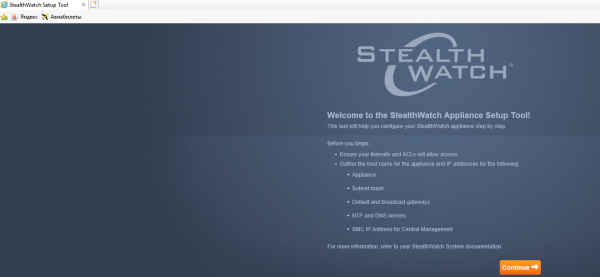
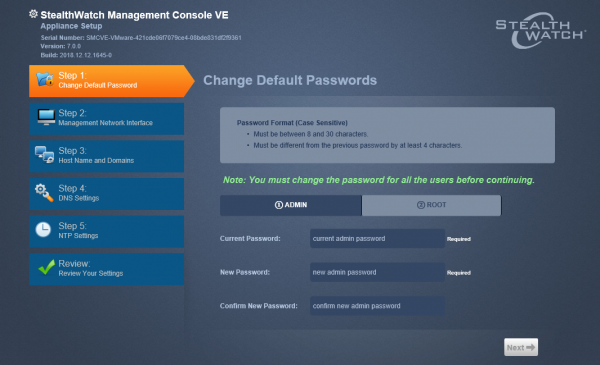
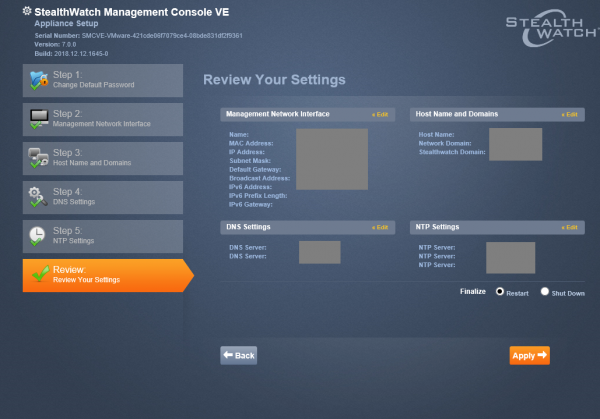
3.4. Be sure to change the passwords, set the DNS, NTP servers, domain, and other settings. The settings are intuitive.
3.5. After clicking the 'Apply' button, the device will reboot again. After 5-7 minutes, you can reconnect to this address; StealthWatch management will be done via the web interface.
4. Configuring FlowCollector
4.1. The process for the collector is the same. First, in the CLI, specify the IP address, mask, domain, then the FC will reboot. After that, you can connect to the web interface at the specified address and conduct the same basic setup. Due to the similarity of settings, detailed screenshots are omitted. Credentials for access the same.
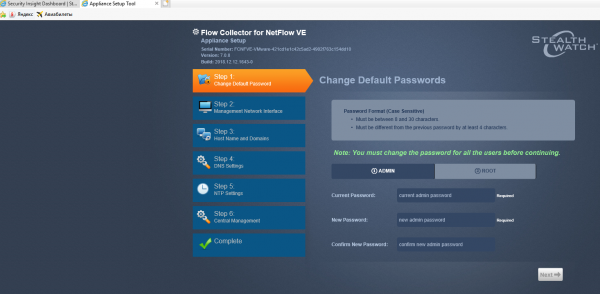
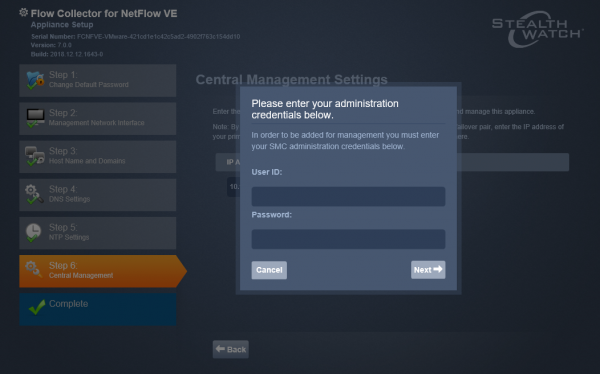
4.2. In the penultimate step, it is necessary to specify the SMC IP address; in this case, the console will be able to see the device, and you will have to confirm this setting by entering the credentials.
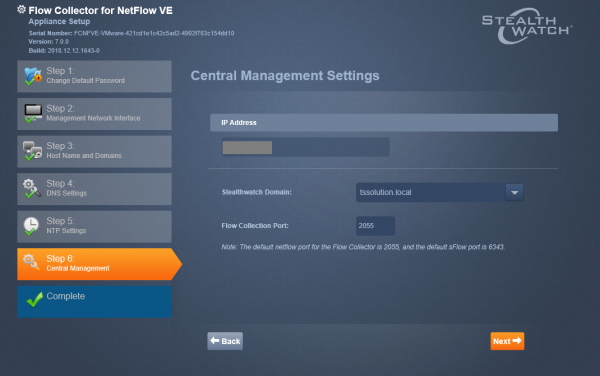
4.3. Choose the domain for StealthWatch, which was set earlier, and the port 2055 – standard NetFlow, if you are working with sFlow, the port 6343.
5. NetFlow Exporter Configuration
5.1. For configuring the NetFlow exporter, I highly recommend referring to this , here are the main guides for configuring the Netflow exporter for many devices: Cisco, Check Point, Fortinet.
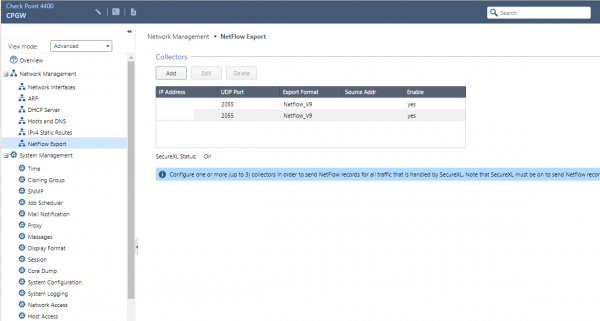
5.2. In our case, I repeat, we are exporting Netflow from the Check Point gateway. The configuration of the Netflow exporter is done in a similarly named tab in the web interface (Gaia Portal). To do this, you need to click 'Add', specify the Netflow version, and the required port.
6. Analyzing StealthWatch's operation
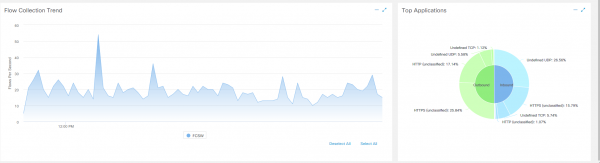
6.1. By going to the SMC web interface, on the first page Dashboards > Network Security, you can see that the traffic has started!
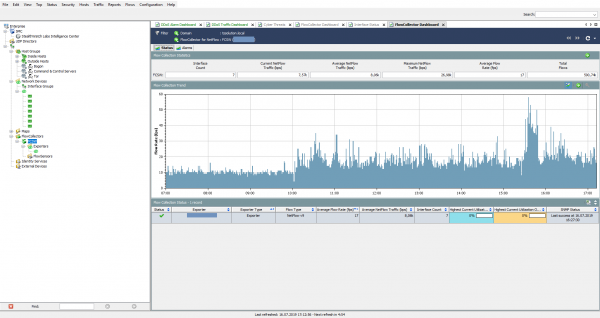
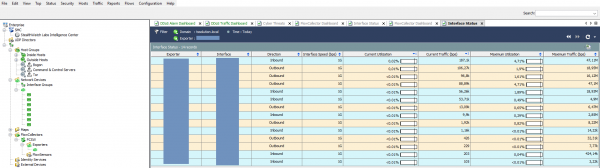
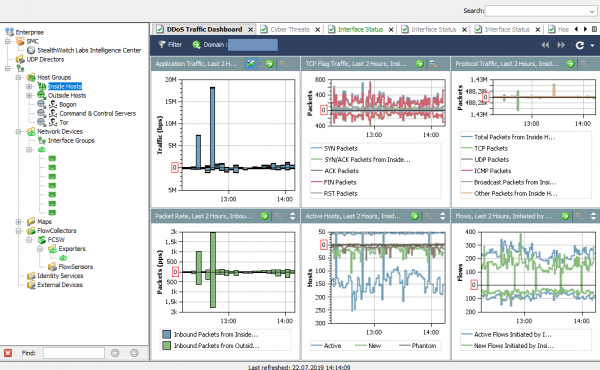
6.2. Some settings, such as grouping hosts, monitoring individual interfaces, their load, managing collectors, and others can only be found in the StealthWatch Java application. Naturally, Cisco is gradually transferring all functionality to the browser version, and soon we will part with this desktop client.
To install the application, you first need to install (I installed version 8, although it is said to support up to 10) from the official Oracle website.
In the top right corner of the web management console, to download you need to click the 'Desktop Client' button.
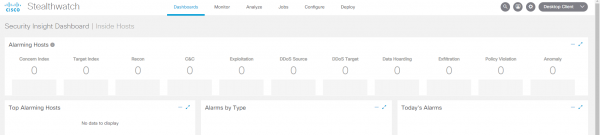
You manually save and install the client; Java will most likely complain about it, and you may need to add the host to the Java exceptions.
As a result, you have a fairly user-friendly client that easily shows the load of exporters, interfaces, attacks, and their flows.
7. StealthWatch Central Management
7.1. In the Central Management tab are all devices that are part of the deployed StealthWatch, such as: FlowCollector, FlowSensor, UDP-Director, and Endpoint Concentrator. Here you can manage network settings and services of devices, licenses, and manually turn off devices.
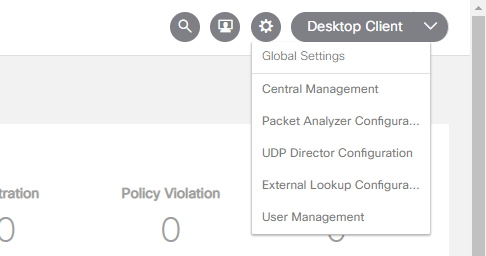
You can access it by clicking on the 'gear' in the top right corner and selecting Central Management.
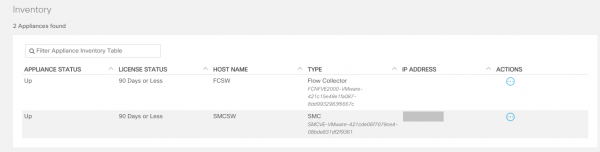
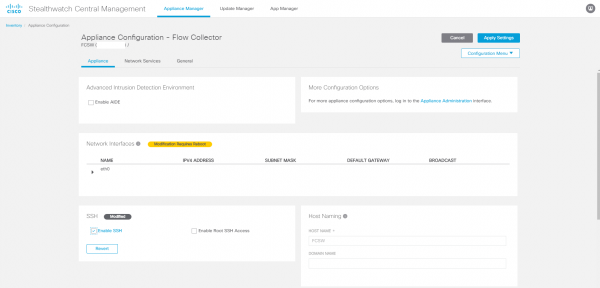
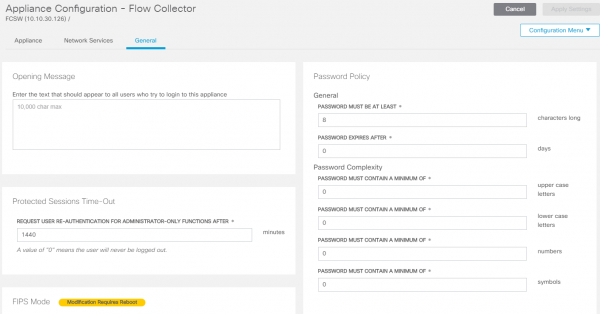
7.2. By going to Edit Appliance Configuration for the FlowCollector, you will see SSH settings, NTP, and other network settings related to the appliance. To access it, select Actions → Edit Appliance Configuration for the required device.
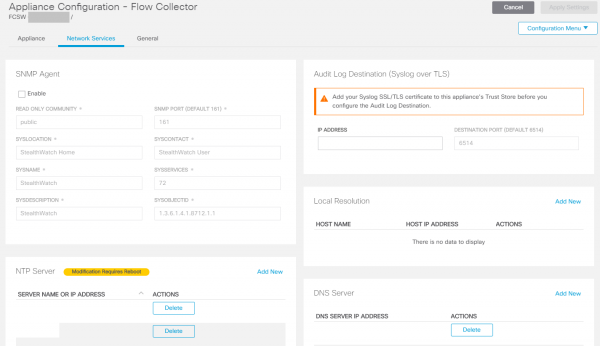
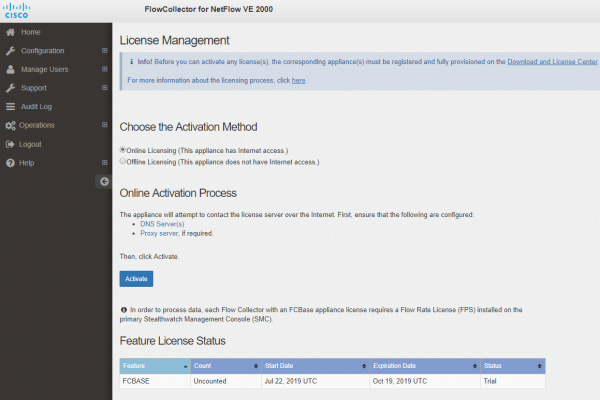
7.3. License management can also be found in the Central Management > Manage Licenses tab. Trial licenses in the case of GVE requests are given for 90 days..
The product is ready for use! In the next part, we will look at how StealthWatch can detect attacks and generate reports.
Source: habr.com
