

Hello everyone!
My name is Nikita, and I am the team lead for the engineers at Cian. One of my responsibilities in the company is to reduce the number of infrastructure-related incidents in production to zero.
What follows has caused us a lot of pain, and the aim of this article is to prevent others from repeating our mistakes or at least minimize their impact.
Preface
A long time ago, when Cian was made up of monoliths, with no hints of microservices, we measured resource availability by checking 3-5 pages.
If they respond — everything is fine; if they don’t respond for a long time — it’s an alert. How long they must be down to be considered an incident was determined by people in meetings. The engineering team was always involved in investigating incidents. Once the investigation was complete, we wrote a postmortem — a kind of report sent via email in the format: what happened, how long it lasted, what we did at the time, and what we will do in the future.
Key site pages or how we understand when we hit rock bottom
To better understand the priority of an error, we identified the most critical pages for business functionality on the site. We count the number of successful/unsuccessful requests and timeouts for these pages. This allows us to measure uptime.
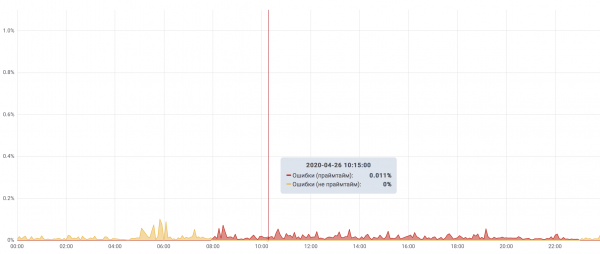
Suppose we determined that there are several super-important sections of the site responsible for the core services — searching and submitting listings. If the number of failed requests exceeds 1%, it is a critical incident. If during peak hours the error rate exceeds 0.1% for 15 minutes, it is also considered a critical incident. These criteria cover most incidents; the others fall outside the scope of this article.
Top incidents at Cian
So, we have indeed learned to identify when an incident occurs.
Now, each incident is described in detail and reflected in a Jira epic. By the way, for this, we created a separate project and named it FAIL — only epics can be created there.
If we gather all the failures from the last few years, the leaders are:
- incidents related to mssql;
- incidents caused by external factors;
- admin errors.
Let's take a closer look at admin errors, as well as some other interesting failures.
Fifth place — "Bringing order to DNS"
It was a gloomy Tuesday. We decided to tidy up the DNS cluster.
We wanted to migrate the internal DNS servers from BIND to PowerDNS, dedicating completely separate servers for this purpose, where nothing but DNS would be present.
We placed one DNS server in each location of our data centers, and the moment came to transfer the zones from BIND to PowerDNS and switch the infrastructure to the new servers.
At the height of the migration, out of all the servers servers, which were specified in the local caching BINDs across all servers, only one remained, located in the data center in Saint Petersburg. This data center was initially declared non-critical for us, but suddenly became a single point of failure.
Just during this migration period, the channel between Moscow and Saint Petersburg went down. We effectively lost DNS for five minutes and came back up when a host provider the issue was resolved.
Conclusions:
If previously we overlooked external factors during the preparation for work, we now included them in the list of what to anticipate. Now we strive for all components to be n-2 redundant, and during work, we can lower this level to n-1.
- While drafting the action plan, note the points where the service could fail, and think through a scenario where everything goes 'as bad as it could', in advance.
- Distribute internal DNS servers across different geolocations/data centers/racks/switches/inlets.
- On each server, set up a local caching DNS server that redirects requests to the main DNS servers, and in case it is unavailable, will respond from the cache.
The fourth point is 'Organizing Nginx'
One fine day, our team decided that 'enough is enough', and the process of refactoring the Nginx configs began. The main goal is to bring the configs to an intuitive structure. Previously, everything was 'historically developed' and had no logic to it. Now each server_name has been moved to a file with the same name, and all configs are organized into folders. By the way, the config contains 253,949 lines or 7,836,520 characters and takes up almost 7 megabytes. The top level of the structure:
Nginx structure
├── access
│   ├── allow.list
...
│   └── whitelist.conf
├── geobase
│   ├── exclude.conf
...
│   └── geo_ip_to_region_id.conf
├── geodb
│   ├── GeoIP.dat
│   ├── GeoIP2-Country.mmdb
│   └── GeoLiteCity.dat
├── inc
│   ├── error.inc
...
│   └── proxy.inc
├── lists.d
│   ├── bot.conf
...
│   ├── dynamic
│   └── geo.conf
├── lua
│   ├── cookie.lua
│   ├── log
│   │   └── log.lua
│   ├── logics
│   │   ├── include.lua
│   │   ├── ...
│   │   └── utils.lua
│   └── prom
│       ├── stats.lua
│       └── stats_prometheus.lua
├── map.d
│   ├── access.conf
│   ├── ..
│   └── zones.conf
├── nginx.conf
├── robots.txt
├── server.d
│   ├── cian.ru
│   │   ├── cian.ru.conf
│   │   ├── ...
│   │   └── my.cian.ru.conf
├── service.d
│   ├── ...
│   └── status.conf
└── upstream.d
    ├── cian-mcs.conf
    ├── ...
    └── wafserver.conf
It has significantly improved, but during the renaming and redistribution of the configs, some of them had incorrect extensions and did not get included in the include directive *.conf. As a result, some hosts became inaccessible and returned a 301 to the homepage. Since the response code was not 5xx/4xx, this was not noticed immediately, but only by morning. After that, we started writing tests to check the infrastructure components.
Conclusions:
- Properly structure your configs (not just nginx) and think through the structure at the early stages of the project. This will make them clearer for the team, which in turn will reduce TTM.
- For some infrastructure components, write tests. For example: check that all key server_name return the correct status, along with the response body. It suffices to have just a few scripts on hand that check the main functions of a component, so you don't have to frantically recall what else needs to be tested at 3 AM.
Third place — "Suddenly ran out of space in Cassandra"
The data was steadily growing, and everything was fine until the repairs of large keyspaces in the Cassandra cluster started failing because compaction could not process them.
One gloomy day, the cluster nearly turned into a pumpkin, namely:
- there was about 20% space left across the cluster;
- it is not possible to fully add nodes because cleanup does not pass after adding a node due to lack of space on partitions;
- performance gradually declines, as compaction does not work;
- the cluster operates in emergency mode.
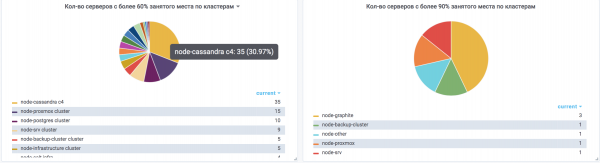
The exit — we added another 5 nodes without cleanup, after which we started systematically removing nodes from the cluster and reintroducing them as empty nodes, where space had run out. The time spent was significantly more than desired. There was a risk of partial or complete unavailability of the cluster.
Conclusions:
- No more than 60% of storage should be utilized on each partition of all Cassandra servers.
- They should be loaded no more than 50% in terms of CPU.
- Don't neglect capacity planning, and it should be thought out for each component based on its specifics.
- The more nodes in the cluster, the better. Servers containing a small amount of data are quicker to reallocate, and such a cluster is easier to revive.
Second place — 'Data disappeared from Consul key-value storage.'
For service discovery, we, like many, use Consul. However, we also use its key-value store for blue-green deployments of the monolith. It holds information about active and inactive upstreams, which swap places during deployment. A deployment service was written to interact with the KV. At some point, the data from the KV disappeared. We restored it from memory but with a number of errors. Consequently, during deployment, the load on the upstreams was distributed unevenly, and we encountered many 502 errors due to CPU overload on the backends. As a result, we moved from Consul KV to Postgres, from which it is not as easy to delete data.
Conclusions:
- Services without any authorization should not contain critical data necessary for the site's operation. For example, if you have no authorization in ES, it's better to block access at the network level from everywhere it isn't needed, leaving only the necessary access, and also set action.destructive_requires_name: true.
- Work out a backup and recovery mechanism in advance. For instance, prepare a script (e.g., in Python) that can both back up and restore data.
First place — 'Captain Obvious.'
At some point, we noticed an uneven load distribution on Nginx upstreams when there were more than 10 servers in the backend. Because round-robin directed requests to the first upstream in order, and each Nginx reload started over, the first upstreams always received more requests than the others. Consequently, they operated slower, affecting the entire site. This became increasingly noticeable as traffic volumes grew. Simply updating Nginx to include random did not work; we had to rewrite a lot of Lua code that had not functioned on version 1.15 at that time. We had to patch our Nginx 1.14.2 to add support for random. This solved the problem. This bug deserves the title of 'Captain Obvious.'
Conclusions:
It was very interesting and engaging to investigate this bug).
- Set up monitoring so it helps identify such fluctuations quickly. For example, you can use ELK to monitor the RPS of each backend of every upstream, tracking their response times from the perspective of Nginx. This helped us identify the problem.
Most failures could have been avoided with a more meticulous approach to what you're doing. Always remember Murphy's Law: Anything that can go wrong will go wrong, and build components with this in mind.
Source: habr.com
