


Good day, in previous articles we introduced the workings of the ELK Stack. Now, let's discuss the possibilities that a cybersecurity specialist can implement using these systems. What logs can and should be collected in Elasticsearch? We will consider the statistics that can be obtained by configuring dashboards and whether there is any benefit in this. How can we automate cybersecurity processes using the ELK stack? We'll outline the architecture of the system. In total, the implementation of all functionalities is a very large and challenging task, which is why we have given it a separate name — TS Total Sight.
Currently, solutions that consolidate and analyze cybersecurity incidents in one logical location are gaining popularity. As a result, specialists receive statistics and a roadmap for improving the cybersecurity posture of the organization. This is the goal we set for ourselves in utilizing the ELK stack, resulting in the main functionalities being divided into four sections:
- Statistics and visualization;
- Detection of cybersecurity incidents;
- Prioritization of incidents;
- Automation of cybersecurity processes.
Next, we will examine each section in more detail.
Detection of cybersecurity incidents
The main task in using Elasticsearch in our case is to collect only cybersecurity incidents. Incidents can be gathered from any security tools, provided they support some log forwarding methods, the standard being syslog or saving logs via SCP.
Standard examples of security tools from which log forwarding should be configured include:
- Any NGFW tools (Check Point, Fortinet);
- Any vulnerability scanners (PT Scanner, OpenVas);
- Web Application Firewall (PT AF);
- Netflow analyzers (Flowmon, Cisco StealthWatch);
- AD server.
After setting up log sending and configuration files in Logstash, you can correlate and compare incidents coming from various security tools. This is conveniently done using indexes, where we store all incidents related to a specific device. In other words, one index represents all incidents for one device. This distribution can be implemented in two ways.
The first option This is how to configure Logstash. To do this, it is necessary to duplicate the log by certain fields into a separate unit with a different type. Then, subsequently use this type. In the example, logs are cloned by the IPS blade of the Check Point firewall.
filter {
    if [product] == "SmartDefense" {
        clone {
	    clones => ["CloneSmartDefense"]
	    add_field => {"system" => "checkpoint"}
	}
    }
}
In order to save such events in a separate index depending on log fields, for example, like the Destination IP of the attack signature, you can use a similar construction:
output {
    if [type] == "CloneSmartDefense"{
    {
         elasticsearch {
    	 hosts => [",:9200"]
    	 index => "smartdefense-%{dst}"
    	 user => "admin"
    	 password => "password"
  	 }
    }
}
In this way, you can save all incidents to an index, for example, by IP address or by the machine's domain name. In this case, we save to the index «smartdefense-%{dst}», by the IP address of the signature value.
However, different products will have different fields for logs, which will lead to chaos and excessive memory consumption. In this case, you will need to carefully replace fields in the Logstash config settings with pre-thought-out ones that will be the same for all types of incidents, which is also a complex task.
The second implementation option — is to write a script or process that will, in real-time, query the Elasticsearch database, retrieve the necessary incidents, and save them into a new index. This is a challenging task, but it allows you to work with logs however you like and correlate directly with incidents from other security tools. This option offers maximum utility and flexibility in log handling for your case, but the challenge lies in finding a specialist capable of implementing it.
And naturally, the most important question, what can actually be correlated and detected?
There can be several options here, depending on what security tools are used in your infrastructure. A couple of examples:
- The most obvious and interesting option for those who have an NGFW solution and a vulnerability scanner. This involves comparing logs from IPS and the results of vulnerability scans. If an attack has been detected (but not blocked) by the IPS system, and this vulnerability remains unpatched on the end machine according to the scan results, it's essential to raise the alarm, as there is a high chance that the vulnerability has been exploited.
- Multiple login attempts from a single machine to various locations may indicate malicious activity.
- Downloading viral files by the user due to visiting a large number of potentially dangerous websites.
Statistics and visualization
The most obvious and understandable purpose of the ELK Stack is log storage and visualization. it was demonstrated how to ingest logs from various devices using Logstash. Once the logs are in Elasticsearch, you can set up dashboards, which were also mentioned , with the information and statistics you need through visualization.
Examples:
- A dashboard for Threat Prevention events with the most critical incidents. This can reflect which IPS signatures were detected, and from where geographically they originate.
- A dashboard for the usage of the most critical applications through which information may leak.
- Scan results from any security scanner.
- Active Directory logs by users.
- A dashboard for VPN connections.
In this case, if you configure the dashboards to update every few seconds, you can create a very convenient real-time event monitoring system that can be used for the fastest response to security incidents, especially if the dashboards are displayed on a separate screen.
Incident prioritization
In large infrastructures, the number of incidents can be overwhelming, and specialists may not be able to address all incidents in a timely manner. In this case, it is essential to prioritize only those incidents that pose a significant threat. Therefore, the system should rank incidents by their danger relative to your infrastructure. It is advisable to set up notifications via email or Telegram for these events. Prioritization can be implemented using Kibana's built-in tools by configuring visualizations. However, notification is more challenging, as this functionality is not included in the basic version of Elasticsearch by default—only in the paid version. So you either need to purchase the paid version or write a process yourself that will alert specialists in real-time via email or Telegram.
Automation of cybersecurity processes
One of the most interesting aspects is the automation of actions for cybersecurity incidents. Previously, we implemented this functionality for Splunk; you can read more about it in this article. The main idea is that the IPS policy is never checked or optimized, even though it is a crucial part of cybersecurity processes in some cases. For example, a year after implementing NGFW and without any optimization actions on the IPS, you will accumulate a large number of signatures with a Detect action that will not be blocked, significantly lowering the state of cybersecurity in the organization. Here are some examples of what can be automated:
- Changing the action of IPS signatures from Detect to Prevent. If critical signatures do not have Prevent enabled, that is a problem and a serious gap in the protection system. We need to change the action in the policy for those signatures. This functionality can be implemented if the NGFW device has REST API capabilities. This is only possible if you have programming skills; you need to extract the necessary information from Elasticsearch and make API requests to the NGFW management server.
- If numerous signatures are detected or blocked from one IP address in network traffic, it makes sense to temporarily block that IP address in the Firewall policy. The implementation also involves using the REST API.
- Start a host check with a vulnerability scanner if this host has a large number of signatures from IPS or other security tools. If it is OpenVas, you can write a script that connects to the security scanner via SSH and initiates the scan.
TS Total Sight
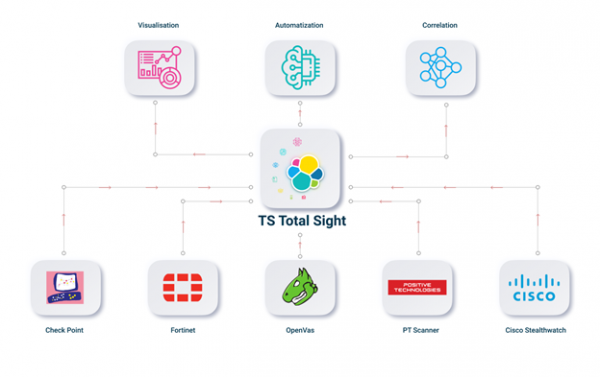
In total, implementing all the functionalities is a very large and complex task. Without programming skills, one can set up minimal functionality, which may be sufficient for production use. However, if you are interested in all the features, you might want to consider TS Total Sight. You can find more details on our . As a result, the entire workflow and architecture will look like this:
Conclusion
We have looked at what can be implemented using the ELK Stack. In subsequent articles, we will explore the functionalities of TS Total Sight in more detail!
So stay tuned for updates (, , , ), .
Source: habr.com
