


Netflix is the market leader in internet television, a company that has created and actively develops this segment. Netflix is known not only for its extensive catalog of films and series accessible from almost any corner of the globe on any display device but also for its reliable infrastructure and unique engineering culture.
A vivid example of Netflix's approach to developing and maintaining complex systems was presented by , the Director of Development at Netflix. A graduate of the Faculty of Mathematics and Computer Science at Lobachevsky NNGU, Sergey is one of the first engineers in Open Connect, Netflix's CDN team. He built monitoring and analysis systems for video data, launched the popular service for measuring internet speed, FAST.com, and for the past few years has been working on optimizing internet requests to ensure the Netflix app runs as quickly as possible for users.
The presentation received excellent feedback from conference attendees, and we have prepared a text version for you.

In the presentation, Sergey detailed
- what factors influence the latency of internet requests between the client and the server;
- how to reduce this latency;
- how to design, maintain, and monitor fault-tolerant systems;
- how to achieve results in tight deadlines with minimal risk to the business;
- how to analyze results and learn from mistakes.
Answers to these questions are needed not only by those who work in large corporations.
The principles and techniques presented should be known and practiced by everyone who develops and supports internet products.
Next is a narrative from the speaker's perspective.
The Importance of Internet Speed
The speed of internet requests is directly related to business. Let's consider the shopping sphere: Amazon stated in 2009 The number of mobile devices is increasing, along with mobile websites and applications. If your page takes longer than 3 seconds to load, you lose about half of your users. Since
July 2018, Connection speed is also crucial in financial organizations, where delays are critical. In 2015, Hibernia Networks
completed a cable conduit between New York and London costing $400 million, to reduce the delay between the cities by 6 ms. Imagine, $66 million for a 1 ms reduction in delay!
According to , connection speed over 5 Mbps no longer directly affects the loading speed of a typical website. However, there is a linear relationship between connection latency and page load speed:
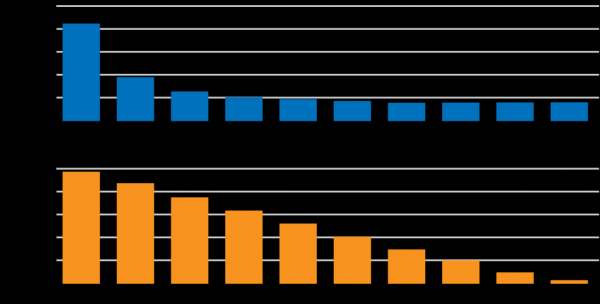
However, Netflix is not a typical product. The impact of latency and speed on the user is an active area of analysis and development. There is the app loading and content selection, which depend on latency, but loading static elements and streaming also depend on connection speed. The analysis and optimization of key factors affecting service quality for users is an active development focus of several teams at Netflix. One of the tasks is to reduce request latency between Netflix devices and the cloud infrastructure.
In this report, we will focus specifically on reducing latency using the Netflix infrastructure as an example. We will look at how to approach the design, development, and operation processes of complex distributed systems from a practical perspective, spending time on innovation and results rather than diagnosing operational problems and failures.
Inside Netflix
Thousands of different devices support Netflix applications. Their development is handled by four different teams, each creating separate client versions for Android, iOS, TV, and web browsers. We invest a lot of effort into improving and personalizing the user interface. To this end, we run hundreds of A/B tests in parallel.
Personalization is supported by hundreds of microservices in the AWS cloud, providing personalized data for the user, request dispatching, telemetry, Big Data, and Encoding. The traffic visualization looks like this:
On the left is the entry point, and then traffic is distributed among hundreds of microservices supported by different backend teams.
Another important component of our infrastructure is the Open Connect CDN, which delivers static content to the end user—videos, images, code for clients, etc. The CDN is located on custom servers (OCA - Open Connect Appliance). Inside, there are arrays of SSD and HDD drives managed by optimized FreeBSD, with NGINX and a suite of services. We design and optimize the hardware and software components so that this CDN server can send as much data to users as possible.
The 'wall' of these servers at the internet traffic exchange point (Internet eXchange - IX) looks like this:
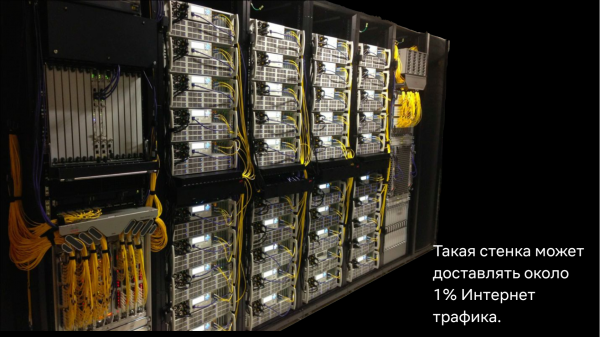
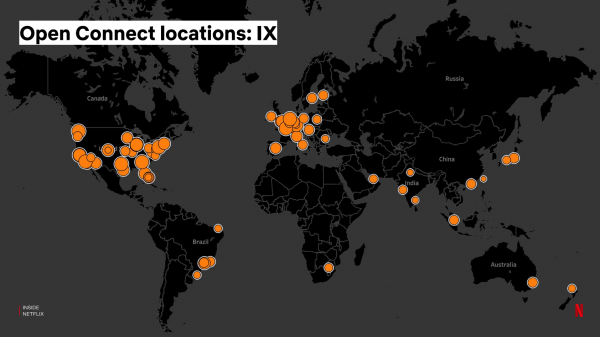
The Internet Exchange provides the ability for internet service providers and content providers to 'connect' with each other for more direct data exchange over the internet. There are approximately 70-80 Internet Exchange points worldwide where our servers are installed, and we handle their installation and maintenance ourselves:
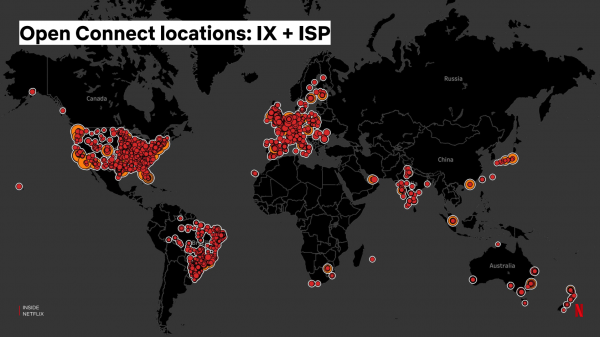
In addition to this, we also provide servers directly to internet service providers who install them in their networks, improving the localization of Netflix traffic and the quality of streaming for users:
The set of AWS services is responsible for dispatching video requests from clients to CDN servers, as well as configuring the servers themselves—updating content, software code, settings, etc. For this purpose, we also built a backbone network that connects servers at Internet Exchange points with AWS. The backbone network consists of a global network of fiber optic cables and routers that we can design and configure based on our needs.
According to , our CDN infrastructure delivers about ⅛ of global internet traffic and ⅓ of the traffic in North America during peak hours, where Netflix has been established the longest. Impressive figures, but for me, one of the most astonishing achievements is that the entire CDN system is developed and maintained by a team of fewer than 150 people.
Initially, the CDN infrastructure was designed for video data delivery. However, over time, we realized that we could also use it to optimize dynamic requests from clients to the AWS cloud.
About accelerating the internet
Today, Netflix has 3 AWS regions, and the latency for cloud requests will depend on how far the client is from the nearest region. We also have numerous CDN servers that are used for delivering static content. Is there a way to utilize this infrastructure to accelerate dynamic requests? Unfortunately, we cannot cache these requests — the APIs are personalized and each result is unique.
Let's set up a proxy on the CDN server and start routing traffic through it. Will this be faster?
Hardware
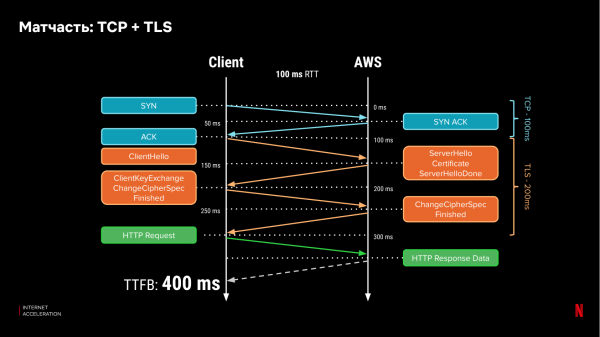
Let's recall how network protocols work. Today, most internet traffic uses HTTPS, which relies on lower-level protocols TCP and TLS. For a client to connect to a server, it performs a handshake, and to establish a secure connection, the client must exchange messages with the server three times and at least once more to transmit data. With a latency of one exchange (RTT) being 100 ms, we will need 400 ms to get the first bit of data:
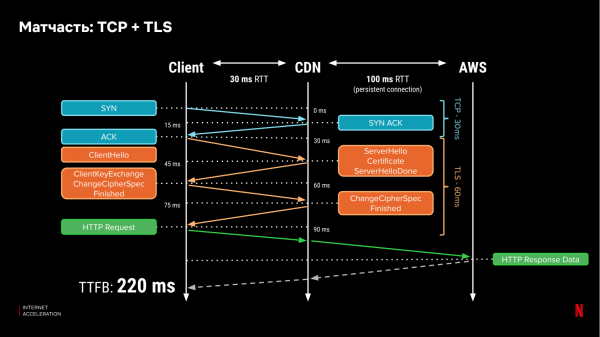
If we place the certificates on the CDN server, we can significantly reduce the handshake time between the client and the server if the CDN is closer. Let's assume the latency to the CDN server is 30 ms. Then, obtaining the first bit will require only 220 ms:
But the benefits don't stop there. Once the connection is established, TCP increases the congestion window (the amount of information it can transmit over this connection simultaneously). If a data packet is lost, classic implementations of the TCP protocol (like TCP New Reno) halve the open 'window'. The growth of the congestion window, and the speed of its recovery from loss, again depend on the latency (RTT) to the server. If this connection only goes to the CDN server, the recovery will be faster. Packet loss is a standard occurrence, especially for wireless networks.
Internet bandwidth can decrease, especially during peak hours due to user traffic, which can lead to "congestion." There is no way to prioritize some requests over others on the internet. For example, prioritizing small and latency-sensitive requests over "heavy" data streams that load the network. However, in our case, having our own backbone network allows us to do this for part of the request path — between the CDN and the cloud, and we can configure it fully. We can prioritize small, latency-dependent packets while allowing larger data streams to proceed slightly later. The closer the CDN is to the client, the more efficient it becomes.
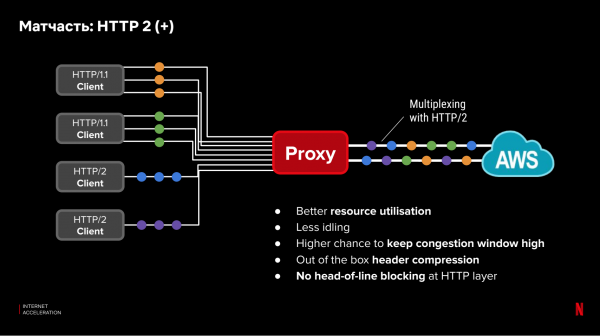
The latency is also affected by application layer protocols (OSI Level 7). New protocols, such as HTTP/2, allow for optimizing the performance of parallel requests. However, we have Netflix clients with old devices that do not support new protocols. Not all clients can be updated or optimally configured. However, between the CDN proxy and the cloud, there is complete control and the ability to use new, optimal protocols and configurations. The inefficient part with the old protocols will only act between the client and the CDN server. Moreover, we can multiplex requests over an already established connection between the CDN and the cloud, improving connection utilization at the TCP level.
Measuring
Although theory promises improvements, we do not rush to launch the system into production immediately. Instead, we must first prove that the idea will work in practice. To do this, we need to answer several questions:
- Speed: will the proxy be faster?
- Reliability: will it break more often?
- Complexity: how to integrate with applications?
- Cost: what is the cost of deploying additional infrastructure?
Let's take a closer look at our approach to evaluating the first point. The others are addressed in a similar way.
To analyze the speed of requests, we want to gather data for all users without spending too much time on development and without breaking production. There are several approaches for this:
- RUM, or passive measurement of requests. We measure the execution time of current user requests and ensure complete user coverage. The downside is that the signal is not very stable due to various factors, such as different request sizes and processing times on both the server and client sides. Additionally, it is not possible to test a new configuration without affecting production.
- Laboratory tests. Special servers and infrastructure that simulate clients. With their help, we conduct necessary tests. This gives us complete control over measurement results and clear signals. However, there is no full coverage of devices and user locations (especially with a service spanning the globe and supporting thousands of device models).
How can we combine the advantages of both methods?
Our team has found a solution. We wrote a small piece of code — a probe — which we embedded in our application. Probes allow us to perform fully controlled network tests from our devices. Here’s how it works:
- Shortly after the application is loaded and the initial activity is completed, we launch our probes.
- The client makes a request to the server and receives a "test recipe." The recipe consists of a list of URLs to which HTTP(s) requests should be made. In addition, the recipe configures the request parameters: delays between requests, the amount of data requested, HTTP(s) headers, etc. We can simultaneously test several different recipes — during the request for configuration, we randomly determine which recipe to deliver.
- The timing of the probe launch is chosen so as not to conflict with active use of network resources on the client side. Essentially, a time is chosen when the client is inactive.
- After receiving the recipe, the client makes requests to each of the URLs in parallel. The request to each address can be repeated — these are known as "pulses." In the first pulse, we measure how long it took to establish a connection and download data. In the second pulse, we measure the data loading time over an already established connection. Before the third pulse, we can introduce a delay and measure the speed of re-establishing a connection, etc.
During the test, we measure all parameters that the device can obtain:
- DNS query time;
- TCP connection setup time;
- TLS connection setup time;
- time to receive the first byte of data;
- total loading time;
- status code of the result.
- After all pulses are completed, the probe uploads the results of all measurements for analytics.
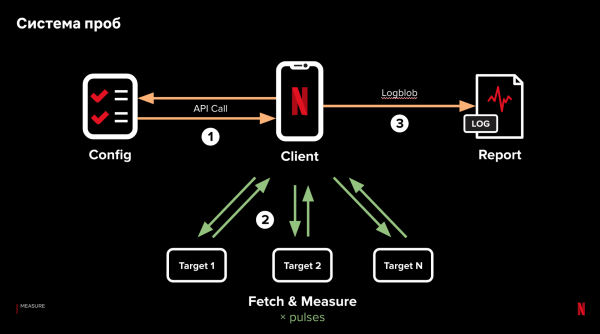
Key points include minimal client-side logic dependence, server-side data processing, and measuring parallel requests. This allows us to isolate and test the influence of various factors affecting request performance, vary them within one recipe, and obtain results from real clients.
Such infrastructure has proven useful not only for analyzing request performance. Currently, we have 14 active recipes, over 6000 probes per second, collecting data from all corners of the earth with full device coverage. If Netflix were to purchase such a service from third-party companies, it would cost millions of dollars per year with much worse coverage.
Testing the theory in practice: prototype
With this system, we gained the ability to evaluate the effectiveness of CDN proxy on request latency. Now we need to:
- create a proxy prototype;
- deploy the prototype on the CDN;
- determine how to direct clients to the proxy on a specific CDN server;
- compare performance with requests in AWS without a proxy.
The task is to assess the effectiveness of the proposed solution as quickly as possible. For the prototype implementation, we chose Go due to its good networking libraries. On each CDN server, we installed the proxy prototype as a static binary to minimize dependencies and simplify integration. In the initial implementation, we maximized the use of standard components and made slight modifications for HTTP/2 connection pooling and request multiplexing.
To balance between AWS regions, we used a geographic DNS database, the same one used for client load balancing. To select a CDN server for the client, we use TCP Anycast for servers in the Internet Exchange (IX). In this setup, we use a single IP address for all CDN servers, directing the client to the CDN server with the fewest IP hops. For CDN servers installed with internet service providers (ISPs), we have no control over the router to configure TCP Anycast, so we use , by which clients are directed to ISPs for video streaming.
So, we have three types of paths for the request: to the cloud through the open internet, through a CDN server in IX, or through a CDN server located at the internet provider. Our goal is to understand which path is better and what the benefits of a proxy are compared to how requests are directed in production. To do this, we use a probing system as follows:
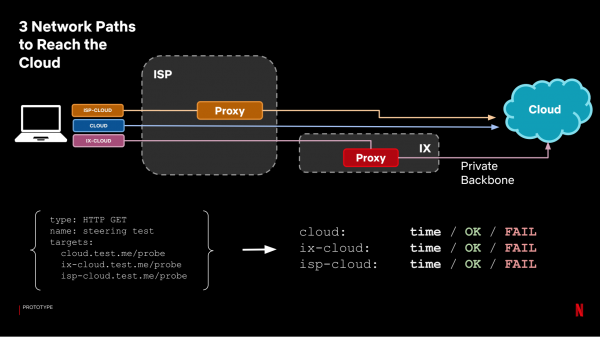
Each of the paths becomes a separate target, and we look at the time we obtained. For analysis, we group proxy results into one set (choosing the best time between IX and ISP proxy) and compare it with the request times to the cloud without a proxy:
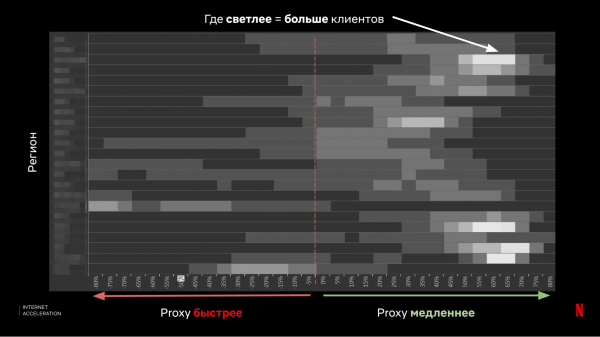
As we can see, the results were ambiguous — in most cases, a proxy provides a good speedup, but there are also a sufficient number of clients for whom the situation significantly worsens.
In the end, we accomplished several important things:
- We evaluated the expected performance of requests from clients to the cloud via CDN proxy.
- We obtained data from real clients across all types of devices.
- We understood that the theory was not confirmed 100%, and the initial proposal with CDN proxy would not work for us.
- We took no risks — we did not change the production configurations for clients.
- We broke nothing.
Prototype 2.0
So, we return to the drawing board and repeat the process from the beginning.
The idea is that instead of a 100% proxy, we will determine the fastest path for each client and direct requests there — this is what is called client steering.
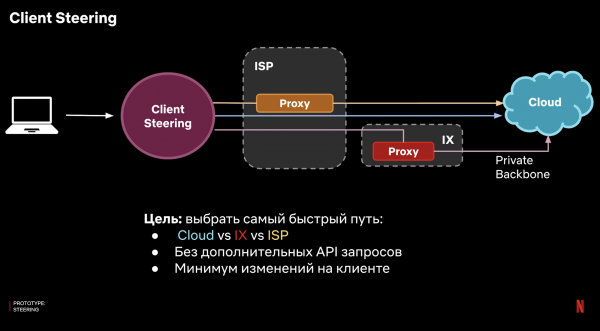
How to implement this? We cannot use server-side logic as the goal is to connect to this server. This needs to be done somehow on the client side. Ideally, it should be accomplished with minimal complex logic to avoid integration issues with a wide range of client platforms.
The answer is the use of DNS. In our case, we have our own DNS infrastructure, and we can configure a domain zone for which our servers will be authoritative. This works as follows:
- The client makes a request to the DNS server using the host, for example, api.netflix.com.
- The request reaches our DNS server.
- The DNS server knows the fastest path for this client and provides the corresponding IP address.
There is an additional complexity in the solution: authoritative DNS providers do not see the client's IP address and can only see the IP address of the recursive resolver that the client uses.
As a result, our authoritative resolver must make decisions not for an individual client, but for a group of clients based on the recursive resolver.
To solve this, we use the same probes, aggregating measurement results from clients for each recursive resolver and deciding where to direct this group — proxy through IX via TCP Anycast, through ISP proxy, or directly to the cloud.
We obtain the following system:
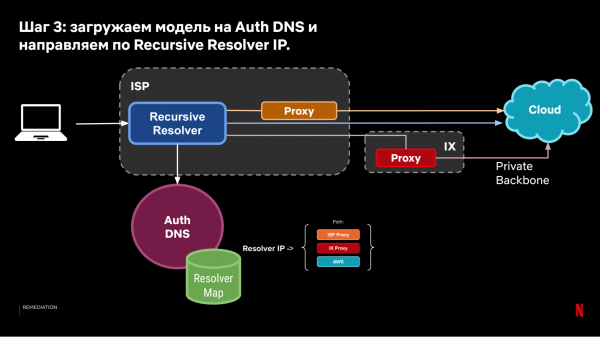
The resulting DNS steering model allows us to direct clients based on historical observations of connection speeds from clients to the cloud.
Again, the question is how effectively this approach will work? To answer this, we use our probing system again. Therefore, we configure the recent configuration, where one of the targets follows the DNS steering direction, and the other goes directly to the cloud (current production).
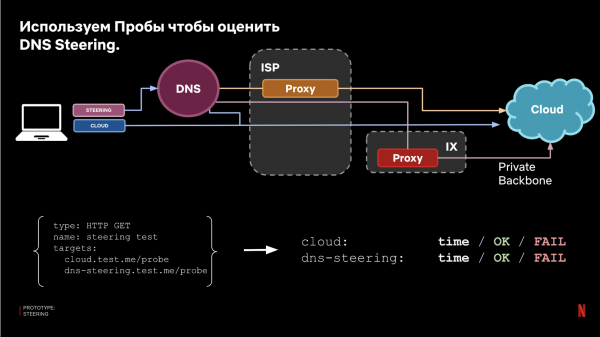
As a result, we compare the results and obtain an efficiency estimate:
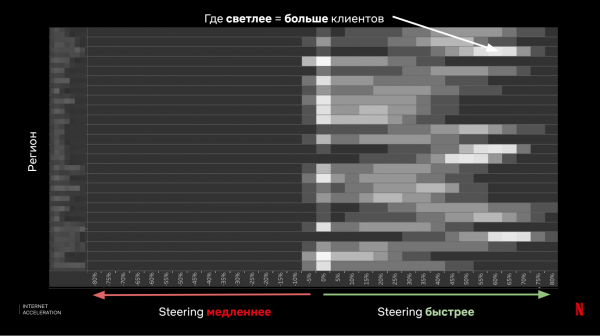
In the end, we learned several important things:
- We assessed the expected performance of requests from clients to the cloud using DNS Steering.
- We obtained data from real clients across all types of devices.
- We proved the effectiveness of the proposed idea.
- We took no risks — we did not change the production configurations for clients.
- We broke nothing.
Now to the complex part — launching in production.
The easiest part is now behind us — we have a working prototype. The challenging part is to launch the solution for all of Netflix’s traffic, deploying it to 150 million users, thousands of devices, hundreds of microservices, and a constantly changing product and infrastructure. Netflix servers receive millions of requests per second, and it's easy to break the service with a careless action. At the same time, we want to dynamically route traffic through thousands of CDN servers in an environment where things change and break constantly, often at the least opportune moment.
And through all this, there are 3 engineers in the team responsible for the development, deployment, and full support of the system.
So next, we will discuss a calm and healthy sleep.
How to continue development without spending all the time on support? Our approach is based on three principles:
- We reduce the potential blast radius.
- We prepare for surprises — we expect that something will break, despite testing and personal experience.
- Graceful degradation — if something is not working as it should, it should be fixed automatically, even if not in the most efficient way.
It turned out that in our case, with such an approach to the problem, we can find a simple and effective solution and significantly simplify system support. We realized that we could add a small piece of code to the client to monitor network request errors caused by connection issues. In the event of network errors, we fallback directly to the cloud. This solution requires minimal effort from client teams, but greatly reduces the risk of unexpected failures and surprises for us.
Of course, despite the fallback, we nonetheless follow strict discipline during development:
- Testing on samples.
- A/B testing or Canaries.
- Progressive rollout.
The approach for sampling has been described — changes are first tested using a configured recipe.
For canary testing, we need to obtain comparable pairs of servers that can be used to compare how the system works before and after changes. For this, we sample pairs of servers from our many CDN sites that receive comparable traffic:
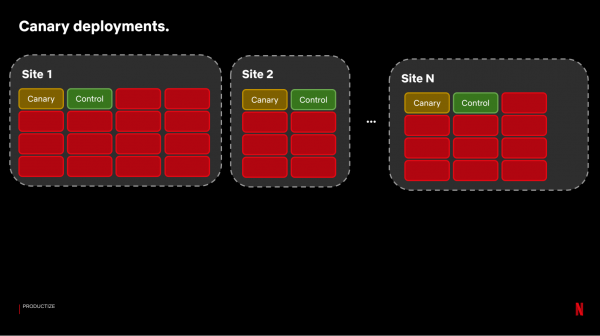
We then deploy the build with changes to the Canary servers. To evaluate the results, we run a system that compares about 100-150 metrics with a sample of Control servers:
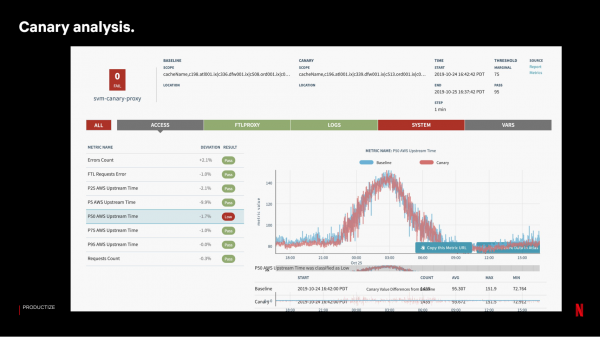
If the Canary testing is successful, we gradually release it in waves. On each site, we do not update servers simultaneously — losing an entire site in case of issues has a more significant impact on service for users than losing the same number of servers in different locations.
Overall, the effectiveness and security of this approach depend on the quantity and quality of collected metrics. For our request acceleration system, we gather metrics from all possible components:
- from clients — the number of sessions and requests, fallback rates;
- proxies — statistics on the number and time of requests;
- DNS — the number and results of requests;
- cloud edge — the number and time taken to process requests in the cloud.
All of this is collected into a single pipeline, and depending on needs, we decide which metrics to send for real-time analytics and which ones to send to Elasticsearch or Big Data for more detailed diagnostics.
Monitoring

In our case, we make changes to the critical path of requests between the client and the server. The number of different components on the client, on the server, and on the path through the internet is vast. Changes on the client and server are constant — due to the work of dozens of teams and natural changes in the ecosystem. We are in the middle — when diagnosing issues, there is a high chance that we will be involved. Therefore, we need to clearly understand how to identify, collect, and analyze metrics for rapid problem localization.
Ideally, we would have complete access to all types of metrics and filters in real-time. However, there are many metrics, so the question of costs arises. In our case, we separate metrics and development tools as follows:
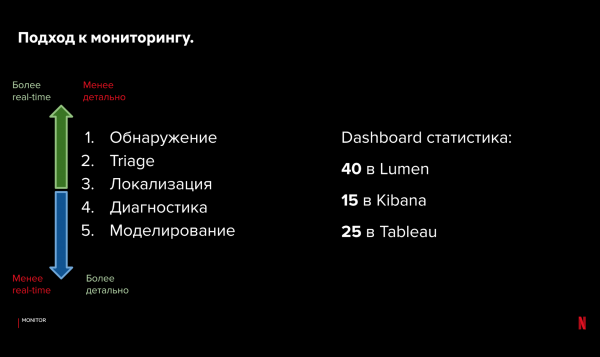
For detecting and triaging problems, we use our own open-source real-time system and — for visualization. It stores aggregated metrics in memory, is reliable, and integrates with the alerting system. For localization and diagnostics, we have access to logs from Elasticsearch and Kibana. For statistical analysis and modeling, we utilize big data and visualization in Tableau.
It seems very difficult to work with such an approach. However, with a hierarchical organization of metrics and tools, we can quickly analyze the problem, identify the type of issue, and then delve into detailed metrics. On average, we spend about 1-2 minutes identifying the source of the malfunction. After this, we work with a specific team on diagnostics, which can take anywhere from several minutes to a few hours.
Even if diagnostics are done quickly, we don’t want it to happen often. Ideally, we would receive a critical alert only when there is a significant impact on the service. For our request acceleration system, we have just 2 alerts that will notify us:
- Client Fallback Percentage — a measure of client behavior;
- Probe Errors Percentage — stability data for network components.
These critical alerts monitor whether the system is functioning for the majority of users. We look at how many clients used fallback when they couldn't achieve request acceleration. We average less than 1 critical alert per week, even though a tremendous number of changes occur in the system. Why is this sufficient for us?
- There’s a client fallback in case our proxy fails.
- There is an automatic steering system that responds to issues.
Let’s elaborate on the latter. Our probe system and the automatic optimal path determination system for client requests to the cloud allow us to automatically handle certain problems.
Returning to our probe configuration and the 3 categories of paths. Beyond load time, we can also track the delivery aspect. If data fails to load, we can determine where and what broke by looking at the results from various paths, and whether we can fix it automatically by changing the request path.
Examples:
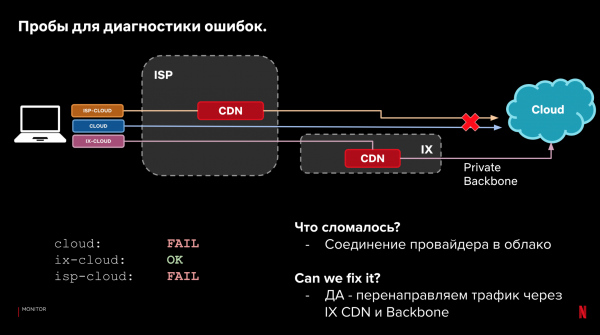
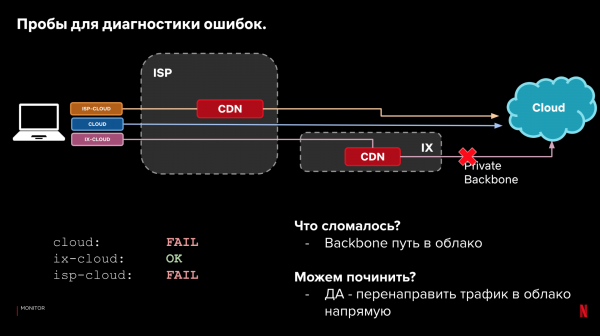
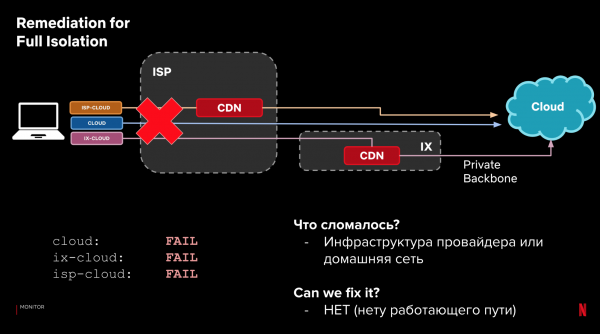
This process can be automated. It can be integrated into the steering system. And we can train it to respond to performance and reliability issues. If something starts to break, it can react if there’s a better option. At the same time, instant response isn’t critical, thanks to the fallback on clients.
Thus, the principles for supporting the system can be formulated as follows:
- reduce the scale of failures;
- collect metrics;
- automatically fix issues if possible;
- if not, notify.
- We are working on dashboards and a triage toolset for quick response.
Lessons Learned
It doesn't take long to write a prototype. In our case, it was ready in just 4 months. With it, we were able to gather new metrics, and after 10 months from the start of development, we received our first production traffic. Then began the tedious and very complex work: gradually productizing and scaling the system, migrating the main traffic, and learning from mistakes. This effective process won’t be linear — despite all efforts, not everything can be anticipated. Rapid iteration and responding to new data is much more effective.
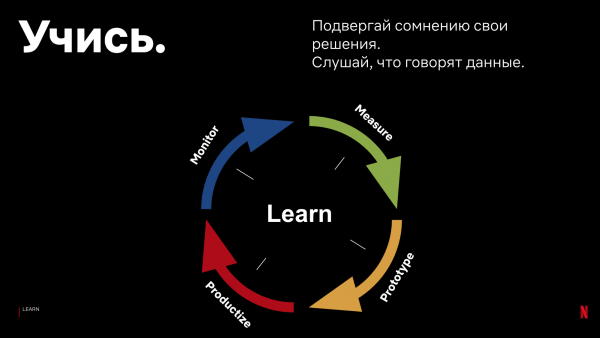
Based on our experience, we can recommend the following:
- Don't trust your intuition.
Our intuition constantly let us down, despite the vast experience of team members. For example, we incorrectly predicted the expected acceleration from using a CDN proxy or the behavior of TCP Anycast.
- Get data from production.
It’s important to gain access to at least a small amount of production data as quickly as possible. The number of unique cases, configurations, and settings that can be achieved in lab conditions is practically impossible to obtain. Quick access to results will allow you to learn about potential problems faster and account for them in the system architecture.
- Don’t follow other people's advice and results — gather your own data.
Follow the principles of data collection and analysis, but don’t blindly take other people's results and claims. Only you can know what works for your users. Your systems and your clients may significantly differ from those of other companies. Thankfully, analysis tools are now available and easy to use. The results you obtain may not match what Netflix, Facebook, Akamai, and other companies claim. In our case, the performance of TLS, HTTP2, or DNS request statistics differs from those of Facebook, Uber, Akamai — because we have different devices, clients, and data flows.
- Don’t chase trendy trends unnecessarily without evaluating their effectiveness.
Start with something simple. It's better to build a simple working system in a short time than to spend a lot of time developing unnecessary components. Solve tasks and problems that are important based on your measurements and results.
- Be prepared for new applications.
Just as it's difficult to foresee all problems, it's equally challenging to predict benefits and applications in advance. Take a cue from startups — their ability to adapt to customer conditions is remarkable. In your case, you may discover new problems and their solutions. In our project, we aimed to reduce request latency. However, through analysis and discussions, we realized that proxy servers can also be used for:
- traffic balancing across AWS regions and reducing costs;
- modeling CDN stability;
- configuring DNS;
- configuring TLS/TCP.
Conclusion
In my report, I described how Netflix addresses the challenge of speeding up internet requests between clients and the cloud. We collect data using client probe systems and use the historical data gathered to direct production requests from clients through the quickest route on the internet. We apply the principles of network protocols, our CDN infrastructure, backbone network, and DNS servers to achieve this goal.
However, our solution is just one example of how we at Netflix implemented such a system. What worked for us. The practical part of my presentation for you is the development and support principles we follow to achieve good results.
Our problem-solving approach may not suit you. However, the theories and development principles stand firm, even if you do not have your own CDN infrastructure, or if it significantly differs from ours.
The importance of request speed for business remains critical. Even for a basic service, choices must be made: among 'cloud' providers, server locations, CDN, and DNS providers. Your choice will impact the efficiency of internet requests for your clients. It’s essential to measure and understand this impact.
Start with simple solutions, care about how you change your product. Learn in the process and refine the system based on data from your clients, your infrastructure, and your business. Consider the possibility of unexpected failures during design. Then you can accelerate your development process, improve solution efficiency, avoid excessive support loads, and sleep soundly.
This year in an online format. You will be able to ask questions to one of the fathers of DevOps, John Willis himself!
Source: habr.com
