

Greetings, and first a little bit of poetry. I sometimes envy my colleagues who work remotely — it’s wonderful to have the ability to work from anywhere in the connected world, take vacations at any time, and have responsibility for projects and deadlines, rather than being in the office from 8 to 5. My position and responsibilities nearly eliminate the possibility of being away from the data center for long. However, there are occasionally interesting cases, like the one described below, and I realize that there are few positions that offer such a scope for the creative expression of an internal troubleshooter.
A small disclaimer — at the time of writing, the case is not fully resolved, but considering the vendors' response time, a complete solution may take months, and I want to share my findings now. I hope dear readers will forgive me for this haste. But enough about that — what’s going on with the case?
First, some background: there is a company (where I work as a network engineer) that hosts client solutions in a private VMWare cloud. Most new solutions connect to VXLAN segments managed by NSX-V — I won't evaluate how much time this solution has gifted me, simply put — a lot. I even managed to train colleagues on configuring NSX ESG, and small client solutions are deployed without my involvement. An important note — our control plane is with unicast replication. Hypervisors are redundantly connected via two interfaces to different physical Juniper QFX5100 switches (assembled in a Virtual Chassis) and use a route-based policy based on the originating virtual port — for completeness.
Client solutions are very diverse: from Windows IIS, where all web server components are installed on one machine, to quite large configurations — for instance, load-balanced Apache web fronts + LB MariaDB in Galera + share servers synchronized with GlusterFS. Almost every server needs to be monitored separately, and not all components have public addresses — if you've faced this challenge and have a more elegant solution, I would appreciate your advice.
My monitoring solution consists of 'connecting' a firewall (Fortigate) to each internal client network (+SNAT and, of course, strict restrictions on the allowed traffic type) and monitoring the internal addresses — thus achieving a certain unification and simplification of monitoring. The monitoring itself takes place from the PRTG server cluster. The monitoring scheme is approximately as follows:
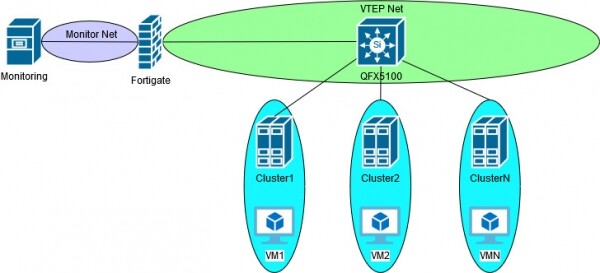
As long as we only operated with VLANs, everything was quite usual and worked like clockwork. After implementing NSX-V and VXLAN, we faced the question — can we continue monitoring in the old way? At the time of this question, the 'quickest' solution was to deploy NSX ESG and connect the VXLAN trunk interface to the VTEP network. Quick in quotes — because using the GUI to configure client networks, SNAT, and firewall rules might unify management in a single vSphere interface, but in my opinion, it is rather cumbersome and, among other things, limits the toolkit for troubleshooting. Those who have used NSX ESG as a replacement for a 'real' firewall will probably agree. Although, perhaps, such a solution would be more stable — after all, everything happens within the same vendor.
Another solution is to use NSX DLR in bridging mode between VLAN and VXLAN. Here, I think everything is clear — the benefit of using VXLAN is simply lost since in this case, you still have to stretch VLAN to the monitoring installation. By the way, while working on this solution, I encountered an issue where the DLR bridge did not send packets to the virtual machine that was on the same host. I know, I know — books and guides on NSX-V clearly state that a separate cluster must be allocated for NSX Edge, but that's in the books... Anyway, after a couple of months with support, we didn't solve the problem. In principle, I understood the logic of the action — the hypervisor kernel module responsible for VXLAN encapsulation was not engaged if the DLR and the monitored server were on the same host, since the traffic does not leave the host and logically should be connected to the VXLAN segment — encapsulation is not needed. We ended up with the virtual interface vdrPort with support, which logically combines uplinks and also performs bridging/encapsulation — it was there that a discrepancy in incoming traffic was noted, which I took on for processing in the current case. But as it was said, I did not fully pursue this case since I was reassigned to another project and, to be honest, the branch was originally a dead end, and I had no particular desire to develop it. If I’m not mistaken, the problem was observed in NSX versions 6.1.4 and 6.2.
And here — bingo! Fortinet announces native . And not just point-to-point or VXLAN-over-IPSec, not software bridging VLAN-VXLAN — all this began to be implemented back in version 5.4 (and is presented by other ), and the actual unicast control plane support. During the implementation of the solution, I encountered another problem—the monitored servers periodically 'disappeared' and reappeared in monitoring, even though the virtual machine was alive. The reason, it turned out, was that I forgot to enable Ping on the VXLAN interface. During the rebalancing of clusters, virtual machines moved, and the Ping was used to complete vMotion, designating the new ESXi host to which the machine was moved. My mistake, but this problem once again undermined my trust in the manufacturer's support—in this case, Fortinet. I won’t even mention that every case related to VXLAN starts with the question, 'Where do you have the VLAN-VXLAN settings in your configuration?' This time, I was advised to change the MTU—for Ping, which is 32 bytes. Then 'play around' with tcp-send-mss and tcp-receive-mss in the policy—for VXLAN, which is encapsulated in UDP. Phew, sorry—had to let it out. In general, I solved this problem on my own.
After successfully testing the traffic, it was decided to implement this solution. In production, it turned out that after a day or two, everything monitored through VXLAN gradually disconnected. Deactivating/activating the interface helped, but only temporarily. Knowing the sluggishness of the manufacturer's support, I took on the troubleshooting myself—after all, my company, my network—my responsibility.
Spoiler alert: the course of troubleshooting. Anyone tired of letters and boasting—feel free to skip to the post-analysis.
Troubleshooting ProgressThank you for continuing to read—let’s continue!
So, monitoring works for some time, then it disconnects by itself. This means that there are most likely no problems with the firewall policies. However, since I have encountered hanging system processes in Fortigate versions 5.6+, we will first check 'diagnose debug flow'—as expected, the traffic is allowed and leaves the interface, and, predictably, nothing comes back in response. This means we dig further down the stack. Unfortunately, I will have to hide the addresses even if they are RFC1918, but I hope to provide enough description for understanding. The server inside the VXLAN has the address x.x.x.15, the Fortigate interface x.x.x.254, and all other addresses belong to the VTEP network.
For the successful transmission of VXLAN encapsulated packets, correct information in several tables is required. For overlay, this includes ARP and OVSDB, and for underlay, it's ARP and CAM. In the case of Fortigate, VXLAN FDB is the OVSDB. Let's start there:
 fortigate (root) #diag sys vxlan fdb list vxlan-LS
mac=00:50:56:8f:3f:5a state=0x0002 flags=0x00 remote_ip=x.x.x.47 port=4789 vni=5008 ifindex=7
Everything is fairly straightforward here — the MAC address of the virtual machine must be on the VTEP with the address x.x.x.47. Looking at the contents and settings of the ESXI cluster, I find that the MAC of the virtual machine is correct, and the VTEP address is too. I check the CAM/ARP table on the Fortigate — once again, everything matches the settings of the ESXI host:
fortigate (root) #get sys arp | grep x.x.x.47
x.x.x.47 0 00:50:56:65:f6:2c dmz
The tables are correct, and traffic is going out — perhaps the problem is not with the Fortigate? I intentionally skipped analyzing traffic switching on the Juniper — logically, that should be the next troubleshooting step, but my network is simple — just one VLAN for the VTEP, and all components are connected directly. Additionally, I recall a case with a DLR bridge, VDR, and disappearing traffic — I go to sniff on the ESXI host and simultaneously create a case with VMware. Below, the MAC "97:6e" belongs to Fortigate, and vmnic1 is the interface with the VTEP at x.x.x.47; I'm sniffing in both directions: "—dir 2":
pktcap-uw --uplink vmnic1 --vni 5008 --mac 90:6c:ac:a9:97:6e --dir 2 -o /tmp/monitor.pcap
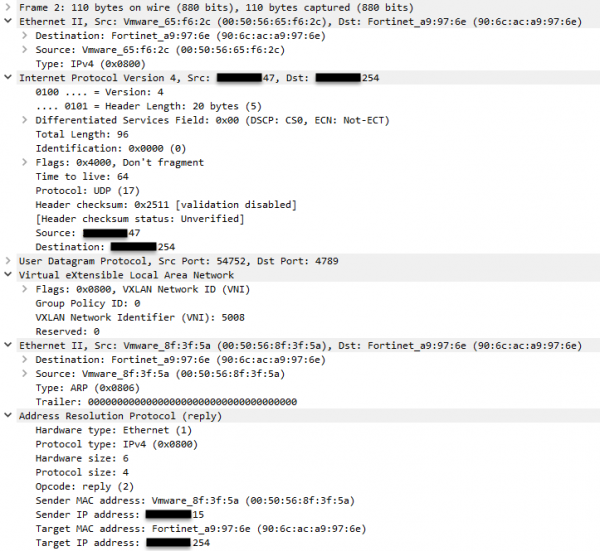
Progress — in the sniff, I see an ARP request and the incoming response. I only bring the ARP response, and everything is correct there. I should mention, however, that during this time, the monitoring server is pinging address y.y.y.15 — where is the ICMP traffic? I recall that I have two uplinks. One could argue and say that the virtual source port remains the same (my teaming policy), meaning the same uplink should be selected for the same vNIC, but since I'm on the host, checking the other uplink is not an issue:
pktcap-uw --uplink vmnic4 --vni 5008 --mac 90:6c:ac:a9:97:6e --dir 2 -o /tmp/monitor.pcap
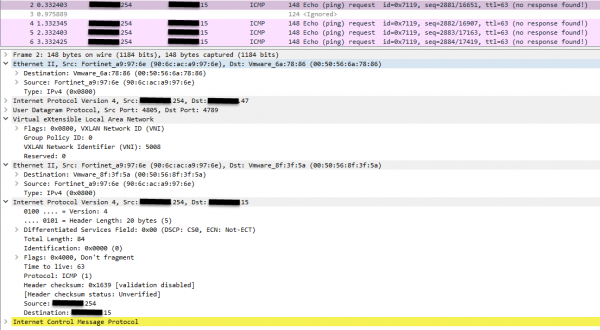
Requests come from Fortigate, but there is no response. So, the problem is not with Fortigate. Well, I think, it's the same issue with the disappearing traffic on the VDR again; it will take weeks to redirect the case to the right direction. A couple of days later, cooling down, and unwilling to accept the stalemate, I decided to dig up more sniff data for support to speed up the process. And then, 'by chance', my gaze falls on the Ethernet encapsulation underlay. The king is not real, and the MAC address of the VTEP does not match its IP. I reset it, sniff it, dig in — that's right and wrong. I'll provide the ARP table alongside to make it easier to compare. Note the first Ethernet encapsulation in the image above:
fortigate (root) #get sys arp | grep x.x.x.47
x.x.x.47 0 00:50:56:65:f6:2c dmz
fortigate (root) #get sys arp | grep x.x.x.42
x.x.x.42 0 00:50:56:6a:78:86 dmz
So, what do we have in the end — after migrating the virtual machine, Fortigate tries to send traffic to the VTEP from the (correct) VXLAN FDB but uses the wrong DST MAC, and the traffic is expectedly dropped by the receiving hypervisor interface. Moreover, in one out of four cases, this MAC belonged to the original hypervisor from which the machine migration began.
Yesterday I received a letter from Fortinet support — a bug 615586 has been opened for my case. I don't know whether to be happy or sad: on one hand, the problem is not with the settings, on the other hand, the fix will only come with the next firmware update, at best. My self-importance is also fueled by another bug that I discovered last month, though that time it was in the HTML5 GUI of vSphere. It's like having a local QA department for vendors...
I’ll venture to suggest the following:
1 — multicast control plane is unlikely to be affected by the described problem — since the MAC addresses of the VTEP are derived from the group IP address to which the interface is subscribed.
2 — the Fortigate issue is likely related to session offloading to the Network Processor (approximately analogous to CEF) — if each packet is passed through the CPU, the tables containing the correct — at least visually — information will be used. Supporting this assumption is the fact that toggling the interface or waiting some time, more than 5 minutes, helps close/open the issue.
3 — changing the teaming policy, for example to explicit failover, or implementing LAG will not resolve the problem, as there was observable 'sticking' of the original hypervisor's MAC in the encapsulated packets.
In light of this, I can share that I recently discovered , where one of the articles claimed that stateful firewalls and cacheable data transmission methods are crutches. Well, I’m not experienced enough in IT to assert such a thing, and I don’t automatically agree with all the claims made in blog articles. However, something tells me there is some truth in Ivan's words.
Thank you for your attention! I would be happy to answer questions and hear constructive criticism.
Source: habr.com
