

Or a bit of applied tetrisology.
Everything new is well forgotten old.
Epigraphs.

Formulation of the problem
It is necessary to periodically download the current PostgreSQL log file from the AWS cloud to the local Linux host. Not in real time, but, let's say, with a slight delay.
The log file update download period is 5 minutes.
The log file, in AWS, is rotated every hour.
Tools used
To upload the log file to the host, a bash script is used that calls the AWS API "».
Options:
- --db-instance-identifier: Instance name in AWS;
- --log-file-name: name of the currently generated log file
- --max-item: The total number of items returned in the output of the command.The chunk size of the downloaded file.
- --starting-token: Starting token token
In this particular case, the task of downloading logs arose in the course of work on
Yes, and simply - an interesting task for training and variety during working hours.
I assume that the problem has already been solved by virtue of routine. But a quick Google did not suggest solutions, and there was no particular desire to search in more depth. In any case, it's a good workout.
Formalization of the task
The final log file is a set of lines of variable length. Graphically, the log file can be represented like this:

Does it already remind you of something? What's with "tetris"? And here's what.
If we represent the possible options that arise when loading the next file graphically (for simplicity, in this case, let the lines have the same length), we get standard tetris figures:
1) The file is downloaded in its entirety and is final. The chunk size is larger than the final file size:

2) The file has a continuation. The chunk size is smaller than the final file size:

3) The file is a continuation of the previous file and has a continuation. The chunk size is less than the size of the rest of the final file:

4) The file is a continuation of the previous file and is final. The chunk size is larger than the size of the rest of the final file:

The task is to assemble a rectangle or play Tetris on a new level.

Problems that arise in the course of solving the problem
1) Glue a string of 2 portions

In general, there were no particular problems. A standard task from the initial programming course.
Optimal serving size
But this is a little more interesting.
Unfortunately, there is no way to use an offset after the start chunk label:
As you already know the option --starting-token is used to specify where to start paginating. This option takes String values which would mean that if you try to add an offset value in front of the Next Token string, the option will not be taken into consideration as an offset.
And so, you have to read in chunks-portions.
If you read in large portions, then the number of readings will be minimal, but the volume will be maximum.
If you read in small portions, then on the contrary, the number of readings will be maximum, but the volume will be minimal.
Therefore, in order to reduce traffic and for the overall beauty of the solution, I had to come up with some kind of solution, which, unfortunately, looks a bit like a crutch.
To illustrate, let's consider the process of downloading a log file in 2 greatly simplified versions. The number of readings in both cases depends on the portion size.
1) Load in small portions:
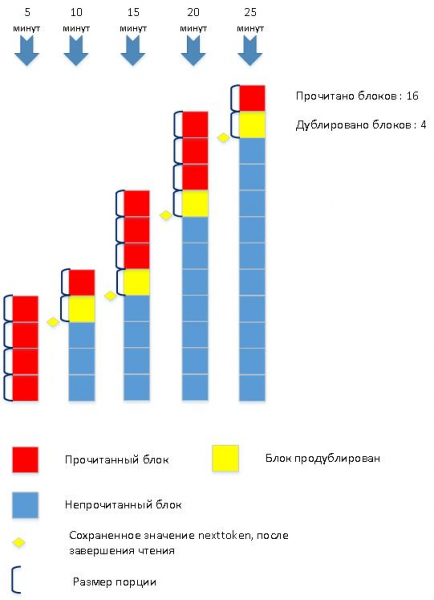
2) Load in large portions:
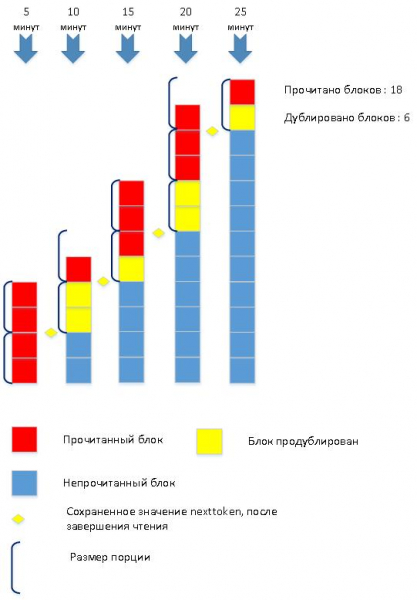
As usual, the optimal solution is in the middle.
The portion size is minimal, but in the process of reading, the size can be increased to reduce the number of readings.
It should be noted that the problem of selecting the optimal size of the read portion has not yet been completely solved and requires deeper study and analysis. Maybe a little later.
General description of the implementation
Used service tables
CREATE TABLE endpoint
(
id SERIAL ,
host text
);

TABLE database
(
id SERIAL ,
…
last_aws_log_time text ,
last_aws_nexttoken text ,
aws_max_item_size integer
);
last_aws_log_time — временная метка последнего загруженного лог-файла в формате YYYY-MM-DD-HH24.
last_aws_nexttoken — текстовая метка последней загруженной порции.
aws_max_item_size- эмпирическим путем, подобранный начальный размер порции.
Full text of the script
download_aws_piece.sh
#!/bin/bash
#########################################################
# download_aws_piece.sh
# downloan piece of log from AWS
# version HABR
 let min_item_size=1024
 let max_item_size=1048576
 let growth_factor=3
 let growth_counter=1
 let growth_counter_max=3

 echo $(date +%Y%m%d%H%M)':    download_aws_piece.sh:''STARTED'

 AWS_LOG_TIME=$1
 echo $(date +%Y%m%d%H%M)':    download_aws_piece.sh:AWS_LOG_TIME='$AWS_LOG_TIME

 database_id=$2
 echo $(date +%Y%m%d%H%M)':    download_aws_piece.sh:database_id='$database_id
 RESULT_FILE=$3

 endpoint=`psql -h MONITOR_ENDPOINT.rds.amazonaws.com -U USER -d MONITOR_DATABASE_DATABASE -A -t -c "select e.host from endpoint e join database d on e.id = d.endpoint_id where d.id = $database_id "`
 echo $(date +%Y%m%d%H%M)':    download_aws_piece.sh:endpoint='$endpoint

 db_instance=`echo $endpoint | awk -F"." '{print toupper($1)}'`

 echo $(date +%Y%m%d%H%M)':    download_aws_piece.sh:db_instance='$db_instance

 LOG_FILE=$RESULT_FILE'.tmp_log'
 TMP_FILE=$LOG_FILE'.tmp'
 TMP_MIDDLE=$LOG_FILE'.tmp_mid'
 TMP_MIDDLE2=$LOG_FILE'.tmp_mid2'

 current_aws_log_time=`psql -h MONITOR_ENDPOINT.rds.amazonaws.com -U USER -d MONITOR_DATABASE -A -t -c "select last_aws_log_time from database where id = $database_id "`

 echo $(date +%Y%m%d%H%M)':      download_aws_piece.sh:current_aws_log_time='$current_aws_log_time

  if [[ $current_aws_log_time != $AWS_LOG_TIME  ]];
  then
    is_new_log='1'
	if ! psql -h MONITOR_ENDPOINT.rds.amazonaws.com -U USER -d MONITOR_DATABASE -v ON_ERROR_STOP=1 -A -t -q -c "update database set last_aws_log_time = '$AWS_LOG_TIME' where id = $database_id "
	then
	  echo $(date +%Y%m%d%H%M)':    download_aws_piece.sh: FATAL_ERROR - update database set last_aws_log_time .'
	  exit 1
	fi
  else
    is_new_log='0'
  fi

  echo $(date +%Y%m%d%H%M)':    download_aws_piece.sh:is_new_log='$is_new_log

  let last_aws_max_item_size=`psql -h MONITOR_ENDPOINT.rds.amazonaws.com -U USER -d MONITOR_DATABASE -A -t -c "select aws_max_item_size from database where id = $database_id "`
  echo $(date +%Y%m%d%H%M)':    download_aws_piece.sh: last_aws_max_item_size='$last_aws_max_item_size

  let count=1
  if [[ $is_new_log == '1' ]];
  then
	echo $(date +%Y%m%d%H%M)':    download_aws_piece.sh: START DOWNLOADING OF NEW AWS LOG'
	if ! aws rds download-db-log-file-portion
		--max-items $last_aws_max_item_size
		--region REGION
		--db-instance-identifier  $db_instance
		--log-file-name error/postgresql.log.$AWS_LOG_TIME > $LOG_FILE
	then
		echo $(date +%Y%m%d%H%M)':    download_aws_piece.sh: FATAL_ERROR - Could not get log from AWS .'
		exit 2
	fi
  else
    next_token=`psql -h MONITOR_ENDPOINT.rds.amazonaws.com -U USER -d MONITOR_DATABASE -v ON_ERROR_STOP=1 -A -t -c "select last_aws_nexttoken from database where id = $database_id "`

	if [[ $next_token == '' ]];
	then
	  next_token='0'
	fi

	echo $(date +%Y%m%d%H%M)':    download_aws_piece.sh: CONTINUE DOWNLOADING OF AWS LOG'
	if ! aws rds download-db-log-file-portion
	    --max-items $last_aws_max_item_size
		--starting-token $next_token
		--region REGION
		--db-instance-identifier  $db_instance
		--log-file-name error/postgresql.log.$AWS_LOG_TIME > $LOG_FILE
	then
		echo $(date +%Y%m%d%H%M)':    download_aws_piece.sh: FATAL_ERROR - Could not get log from AWS .'
		exit 3
	fi

	line_count=`cat  $LOG_FILE | wc -l`
	let lines=$line_count-1

	tail -$lines $LOG_FILE > $TMP_MIDDLE
	mv -f $TMP_MIDDLE $LOG_FILE
  fi

  next_token_str=`cat $LOG_FILE | grep NEXTTOKEN`
  next_token=`echo $next_token_str | awk -F" " '{ print $2}' `

  grep -v NEXTTOKEN $LOG_FILE  > $TMP_FILE

  if [[ $next_token == '' ]];
  then
	  cp $TMP_FILE $RESULT_FILE

	  echo $(date +%Y%m%d%H%M)':    download_aws_piece.sh:  NEXTTOKEN NOT FOUND - FINISH '
	  rm $LOG_FILE
	  rm $TMP_FILE
	  rm $TMP_MIDDLE
          rm $TMP_MIDDLE2
	  exit 0
  else
	psql -h MONITOR_ENDPOINT.rds.amazonaws.com -U USER -d MONITOR_DATABASE -v ON_ERROR_STOP=1 -A -t -q -c "update database set last_aws_nexttoken = '$next_token' where id = $database_id "
  fi

  first_str=`tail -1 $TMP_FILE`

  line_count=`cat  $TMP_FILE | wc -l`
  let lines=$line_count-1

  head -$lines $TMP_FILE  > $RESULT_FILE

###############################################
# MAIN CIRCLE
  let count=2
  while [[ $next_token != '' ]];
  do
    echo $(date +%Y%m%d%H%M)':    download_aws_piece.sh: count='$count

	echo $(date +%Y%m%d%H%M)':    download_aws_piece.sh: START DOWNLOADING OF AWS LOG'
	if ! aws rds download-db-log-file-portion
             --max-items $last_aws_max_item_size
             --starting-token $next_token
             --region REGION
             --db-instance-identifier  $db_instance
             --log-file-name error/postgresql.log.$AWS_LOG_TIME > $LOG_FILE
	then
		echo $(date +%Y%m%d%H%M)':    download_aws_piece.sh: FATAL_ERROR - Could not get log from AWS .'
		exit 4
	fi

	next_token_str=`cat $LOG_FILE | grep NEXTTOKEN`
	next_token=`echo $next_token_str | awk -F" " '{ print $2}' `

	TMP_FILE=$LOG_FILE'.tmp'
	grep -v NEXTTOKEN $LOG_FILE  > $TMP_FILE

	last_str=`head -1 $TMP_FILE`

    if [[ $next_token == '' ]];
	then
	  concat_str=$first_str$last_str

	  echo $concat_str >> $RESULT_FILE

	  line_count=`cat  $TMP_FILE | wc -l`
	  let lines=$line_count-1

	  tail -$lines $TMP_FILE >> $RESULT_FILE

	  echo $(date +%Y%m%d%H%M)':    download_aws_piece.sh:  NEXTTOKEN NOT FOUND - FINISH '
	  rm $LOG_FILE
	  rm $TMP_FILE
	  rm $TMP_MIDDLE
          rm $TMP_MIDDLE2
	  exit 0
	fi

    if [[ $next_token != '' ]];
	then
		let growth_counter=$growth_counter+1
		if [[ $growth_counter -gt $growth_counter_max ]];
		then
			let last_aws_max_item_size=$last_aws_max_item_size*$growth_factor
			let growth_counter=1
		fi

		if [[ $last_aws_max_item_size -gt $max_item_size ]];
		then
			let last_aws_max_item_size=$max_item_size
		fi

	  psql -h MONITOR_ENDPOINT.rds.amazonaws.com -U USER -d MONITOR_DATABASE -A -t -q -c "update database set last_aws_nexttoken = '$next_token' where id = $database_id "

	  concat_str=$first_str$last_str

	  echo $concat_str >> $RESULT_FILE

	  line_count=`cat  $TMP_FILE | wc -l`
	  let lines=$line_count-1

	  #############################
	  #Get middle of file
	  head -$lines $TMP_FILE > $TMP_MIDDLE

	  line_count=`cat  $TMP_MIDDLE | wc -l`
	  let lines=$line_count-1
	  tail -$lines $TMP_MIDDLE > $TMP_MIDDLE2

	  cat $TMP_MIDDLE2 >> $RESULT_FILE

	  first_str=`tail -1 $TMP_FILE`
	fi

    let count=$count+1

  done
#
#################################################################

exit 0
Script fragments with some explanations:
Script input parameters:
- Timestamp of log file name in YYYY-MM-DD-HH24 format: AWS_LOG_TIME=$1
- Database ID: database_id=$2
- Collected log file name: RESULT_FILE=$3
Get the timestamp of the last uploaded log file:
current_aws_log_time=`psql -h MONITOR_ENDPOINT.rds.amazonaws.com -U USER -d MONITOR_DATABASE -A -t -c "select last_aws_log_time from database where id = $database_id "`If the timestamp of the last loaded log file does not match the input parameter, a new log file is loaded:
if [[ $current_aws_log_time != $AWS_LOG_TIME  ]];
  then
    is_new_log='1'
	if ! psql -h ENDPOINT.rds.amazonaws.com -U USER -d MONITOR_DATABASE -v ON_ERROR_STOP=1 -A -t -c "update database set last_aws_log_time = '$AWS_LOG_TIME' where id = $database_id "
	then
	  echo '***download_aws_piece.sh -FATAL_ERROR - update database set last_aws_log_time .'
	  exit 1
	fi
  else
    is_new_log='0'
  fi
We get the value of the nexttoken label from the loaded file:
  next_token_str=`cat $LOG_FILE | grep NEXTTOKEN`
  next_token=`echo $next_token_str | awk -F" " '{ print $2}' `
The sign of the end of the download is the empty value of nexttoken.
In a loop, we count portions of the file, along the way, concatenating lines and increasing the size of the portion:
Main Loop
# MAIN CIRCLE
  let count=2
  while [[ $next_token != '' ]];
  do
    echo $(date +%Y%m%d%H%M)':    download_aws_piece.sh: count='$count

	echo $(date +%Y%m%d%H%M)':    download_aws_piece.sh: START DOWNLOADING OF AWS LOG'
	if ! aws rds download-db-log-file-portion
     --max-items $last_aws_max_item_size
	 --starting-token $next_token
     --region REGION
     --db-instance-identifier  $db_instance
     --log-file-name error/postgresql.log.$AWS_LOG_TIME > $LOG_FILE
	then
		echo $(date +%Y%m%d%H%M)':    download_aws_piece.sh: FATAL_ERROR - Could not get log from AWS .'
		exit 4
	fi

	next_token_str=`cat $LOG_FILE | grep NEXTTOKEN`
	next_token=`echo $next_token_str | awk -F" " '{ print $2}' `

	TMP_FILE=$LOG_FILE'.tmp'
	grep -v NEXTTOKEN $LOG_FILE  > $TMP_FILE

	last_str=`head -1 $TMP_FILE`

    if [[ $next_token == '' ]];
	then
	  concat_str=$first_str$last_str

	  echo $concat_str >> $RESULT_FILE

	  line_count=`cat  $TMP_FILE | wc -l`
	  let lines=$line_count-1

	  tail -$lines $TMP_FILE >> $RESULT_FILE

	  echo $(date +%Y%m%d%H%M)':    download_aws_piece.sh:  NEXTTOKEN NOT FOUND - FINISH '
	  rm $LOG_FILE
	  rm $TMP_FILE
	  rm $TMP_MIDDLE
         rm $TMP_MIDDLE2
	  exit 0
	fi

    if [[ $next_token != '' ]];
	then
		let growth_counter=$growth_counter+1
		if [[ $growth_counter -gt $growth_counter_max ]];
		then
			let last_aws_max_item_size=$last_aws_max_item_size*$growth_factor
			let growth_counter=1
		fi

		if [[ $last_aws_max_item_size -gt $max_item_size ]];
		then
			let last_aws_max_item_size=$max_item_size
		fi

	  psql -h MONITOR_ENDPOINT.rds.amazonaws.com -U USER -d MONITOR_DATABASE -A -t -q -c "update database set last_aws_nexttoken = '$next_token' where id = $database_id "

	  concat_str=$first_str$last_str

	  echo $concat_str >> $RESULT_FILE

	  line_count=`cat  $TMP_FILE | wc -l`
	  let lines=$line_count-1

	  #############################
	  #Get middle of file
	  head -$lines $TMP_FILE > $TMP_MIDDLE

	  line_count=`cat  $TMP_MIDDLE | wc -l`
	  let lines=$line_count-1
	  tail -$lines $TMP_MIDDLE > $TMP_MIDDLE2

	  cat $TMP_MIDDLE2 >> $RESULT_FILE

	  first_str=`tail -1 $TMP_FILE`
	fi

    let count=$count+1

  done
What next?
So, the first intermediate task - "download the log file from the cloud" is solved. What to do with the downloaded log?
First you need to parse the log file and extract the actual requests from it.
The task is not very difficult. The simplest bash-script does just fine.
upload_log_query.sh
#!/bin/bash
#########################################################
# upload_log_query.sh
# Upload table table from dowloaded aws file
# version HABR
###########################################################
echo 'TIMESTAMP:'$(date +%c)' Upload log_query table '
source_file=$1
echo 'source_file='$source_file
database_id=$2
echo 'database_id='$database_id

beginer=' '
first_line='1'
let "line_count=0"
sql_line=' '
sql_flag=' '
space=' '
cat $source_file | while read line
do
  line="$space$line"

  if [[ $first_line == "1" ]]; then
    beginer=`echo $line | awk -F" " '{ print $1}' `
    first_line='0'
  fi

  current_beginer=`echo $line | awk -F" " '{ print $1}' `

  if [[ $current_beginer == $beginer ]]; then
    if [[ $sql_flag == '1' ]]; then
     sql_flag='0'
     log_date=`echo $sql_line | awk -F" " '{ print $1}' `
     log_time=`echo $sql_line | awk -F" " '{ print $2}' `
     duration=`echo $sql_line | awk -F" " '{ print $5}' `

     #replace ' to ''
     sql_modline=`echo "$sql_line" | sed 's/'''/''''''/g'`
     sql_line=' '

	 ################
	 #PROCESSING OF THE SQL-SELECT IS HERE
     if ! psql -h ENDPOINT.rds.amazonaws.com -U USER -d DATABASE -v ON_ERROR_STOP=1 -A -t -c "select log_query('$ip_port',$database_id , '$log_date' , '$log_time' , '$duration' , '$sql_modline' )"
     then
        echo 'FATAL_ERROR - log_query '
        exit 1
     fi
	 ################

    fi #if [[ $sql_flag == '1' ]]; then

    let "line_count=line_count+1"

    check=`echo $line | awk -F" " '{ print $8}' `
    check_sql=${check^^}

    #echo 'check_sql='$check_sql

    if [[ $check_sql == 'SELECT' ]]; then
     sql_flag='1'
     sql_line="$sql_line$line"
	 ip_port=`echo $sql_line | awk -F":" '{ print $4}' `
    fi
  else

    if [[ $sql_flag == '1' ]]; then
      sql_line="$sql_line$line"
    fi

  fi #if [[ $current_beginer == $beginer ]]; then

done
Now you can work with the query extracted from the log file.
And there are several useful possibilities.
Parsed queries must be stored somewhere. For this, a service table is used. log_query
CREATE TABLE log_query
(
   id SERIAL ,
   queryid bigint ,
   query_md5hash text not null ,
   database_id integer not null ,
   timepoint timestamp without time zone not null,
   duration double precision not null ,
   query text not null ,
   explained_plan text[],
   plan_md5hash text  ,
   explained_plan_wo_costs text[],
   plan_hash_value text  ,
   baseline_id integer ,
   ip text ,
   port text
);
ALTER TABLE log_query ADD PRIMARY KEY (id);
ALTER TABLE log_query ADD CONSTRAINT queryid_timepoint_unique_key UNIQUE (queryid, timepoint );
ALTER TABLE log_query ADD CONSTRAINT query_md5hash_timepoint_unique_key UNIQUE (query_md5hash, timepoint );

CREATE INDEX log_query_timepoint_idx ON log_query (timepoint);
CREATE INDEX log_query_queryid_idx ON log_query (queryid);
ALTER TABLE log_query ADD CONSTRAINT database_id_fk FOREIGN KEY (database_id) REFERENCES database (id) ON DELETE CASCADE ;
The parsed request is processed in plpgsql functions "log_query».
log_query.sql
--log_query.sql
--verison HABR
CREATE OR REPLACE FUNCTION log_query( ip_port text ,log_database_id integer , log_date text , log_time text , duration text , sql_line text   ) RETURNS boolean AS $$
DECLARE
  result boolean ;
  log_timepoint timestamp without time zone ;
  log_duration double precision ;
  pos integer ;
  log_query text ;
  activity_string text ;
  log_md5hash text ;
  log_explain_plan text[] ;

  log_planhash text ;
  log_plan_wo_costs text[] ;

  database_rec record ;

  pg_stat_query text ;
  test_log_query text ;
  log_query_rec record;
  found_flag boolean;

  pg_stat_history_rec record ;
  port_start integer ;
  port_end integer ;
  client_ip text ;
  client_port text ;
  log_queryid bigint ;
  log_query_text text ;
  pg_stat_query_text text ;
BEGIN
  result = TRUE ;

  RAISE NOTICE '***log_query';

  port_start = position('(' in ip_port);
  port_end = position(')' in ip_port);
  client_ip = substring( ip_port from 1 for port_start-1 );
  client_port = substring( ip_port from port_start+1 for port_end-port_start-1 );

  SELECT e.host , d.name , d.owner_pwd
  INTO database_rec
  FROM database d JOIN endpoint e ON e.id = d.endpoint_id
  WHERE d.id = log_database_id ;

  log_timepoint = to_timestamp(log_date||' '||log_time,'YYYY-MM-DD HH24-MI-SS');
  log_duration = duration:: double precision;


  pos = position ('SELECT' in UPPER(sql_line) );
  log_query = substring( sql_line from pos for LENGTH(sql_line));
  log_query = regexp_replace(log_query,' +',' ','g');
  log_query = regexp_replace(log_query,';+','','g');
  log_query = trim(trailing ' ' from log_query);


  log_md5hash = md5( log_query::text );

  --Explain execution plan--
  EXECUTE 'SELECT dblink_connect(''LINK1'',''host='||database_rec.host||' dbname='||database_rec.name||' user=DATABASE password='||database_rec.owner_pwd||' '')';

  log_explain_plan = ARRAY ( SELECT * FROM dblink('LINK1', 'EXPLAIN '||log_query ) AS t (plan text) );
  log_plan_wo_costs = ARRAY ( SELECT * FROM dblink('LINK1', 'EXPLAIN ( COSTS FALSE ) '||log_query ) AS t (plan text) );

  PERFORM dblink_disconnect('LINK1');
  --------------------------
  BEGIN
	INSERT INTO log_query
	(
		query_md5hash ,
		database_id ,
		timepoint ,
		duration ,
		query ,
		explained_plan ,
		plan_md5hash ,
		explained_plan_wo_costs ,
		plan_hash_value ,
		ip ,
		port
	)
	VALUES
	(
		log_md5hash ,
		log_database_id ,
		log_timepoint ,
		log_duration ,
		log_query ,
		log_explain_plan ,
		md5(log_explain_plan::text) ,
		log_plan_wo_costs ,
		md5(log_plan_wo_costs::text),
		client_ip ,
		client_port
	);
	activity_string = 	'New query has logged '||
						' database_id = '|| log_database_id ||
						' query_md5hash='||log_md5hash||
						' , timepoint = '||to_char(log_timepoint,'YYYYMMDD HH24:MI:SS');

	RAISE NOTICE '%',activity_string;

	PERFORM pg_log( log_database_id , 'log_query' , activity_string);

	EXCEPTION
	  WHEN unique_violation THEN
		RAISE NOTICE '*** unique_violation *** query already has logged';
	END;

	SELECT 	queryid
	INTO   	log_queryid
	FROM 	log_query
	WHERE 	query_md5hash = log_md5hash AND
			timepoint = log_timepoint;

	IF log_queryid IS NOT NULL
	THEN
	  RAISE NOTICE 'log_query with query_md5hash = % and timepoint = % has already has a QUERYID = %',log_md5hash,log_timepoint , log_queryid ;
	  RETURN result;
	END IF;

	------------------------------------------------
	RAISE NOTICE 'Update queryid';

	SELECT *
	INTO log_query_rec
	FROM log_query
	WHERE query_md5hash = log_md5hash AND timepoint = log_timepoint ;

	log_query_rec.query=regexp_replace(log_query_rec.query,';+','','g');

	FOR pg_stat_history_rec IN
	 SELECT
         queryid ,
	  query
	 FROM
         pg_stat_db_queries
     WHERE
      database_id = log_database_id AND
       queryid is not null
	LOOP
	  pg_stat_query = pg_stat_history_rec.query ;
	  pg_stat_query=regexp_replace(pg_stat_query,'n+',' ','g');
	  pg_stat_query=regexp_replace(pg_stat_query,'t+',' ','g');
	  pg_stat_query=regexp_replace(pg_stat_query,' +',' ','g');
	  pg_stat_query=regexp_replace(pg_stat_query,'$.','%','g');

	  log_query_text = trim(trailing ' ' from log_query_rec.query);
	  pg_stat_query_text = pg_stat_query;


	  --SELECT log_query_rec.query like pg_stat_query INTO found_flag ;
	  IF (log_query_text LIKE pg_stat_query_text) THEN
		found_flag = TRUE ;
	  ELSE
		found_flag = FALSE ;
	  END IF;


	  IF found_flag THEN

		UPDATE log_query SET queryid = pg_stat_history_rec.queryid WHERE query_md5hash = log_md5hash AND timepoint = log_timepoint ;
		activity_string = 	' updated queryid = '||pg_stat_history_rec.queryid||
		                    ' for log_query with id = '||log_query_rec.id
		   				    ;
	    RAISE NOTICE '%',activity_string;
		EXIT ;
	  END IF ;

	END LOOP ;

  RETURN result ;
END
$$ LANGUAGE plpgsql;
When processing, the service table is used pg_stat_db_queriesA that contains a snapshot of the current queries from the table pg_stat_history (Table usage is described here − )
TABLE pg_stat_db_queries
(
   database_id integer,
   queryid bigint ,
   query text ,
   max_time double precision
);
TABLE pg_stat_history
(
…
database_id integer ,
…
queryid bigint ,
…
max_time double precision	 ,
…
);
The function allows you to implement a number of useful features for processing requests from a log file. Namely:
Opportunity #1 - Query Execution History
Very useful for starting a performance incident. First, get acquainted with the history - and when did the slowdown begin?
Then, according to the classics, look for external causes. It may just be that the database load has increased dramatically and the specific request has nothing to do with it.
Add new entry to log_query table
  port_start = position('(' in ip_port);
  port_end = position(')' in ip_port);
  client_ip = substring( ip_port from 1 for port_start-1 );
  client_port = substring( ip_port from port_start+1 for port_end-port_start-1 );

  SELECT e.host , d.name , d.owner_pwd
  INTO database_rec
  FROM database d JOIN endpoint e ON e.id = d.endpoint_id
  WHERE d.id = log_database_id ;

  log_timepoint = to_timestamp(log_date||' '||log_time,'YYYY-MM-DD HH24-MI-SS');
  log_duration = to_number(duration,'99999999999999999999D9999999999');


  pos = position ('SELECT' in UPPER(sql_line) );
  log_query = substring( sql_line from pos for LENGTH(sql_line));
  log_query = regexp_replace(log_query,' +',' ','g');
  log_query = regexp_replace(log_query,';+','','g');
  log_query = trim(trailing ' ' from log_query);

  RAISE NOTICE 'log_query=%',log_query ;

  log_md5hash = md5( log_query::text );

  --Explain execution plan--
  EXECUTE 'SELECT dblink_connect(''LINK1'',''host='||database_rec.host||' dbname='||database_rec.name||' user=DATABASE password='||database_rec.owner_pwd||' '')';

  log_explain_plan = ARRAY ( SELECT * FROM dblink('LINK1', 'EXPLAIN '||log_query ) AS t (plan text) );
  log_plan_wo_costs = ARRAY ( SELECT * FROM dblink('LINK1', 'EXPLAIN ( COSTS FALSE ) '||log_query ) AS t (plan text) );

  PERFORM dblink_disconnect('LINK1');
  --------------------------
  BEGIN
	INSERT INTO log_query
	(
		query_md5hash ,
		database_id ,
		timepoint ,
		duration ,
		query ,
		explained_plan ,
		plan_md5hash ,
		explained_plan_wo_costs ,
		plan_hash_value ,
		ip ,
		port
	)
	VALUES
	(
		log_md5hash ,
		log_database_id ,
		log_timepoint ,
		log_duration ,
		log_query ,
		log_explain_plan ,
		md5(log_explain_plan::text) ,
		log_plan_wo_costs ,
		md5(log_plan_wo_costs::text),
		client_ip ,
		client_port
	);
Feature #2 - Save Query Execution Plans
At this point, an objection-clarification-comment may arise: “But there is already autoexplain". Yes, it is, but what's the point if the execution plan is stored in the same log file and in order to save it for further analysis, you have to parse the log file?
However, I needed:
first: store the execution plan in the service table of the monitoring database;
secondly: to be able to compare execution plans with each other in order to immediately see that the query execution plan has changed.
A request with specific execution parameters is available. Getting and storing its execution plan using EXPLAIN is an elementary task.
Moreover, using the EXPLAIN (COSTS FALSE) expression, you can get the framework of the plan, which will be used to obtain the hash value of the plan, which will help in the subsequent analysis of the change history of the execution plan.
Get an execution plan template
  --Explain execution plan--
  EXECUTE 'SELECT dblink_connect(''LINK1'',''host='||database_rec.host||' dbname='||database_rec.name||' user=DATABASE password='||database_rec.owner_pwd||' '')';

  log_explain_plan = ARRAY ( SELECT * FROM dblink('LINK1', 'EXPLAIN '||log_query ) AS t (plan text) );
  log_plan_wo_costs = ARRAY ( SELECT * FROM dblink('LINK1', 'EXPLAIN ( COSTS FALSE ) '||log_query ) AS t (plan text) );

  PERFORM dblink_disconnect('LINK1');
Opportunity #3 - Using the Query Log for Monitoring
Since the performance metrics are configured not for the request text, but for its ID, you need to associate requests from the log file with requests for which performance metrics are configured.
Well, at least in order to have the exact time of occurrence of a performance incident.
Thus, when a performance incident occurs for a request ID, there will be a link to a specific request with specific parameter values and the exact execution time and duration of the request. Get the given information using only the view pg_stat_statements - it is forbidden.
Find the queryid of the query and update the entry in the log_query table
SELECT *
	INTO log_query_rec
	FROM log_query
	WHERE query_md5hash = log_md5hash AND timepoint = log_timepoint ;

	log_query_rec.query=regexp_replace(log_query_rec.query,';+','','g');

	FOR pg_stat_history_rec IN
	 SELECT
      queryid ,
	  query
	 FROM
       pg_stat_db_queries
     WHERE
	   database_id = log_database_id AND
       queryid is not null
	LOOP
	  pg_stat_query = pg_stat_history_rec.query ;
	  pg_stat_query=regexp_replace(pg_stat_query,'n+',' ','g');
	  pg_stat_query=regexp_replace(pg_stat_query,'t+',' ','g');
	  pg_stat_query=regexp_replace(pg_stat_query,' +',' ','g');
	  pg_stat_query=regexp_replace(pg_stat_query,'$.','%','g');

	  log_query_text = trim(trailing ' ' from log_query_rec.query);
	  pg_stat_query_text = pg_stat_query;

	  --SELECT log_query_rec.query like pg_stat_query INTO found_flag ;
	  IF (log_query_text LIKE pg_stat_query_text) THEN
		found_flag = TRUE ;
	  ELSE
		found_flag = FALSE ;
	  END IF;


	  IF found_flag THEN

		UPDATE log_query SET queryid = pg_stat_history_rec.queryid WHERE query_md5hash = log_md5hash AND timepoint = log_timepoint ;
		activity_string = 	' updated queryid = '||pg_stat_history_rec.queryid||
		                    ' for log_query with id = '||log_query_rec.id
		   				    ;

	    RAISE NOTICE '%',activity_string;
		EXIT ;
	  END IF ;

	END LOOP ;
Afterword
As a result, the described method has found its application in , allowing you to have more information for analysis when resolving emerging query performance incidents.
Although, of course, in my personal opinion, it will still be necessary to work on the algorithm for selecting and changing the size of the downloaded portion. The problem has not yet been solved in the general case. It will probably be interesting.
But that's a completely different story...
Source: habr.com
