

Zabbix is a monitoring system. Like any other system, it faces three main issues common to all monitoring systems: data collection and processing, historical data storage, and its cleanup.
The stages of data acquisition, processing, and recording take time. A little, but for a large system, this can lead to significant delays. The storage problem is about data accessibility. It is used for reports, checks, and triggers. Delays in data access also affect performance. As databases grow, outdated data must be removed. Deletion is a heavy operation that also consumes some resources.

The issues of delays in collection and storage in Zabbix are resolved by caching: several types of caches, database caching. For the third issue, caching is not suitable, so Zabbix implemented TimescaleDB. This will be explained by Andrey Gushchin — a technical support engineer . Andrey has been in Zabbix support for over 6 years and directly deals with performance.
How does TimescaleDB work, what performance can it provide compared to regular PostgreSQL? What role does Zabbix play for TimescaleDB? How to set it up from scratch and how to migrate from PostgreSQL, and which configurations perform better? All this will be discussed below.

Performance Challenges
Every monitoring system faces certain performance challenges. I will talk about three of them: data collection and processing, storage, and historical data cleanup.
Fast data collection and processing. A good monitoring system should quickly gather all data and process it according to trigger expressions — based on its criteria. After processing, the system should also swiftly save this data in the database for later use.
Historical data storage. A good monitoring system must store history in the database and provide easy access to metrics. The history is needed for use in reports, graphs, triggers, thresholds, and calculated data elements for notifications.
Historical data cleanup. Sometimes, a day comes when you don't need to retain metrics. Why keep data collected from five years ago, or even a month or two? Some nodes are removed, some hosts or metrics are no longer necessary because they are outdated and have stopped collecting. A good monitoring system should keep historical data and periodically delete it to prevent the database from growing too large.
Clearing outdated data is a critical issue that significantly affects database performance.
Caching in Zabbix
In Zabbix, the first and second calls are resolved through caching. RAM is used for collecting and processing data. For storage, historical data resides in triggers, graphs, and calculated data items. On the database side, there is specific caching for main queries, such as graphs.
Caching on the Zabbix server side includes:
- ConfigurationCache;
- ValueCache;
- HistoryCache;
- TrendsCache.
Let's examine them in detail.
ConfigurationCache
This is the main cache where we store metrics, hosts, data items, triggers—everything needed for PreProcessing and data collection.
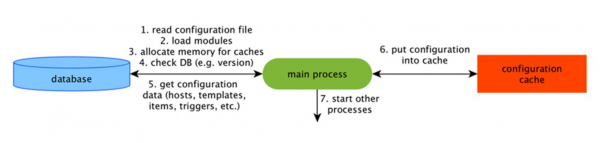
All of this is stored in ConfigurationCache to avoid unnecessary database queries. After the server starts, we refresh this cache, create, and periodically update configurations.
Data Collection
The schema is quite large, but the essential part is collectors. These are various 'pollers'—collection processes. They are responsible for different types of collection: gathering data via SNMP, IPMI, and passing it all to PreProcessing.
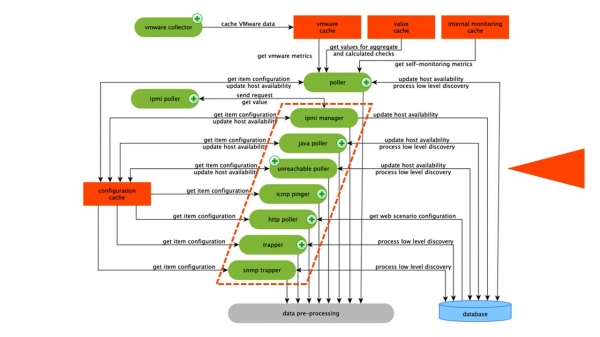 The collectors are outlined with an orange line.
In Zabbix, there are calculated aggregated data items needed to aggregate checks. If we have them, we fetch data directly from ValueCache.
PreProcessing HistoryCache
All collectors use ConfigurationCache to receive assignments. They then pass these to PreProcessing.
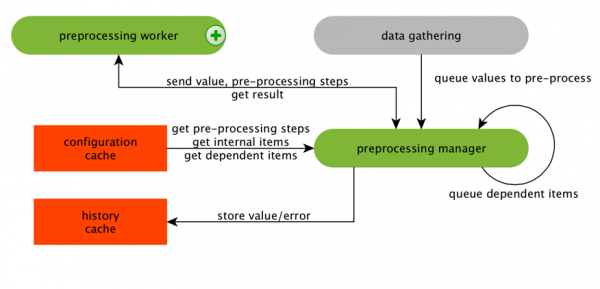
PreProcessing utilizes ConfigurationCache to obtain PreProcessing steps. It processes this data in various ways.
After processing the data via PreProcessing, we save it in HistoryCache for further handling. This concludes data collection, and we move on to the main process in Zabbix— history syncer, as this is a monolithic architecture.
Note: PreProcessing is quite a heavy operation. From version 4.2, it has been moved to the proxy. If you have a very large Zabbix with many data items and collection frequency, this greatly eases the load.
ValueCache, history & trends cache
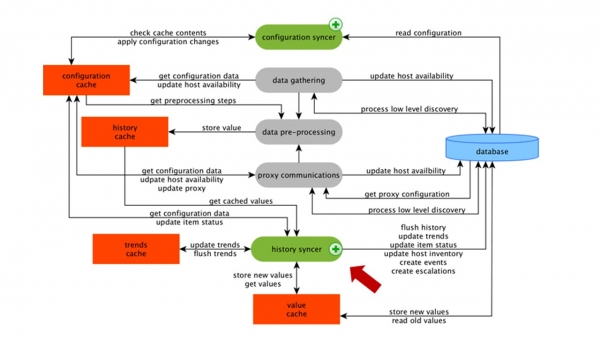
The history syncer is the main process that atomically processes each data element, meaning each value.
The history syncer takes values from the HistoryCache and checks the Configuration for triggers for computations. If they exist, it computes them.
The history syncer creates an event, escalation to generate alerts if required by configuration, and records. If there are triggers for subsequent processing, it remembers this value in ValueCache to avoid querying the history table. This way, ValueCache gets filled with the data necessary for trigger computations.
The history syncer writes all data to the database, and the database writes it to disk. The processing ends here.
Caching in the database
On the database side, there are various caches when you want to view graphs or reports on events:
Innodb_buffer_poolon the MySQL side;shared_bufferson the PostgreSQL side;effective_cache_sizeon the Oracle side;shared_poolon the DB2 side.
There are many other caches, but these are the main ones for all databases. They keep frequently needed data in memory for queries. Each has its own technology for this.
Database performance is critically important
The Zabbix server constantly collects and records data. When restarted, it also reads from history to fill the ValueCache. It uses the Zabbix API, which is built on the web interface. The Zabbix API accesses the database and retrieves the necessary data for graphs, reports, event lists, and recent issues.
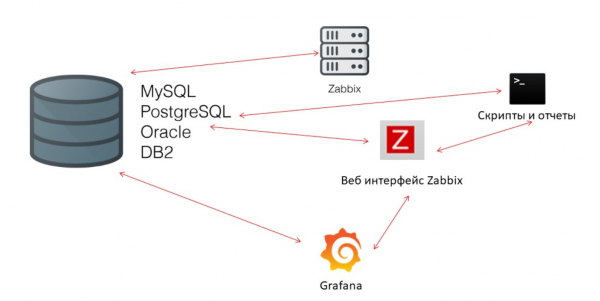
For visualization — Grafana. Among our users, this is a popular solution. It can directly send requests through the Zabbix API and to the database, creating a certain concurrency for data retrieval. Therefore, a more refined and proper database setup is needed to ensure quick result delivery and testing.
Housekeeper
The third performance call in Zabbix is clearing history with the Housekeeper. It adheres to all settings — the data items specify how long to keep the changes' dynamics (trends) in days.
We compute TrendsCache on the fly. When data comes in, we aggregate it for one hour and write it to tables for tracking changes in trends.
The Housekeeper runs and deletes information from the database using ordinary "selects". This is not always efficient, which can be understood from the performance graphs of internal processes.
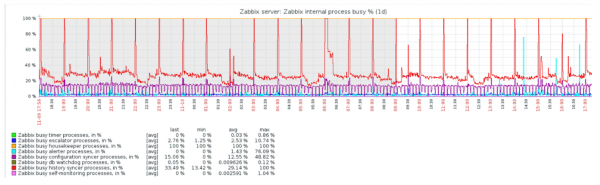
The red graph shows that the History syncer is constantly busy. The orange graph at the top represents the Housekeeper, which is continuously running. It waits for the database to delete all rows that it has specified.
When should the Housekeeper be disabled? For example, if there's an 'Item ID' and you need to delete the last 5,000 rows over a certain period. Of course, this is done by indexes. But usually, the dataset is very large, and the database still reads from disk and loads into cache. This is always a very expensive operation for the database and can lead to performance issues depending on the size of the database.
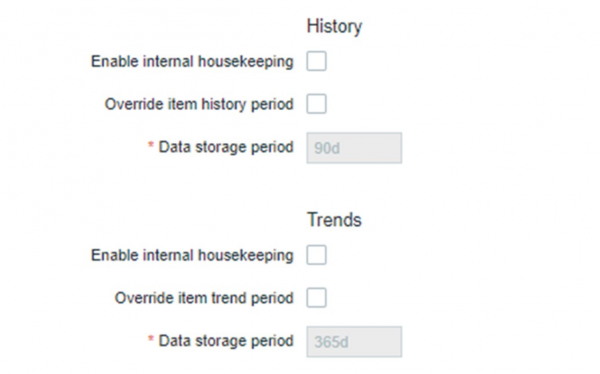
The Housekeeper can simply be disabled. In the web interface, there's a setting in 'Administration general' for the Housekeeper. We disable the internal Housekeeping for the internal trend history, and it no longer manages it.
After disabling the Housekeeper, the graphs aligned—what problems may arise in this case and what can help resolve the third performance call?
Partitioning
Typically, partitioning is set up in various ways on each relational database, as I’ve listed. Each has its own technology, but they are similar overall. Creating a new partition often leads to certain problems.
Generally, partitions are configured based on the 'setup'—the amount of data created in one day. Usually, Partitioning is set for one day, at a minimum. For trends, a new partition is set for one month.
Values may vary in the case of a very large 'setup'. If a small 'setup' means up to 5,000 nvps (new values per second), medium is from 5,000 to 25,000, and large is above 25,000 nvps. These are large and very large installations that require careful database tuning.
In very large installations, a one-day slice may not be optimal. I've seen partitions in MySQL that are 40 GB and larger per day. This is a very large amount of data that can lead to issues, and it needs to be reduced.
What does Partitioning provide?
Table PartitioningIt often results in separate files on disk. The query planner optimally selects one partition. Typically, partitioning is used by range—this holds true for Zabbix as well. We use 'timestamp'—time since the epoch. For us, these are regular numbers. You set the start and end of the day—that becomes a partition.
Fast deletion — DELETEA single file/subtable is selected, not a set of rows for deletion.
Significantly speeds up data retrieval. SELECT — it uses one or more partitions rather than the entire table. When you request data from two days ago, it is retrieved from the database faster because it needs to load into the cache and return only one file, not a large table.
Often, many databases also speed up INSERT — inserts into the child table.
TimescaleDB
For version 4.2, we focused on TimescaleDB. This extension for PostgreSQL has a native interface. The extension works efficiently with time series data while retaining the advantages of relational databases. TimescaleDB also automatically partitions.
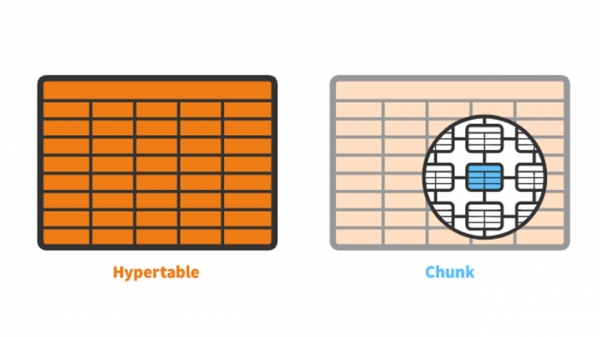
In TimescaleDB, there is a concept of hypertable (hypertable), which you create. It contains chunks — partitions. Chunks are automatically managed segments of the hypertable that do not affect other segments. Each chunk has its own time range.
TimescaleDB vs PostgreSQL
TimescaleDB operates really efficiently. The producers of the extension claim they use a more correct query processing algorithm, particularly for inserts. As dataset insert sizes grow, the algorithm maintains consistent performance.
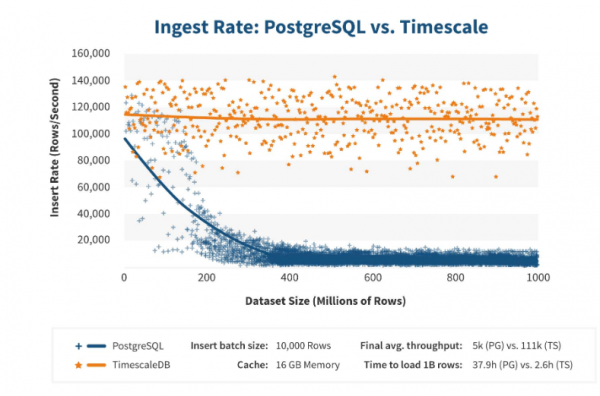
After 200 million rows, PostgreSQL typically starts to lag significantly and loses performance to 0. TimescaleDB allows efficient ‘inserts’ regardless of the volume of data.
Installation
Installing TimescaleDB is quite simple for any packages. The installation is described in detail — it relies on the official PostgreSQL packages. TimescaleDB can also be built and compiled manually.
For the Zabbix database, we simply activate the extension:
echo "CREATE EXTENSION IF NOT EXISTS timescaledb CASCADE;" | sudo -u postgres psql zabbix You activate the extension and create it for the Zabbix database. The final step is to create the hypertable.
Migrating history tables to TimescaleDB
There is a special function for this create_hypertable:
SELECT create_hypertable('history', 'clock', chunk_time_interval => 86400, migrate_data => true); SELECT create_hypertable('history_unit', 'clock', chunk_time_interval => 86400, migrate_data => true); SELECT create_hypertable('history_log', 'clock', chunk_time_interval => 86400, migrate_data => true); SELECT create_hypertable('history_text', 'clock', chunk_time_interval => 86400, migrate_data => true); SELECT create_hypertable('history_str', 'clock', chunk_time_interval => 86400, migrate_data => true); SELECT create_hypertable('trends', 'clock', chunk_time_interval => 86400, migrate_data => true); SELECT create_hypertable('trends_unit', 'clock', chunk_time_interval => 86400, migrate_data => true); UPDATE config SET db_extension='timescaledb', hk_history_global=1, hk_trends_global=1 The function has three parameters. The first is the table in the database, for which you need to create a hypertable. The second is field, based on which you need to create chunk_time_interval — the chunk time interval for partitions that need to be used. In my case, the interval is one day — 86,400.
The third parameter is migrate_data. If you set true, all current data is migrated into the pre-created chunks. I personally used migrate_data. I had about 1 TB, which took over an hour. In some cases during testing, I deleted unnecessary historical data of character types to avoid transferring them.
The final step is UPDATE: in db_extension we set timescaledb, so that the database understands that this extension exists. Zabbix activates it and correctly uses the syntax and queries to the database — the features that are necessary for TimescaleDB.
Hardware Configuration
I used two servers. The first is a VMware machine. It's quite small: 20 Intel® Xeon® CPU E5-2630 v 4 @ 2.20GHz processors, 16 GB of RAM, and a 200 GB SSD.
I installed PostgreSQL 10.8 on it with Debian OS 10.8-1.pgdg90+1 and xfs file system. Everything was minimally configured to use this database specifically, except for what will be used by Zabbix itself.
On this same machine, there was a Zabbix server, PostgreSQL, and load agents. I had 50 active agents that used LoadableModule, to generate various results quickly: numbers, strings. I filled the database with a large amount of data.
Initially, the configuration contained 5,000 data items for each host. Almost every item contained a trigger, making it similar to real installations. In some cases, there were more than one trigger. Each network node had 3,000-7,000 triggers..
The update interval for data items is 4-7 seconds.I adjusted the load by using not only 50 agents but also adding more. Additionally, I dynamically adjusted the load through data elements and reduced the update interval to 4 seconds.
PostgreSQL. 35,000 nvps
My first run on this hardware was with pure PostgreSQL — 35,000 values per second. As you can see, data insertion takes fractions of a second — everything is good and fast. The only downside is that the 200 GB SSD fills up quickly.
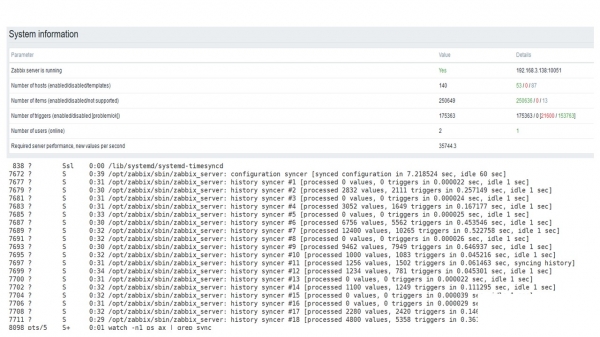
This is the standard Zabbix performance dashboard for servers.
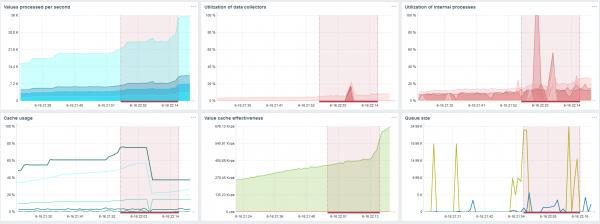
The first blue graph shows the number of values per second. The second graph on the right displays the load of the collector processes. The third shows the load of internal collection processes: history syncers and Housekeeper, which ran for a sufficient amount of time here.
The fourth graph shows the usage of HistoryCache. This acts as a buffer before inserting into the database. The green fifth graph shows the utilization of ValueCache, indicating how many hits the ValueCache had for triggers — this is several thousand values per second.
PostgreSQL. 50,000 nvps
I then increased the load to 50,000 values per second on the same hardware.
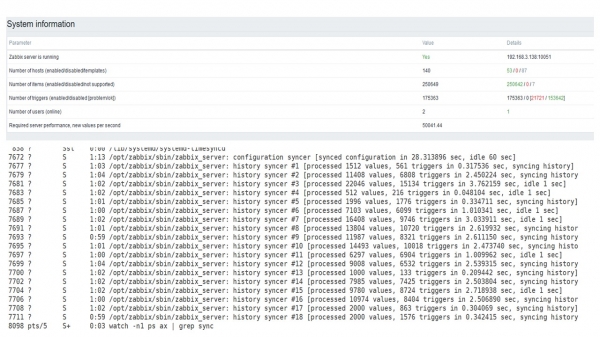
During loading with Housekeeper, inserting 10,000 values took 2-3 seconds.
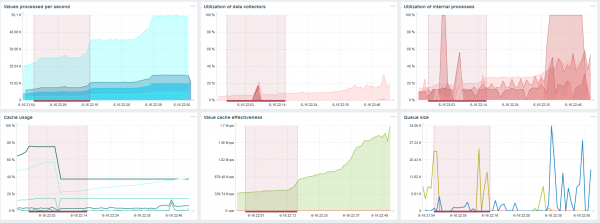
Housekeeper is already starting to interfere with the operation.
The third graph indicates that overall, the load from the collectors and history syncers is still around 60%. The fourth graph shows that HistoryCache is starting to fill up quite actively during the operation of Housekeeper. It filled up to 20% — approximately 0.5 GB.
PostgreSQL. 80,000 nvps
Next, I increased the load to 80,000 values per second. This amounts to about 400,000 data elements and 280,000 triggers.
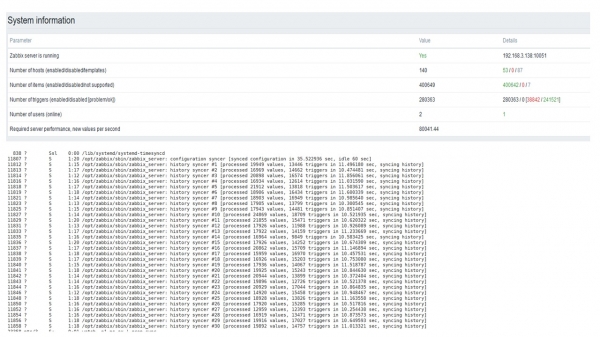
The insertion load with thirty history syncers is already quite high.
I also increased various parameters: history syncers, caches.
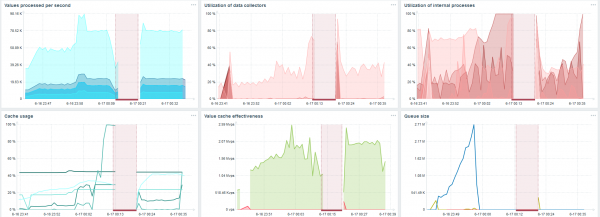
On my hardware, the load of history syncers increased to the maximum. HistoryCache filled up with data quickly — the buffer accumulated processing data.
Throughout this time, I monitored CPU usage, RAM, and other system parameters, and found that disk utilization was at its maximum.
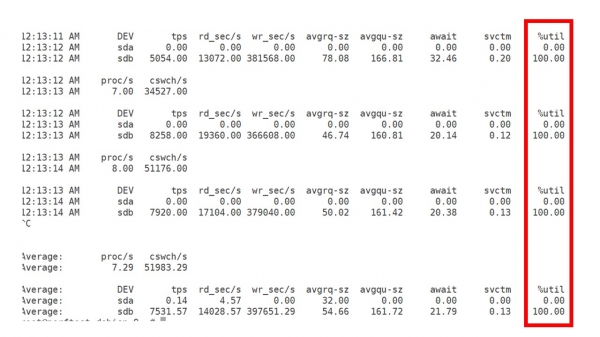
I achieved the utilization of the maximum capabilities of the disk on this hardware and on this virtual machine. With such intensity, PostgreSQL began to drop data quite actively, and the disk could no longer keep up with writing and reading.
Second server
I took another server that already had 48 processors and 128 GB of RAM. I tuned it up — installed 60 history syncers, and achieved acceptable performance.
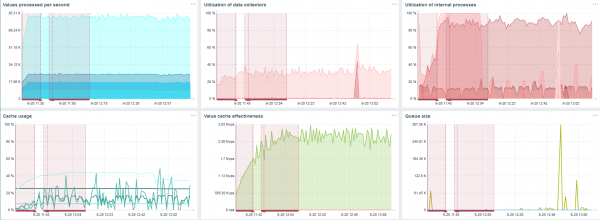
In fact, this is already the performance limit where action needs to be taken.
TimescaleDB. 80,000 nvps
My main task is to test the capabilities of TimescaleDB under the load of Zabbix. 80,000 values per second is a lot, the frequency of metric collection (except Yandex, of course) and a quite large 'setup'.
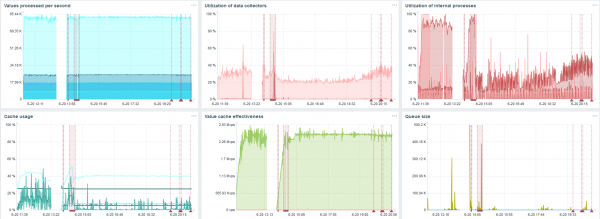
There is a drop on each graph — this is precisely the data migration. After the drops in the Zabbix server, the load profile of the history syncer changed significantly — it fell by three times.
TimescaleDB allows inserting data nearly three times faster and uses less HistoryCache.
Accordingly, your data will be delivered on time.
TimescaleDB. 120,000 nvps
Next, I increased the amount of data elements to 500,000. The main goal was to check the capabilities of TimescaleDB — I obtained an estimated value of 125,000 values per second.
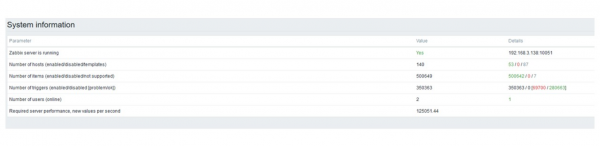
This is a working 'setup' that can operate for a long time. However, since my disk was only 1.5 TB, I filled it up in a couple of days.
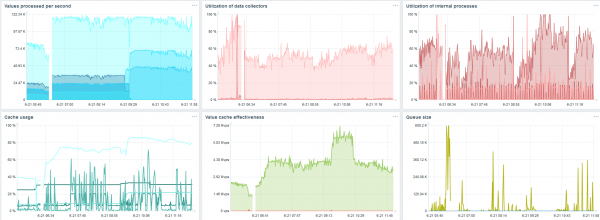
The most important thing is that new TimescaleDB partitions were being created at the same time.
For performance, this is completely unnoticeable. When partitions are created in MySQL, for example, everything is different. It usually happens at night because it blocks overall insertion, table work, and can cause service degradation. This is not the case with TimescaleDB.
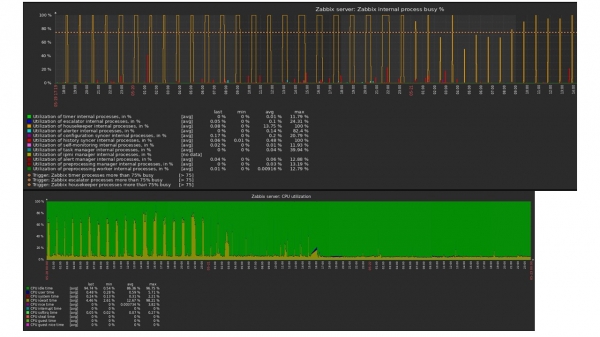
As an example, I’ll show one graph from many in the community. In the picture, TimescaleDB is enabled, which is why the load from io.weight usage on the processor dropped. The usage of internal processes also decreased. Moreover, this is an ordinary virtual machine on standard spinning disks, not SSDs.
Conclusions
TimescaleDB is a good solution for small 'setups', that hit the disk performance limit. It will allow decent operation until the database is migrated to faster hardware.
TimescaleDB is easy to configure, provides a performance boost, works well with Zabbix and has advantages over PostgreSQL..
If you are using PostgreSQL and do not plan to change it, I recommend using PostgreSQL with the TimescaleDB extension in conjunction with Zabbix. This solution works efficiently for medium 'setups'.
When we say 'high performance,' we mean It's only a short wait to get acquainted with the technologies and practices that enable services to cater to millions of users. The list for November 7 and 8 is already prepared, but can still be suggested.
Subscribe to our and , where we reveal the highlights of the upcoming conference, and learn how to get the most out of it.
Source: habr.com
