

VictoriaMetrics, TimescaleDB, and InfluxDB were compared in a dataset with a billion data points belonging to 40K unique time series.
A few years ago, it was the era of Zabbix. Each bare metal server had no more than a few metrics – CPU usage, RAM usage, disk usage, and network usage. Thus, the metrics from thousands of servers could fit into 40 thousand unique time series, and Zabbix could use MySQL as a backend for the time series data 🙂
Currently, one with default configurations provides more than 500 metrics on an average host. There are numerous for various databases, web servers, hardware systems, etc. All of them provide a wealth of useful metrics. More are starting to expose various metrics. There is Kubernetes with clusters and pods uncovering numerous metrics. This results in servers exposing thousands of unique metrics per host. Therefore, a unique time series of 40K is no longer a high-end capacity. It becomes mainstream that should be easily handled by any modern TSDB on a single server.
What constitutes a large number of unique time series at the moment? Perhaps 400K or 4M? Or 40M? Let's compare modern TSDBs with these figures.
Setting the benchmark
is a great benchmarking tool for TSDBs. It allows generating an arbitrary number of metrics by passing the required number of time series divided by 10 — the flag (formerly -scale-var). 10 is the number of dimensions (metrics) generated on each host, server. The following datasets were created using TSBS for benchmarking:
- 400K unique time series, 60 seconds interval between data points, data covering a full 3 days, ~1.7B total data points.
- 4M unique time series, 600 seconds interval, data covering a full 3 days, ~1.7B total data points.
- 40M unique time series, 1 hour interval, data covering a full 3 days, ~2.8B total data points.
Client and server were run on dedicated instances in Google Cloud. These instances had the following configurations:
- vCPUs: 16
- RAM: 60 GB
- Storage: standard hard drive with a capacity of 1 TB. It provides a read/write throughput of 120 Mbps, 750 read operations per second, and 1.5K write operations per second.
TSDBs were extracted from official Docker images and run in Docker with the following configurations:
VictoriaMetrics:
docker run -it --rm -v /mnt/disks/storage/vmetrics-data:/victoria-metrics-data -p 8080:8080 valyala/victoria-metricsInfluxDB values (-e are necessary for high performance. For details see ):
docker run -it --rm -p 8086:8086
-e INFLUXDB_DATA_MAX_VALUES_PER_TAG=4000000
-e INFLUXDB_DATA_CACHE_MAX_MEMORY_SIZE=100g
-e INFLUXDB_DATA_MAX_SERIES_PER_DATABASE=0
-v /mnt/disks/storage/influx-data:/var/lib/influxdb influxdb
TimescaleDB (configuration taken from the file):
MEM=`free -m | grep "Mem" | awk ‘{print $7}’`
let "SHARED=$MEM/4"
let "CACHE=2*$MEM/3"
let "WORK=($MEM-$SHARED)/30"
let "MAINT=$MEM/16"
let "WAL=$MEM/16"
docker run -it --rm -p 5432:5432
--shm-size=${SHARED}MB
-v /mnt/disks/storage/timescaledb-data:/var/lib/postgresql/data
timescale/timescaledb:latest-pg10 postgres
-cmax_wal_size=${WAL}MB
-clog_line_prefix="%m [%p]: [%x] %u@%d"
-clogging_collector=off
-csynchronous_commit=off
-cshared_buffers=${SHARED}MB
-ceffective_cache_size=${CACHE}MB
-cwork_mem=${WORK}MB
-cmaintenance_work_mem=${MAINT}MB
-cmax_files_per_process=100
The data loader was started with 16 parallel threads.
This article contains results only for insertion metrics. Results of the sample benchmark will be published in a separate article.
400K unique time series
Let's start with simple elements — 400K. Benchmark results:
- VictoriaMetrics: 2.6M data points per second; memory usage: 3 GB; final size of data on disk: 965 MB
- InfluxDB: 1.2M data points per second; memory usage: 8.5 GB; final size of data on disk: 1.6 GB
- Timescale: 849K data points per second; memory usage: 2.5 GB; final size of data on disk: 50 GB
As you can see from the above results, VictoriaMetrics excels in insertion performance and compression ratio. Timescale excels in memory usage, but it uses a lot of disk space — 29 bytes per data point.
Below are CPU usage graphs for each of the TSDBs during the benchmark:
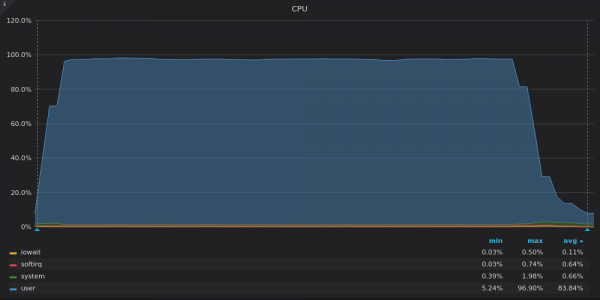
Above screenshot: VictoriaMetrics — CPU load during insertion test for unique metric 400K.
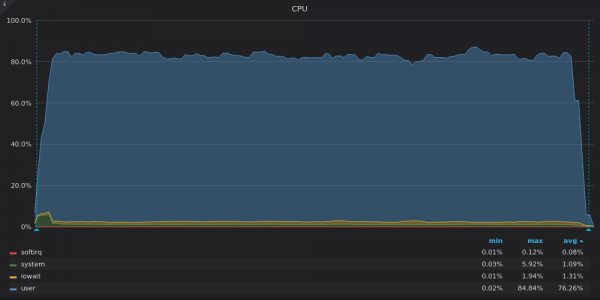
Above screenshot: InfluxDB — CPU load during insertion test for unique metric 400K.
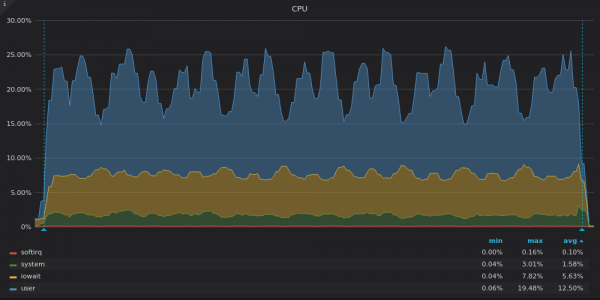
Above screenshot: TimescaleDB — CPU load during insertion test for unique metric 400K.
VictoriaMetrics utilizes all available vCPUs, while InfluxDB uses only about 2 out of 16 vCPUs.
Timescale utilizes only 3-4 out of 16 vCPUs. High levels of iowait and system on the TimescaleDB time series graph indicate a bottleneck in the input/output (I/O) subsystem. Let's take a look at the disk throughput usage graphs:
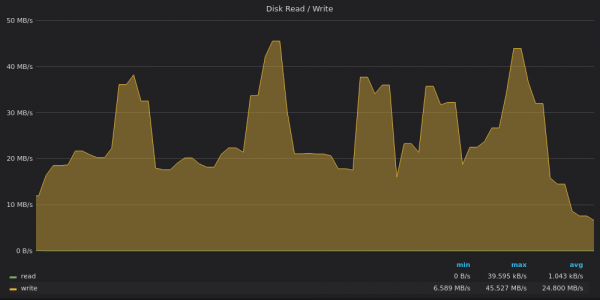
Above screenshot: VictoriaMetrics — Disk throughput usage during the insert test for 400K unique metrics.
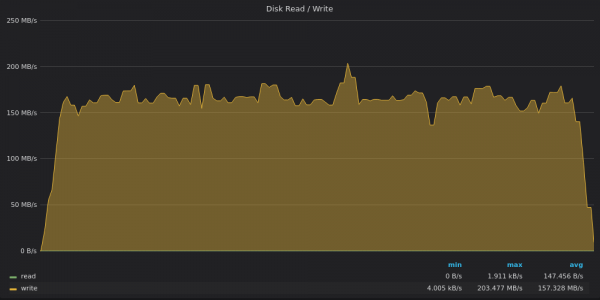
Above screenshot: InfluxDB — Disk throughput usage during the insert test for 400K unique metrics.
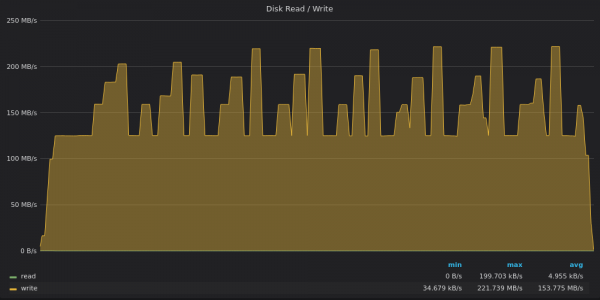
Above screenshot: TimescaleDB — Disk throughput usage during the insert test for 400K unique metrics.
VictoriaMetrics writes data at a rate of 20 Mb/s with peaks up to 45 Mb/s. The peaks correspond to large partial merges in the tree. .
InfluxDB writes data at a rate of 160 MB/s, while a 1 TB disk to a write throughput of 120 MB/s.
TimescaleDB is limited to a write throughput of 120 Mb/s, but sometimes it breaks this limit and reaches 220 Mb/s at peak values. These peaks correspond to periods of insufficient CPU load in the previous graph.
Let's take a look at the I/O usage graphs:
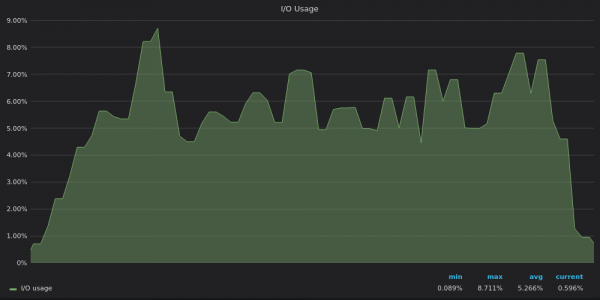
Above screenshot: VictoriaMetrics — I/O usage during the insert test for 400K unique metrics.
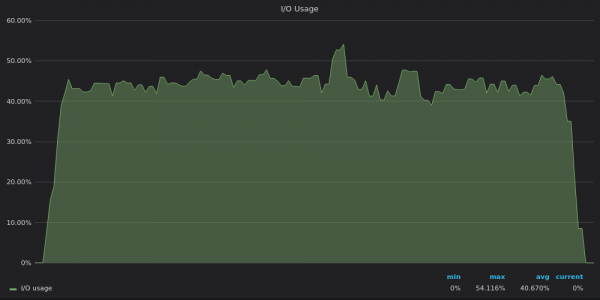
Above screenshot: InfluxDB — I/O usage during the insert test for 400K unique metrics.
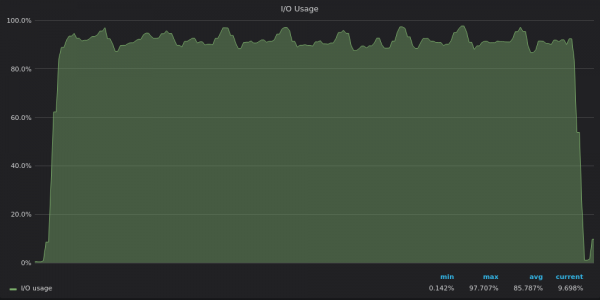
Above screenshot: TimescaleDB — I/O usage during the insert test for 400K unique metrics.
It is now clear that TimescaleDB reaches its I/O limit, which is why it cannot utilize the remaining 12 vCPUs.
4M unique time series
4M time series may seem a bit daunting. However, our competitors are successfully passing this test. Benchmark results:
- VictoriaMetrics: 2.2M data points per second; memory usage: 6 GB; final data size on disk: 3 GB.
- InfluxDB: 330K data points per second; memory usage: 20.5 GB; final data size on disk: 18.4 GB.
- TimescaleDB: 480K data points per second; memory usage: 2.5 GB; final data size on disk: 52 GB.
The performance of InfluxDB dropped from 1.2 million data points per second for 400K time series to 330,000 data points per second for 4M time series. This is a significant loss of performance compared to other competitors. Let’s take a look at the CPU usage graphs to understand the root cause of this loss:
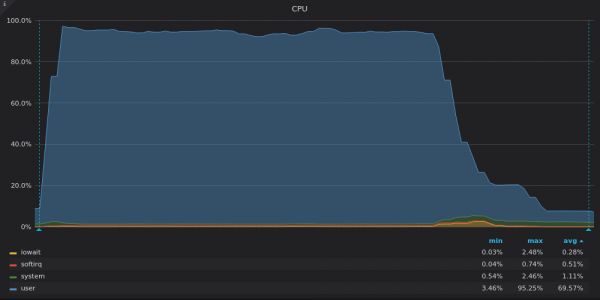
Above is a screenshot: VictoriaMetrics — CPU Usage during the insertion test for a unique time series of 4M.
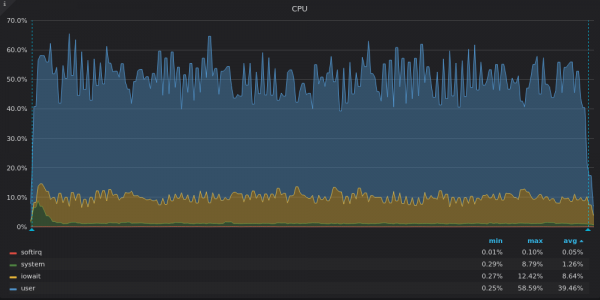
Above is a screenshot: InfluxDB — CPU Usage during the insertion test for a unique time series of 4M.
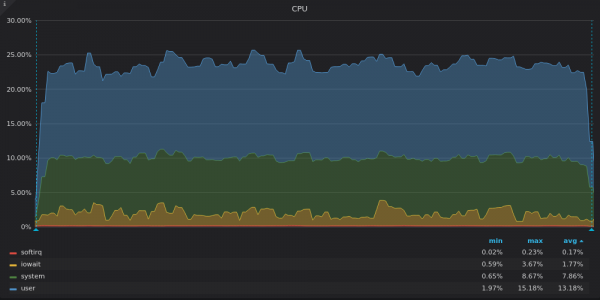
Above is a screenshot: TimescaleDB — CPU Usage during the insertion test for a unique time series of 4M.
VictoriaMetrics utilizes almost all of the CPU power. The drop at the end corresponds to the remaining LSM merges after all data has been inserted.
InfluxDB utilizes only 8 out of 16 vCPUs, while TimescaleDB uses 4 out of 16 vCPUs. What is common in their charts? A high share of iowait, which again indicates an I/O bottleneck.
TimescaleDB has a high share of system. We assume that high power led to many system calls or to many .
Let’s take a look at the disk throughput graphs:
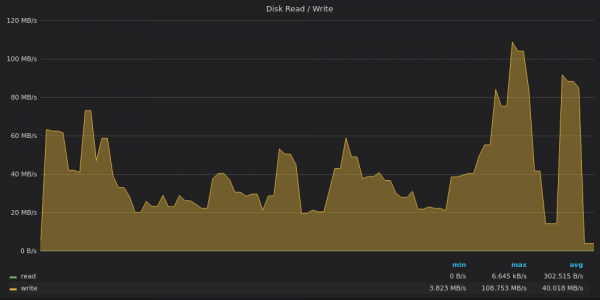
Above is a screenshot: VictoriaMetrics — Disk bandwidth usage for inserting 4M unique metrics.
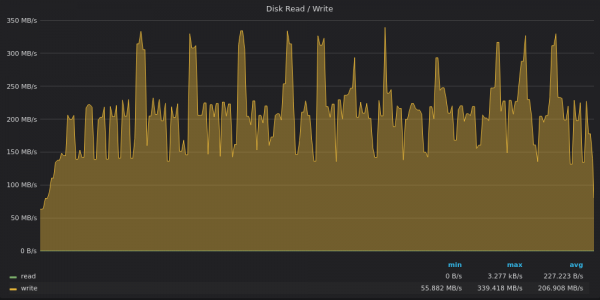
Above is a screenshot: InfluxDB — Disk bandwidth usage for inserting 4M unique metrics.
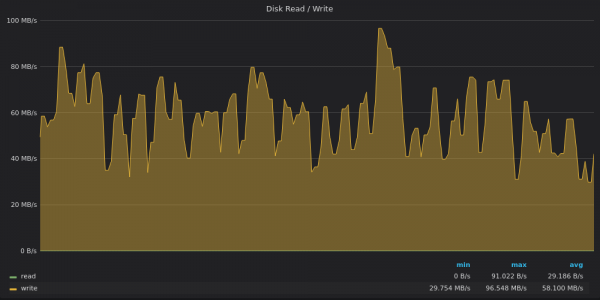
Above is a screenshot: TimescaleDB — Disk bandwidth usage for inserting 4M unique metrics.
VictoriaMetrics reached a peak of 120 MB/s, while the average write speed was 40 MB/s. It’s likely that several heavy LSM merges were performed during the peak.
InfluxDB again squeezes an average write throughput of 200 MB/s with peaks up to 340 MB/s on a disk with a write limit of 120 MB/s 🙂
TimescaleDB is no longer disk-bound. It seems to be constrained by something else, related to a high share of system CPU load.
Let’s look at the I/O usage graphs:
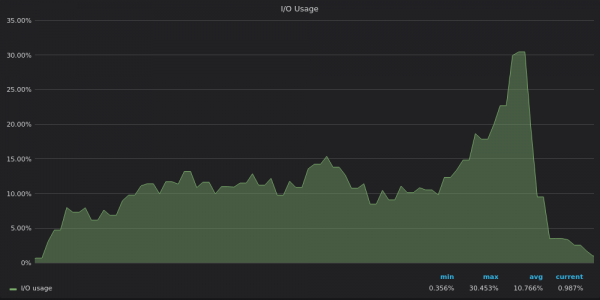
Above is a screenshot: VictoriaMetrics — I/O usage during the insertion test for a unique time series of 4M.
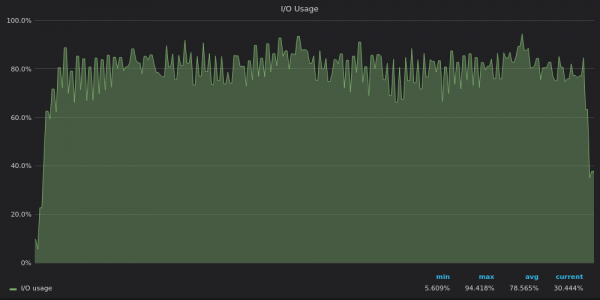
Above is a screenshot: InfluxDB — I/O usage during the insertion test for a unique time series of 4M.
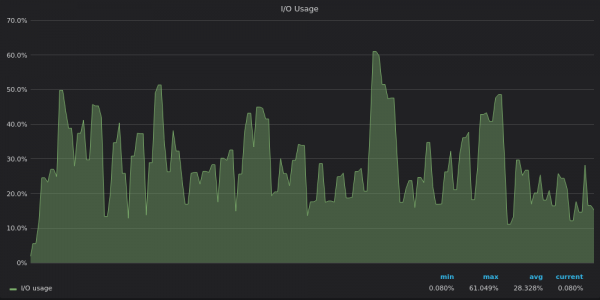
Above is a screenshot: TimescaleDB — I/O usage during the insertion test for a unique time series of 4M.
IO usage graphs mirror disk bandwidth usage graphs — InfluxDB is limited in IO, while VictoriaMetrics and TimescaleDB have additional IO resources.
40M unique time series
40M unique time series were too large for InfluxDB 🙁
Benchmark results:
- VictoriaMetrics: 1.7M data points per second; memory usage: 29 GB; disk space usage: 17 GB.
- InfluxDB: did not finish because it required more than 60 GB of memory.
- TimescaleDB: 330K data points per second; memory usage: 2.5 GB; disk space usage: 84GB.
TimescaleDB shows exceptionally low and stable memory usage – 2.5 GB — the same as for unique metrics of 4M and 400K.
VictoriaMetrics slowly increased at a rate of 100 thousand data points per second until all 40M metric names with labels were processed. It then reached a steady insert rate of 1.5-2.0M data points per second, bringing the final result to 1.7M data points per second.
The graphs for 40M unique time series are similar to those for 4M unique time series, so let's skip them.
Conclusions
- Modern TSDBs can handle inserts for millions of unique time series on a single server. In the next article, we will check how well TSDBs perform queries over millions of unique time series.
- Insufficient CPU load typically indicates an IO bottleneck. Additionally, this may suggest overly coarse locking, where only a few threads can operate simultaneously.
- IO bottlenecks do exist, especially in storage without SSDs, such as virtualized block devices from cloud providers.
- VictoriaMetrics provides the best optimization for slow storage with low IO levels. It offers the best speed and the best compression.
Download and try it with your data. A corresponding static binary file is available at .
Read more about VictoriaMetrics in this .
Update: A with reproducible results has been published.
Update #2: Read also .
Update #3: !
Telegram chat:
Source: habr.com
