

TL;DR: this article discusses a convenient, fast, and reliable method for identifying Linux programs that write data to the disk, which helps in detecting high or unusually frequent loads on the disk subsystem and also allows for assessing the overhead of the file system. This is particularly relevant for SSDs in PCs, EMMC, and Flash memory in single-board computers.
During the writing of this article, it was discovered that writing several kilobytes of data to the BTRFS file system results in 3 megabytes of actual data being written to the disk.
Introduction
"Oh, nonsense, the memory cells in modern SSDs will last for decades of normal use, no need to worry about it, and certainly don't transfer swap, virtual machines, and the browser profile folder to HDD" — a typical response to concerns about the reliability of solid-state drives with guaranteed ≈150 TBW. If we estimate how much typical software can write, it seems like 10-20 GB per day is already a large number, let's say a maximum of 40 GB, what could be more? At such figures, the response seems quite reasonable — it takes 10 years to reach the guaranteed values for the number of cell rewrites, at 40 GB of data written daily.
However, in the past 6 years, I've used three different SSDs: the first one's controller failed, and the second started moving data between cells several times a day, resulting in 30-second delays in write operations.
After 7 months of using the new SSD, I decided to check the amount of data written, as reported by the disk itself through SMART.
19.7 TB.
In total, over 7 months, I have used 13% of the guaranteed amount of written data, despite it being set up according to best practices for partition alignment and file system configuration, I hardly use swap, and the disks of virtual machines are located on HDD!
This is an unusually high figure; at this rate, the warranty TBW will be exceeded long before the 5-year warranty period is reached. My computer cannot possibly write 93 gigabytes a day! I need to check how much data is written to the disk in 10 minutes…
Total:
 Writes Queued: 24,712, 2,237MiB
 Writes Completed: 25,507, 2,237MiB
 Write Merges: 58, 5,472KiB
2.2 GiB, wow!
Determining the amount of data written to the disk device
If your device supports S.M.A.R.T. (SSD, EMMC, some industrial MicroSD), the first step is to request data from the drive using programs smartctl, skdump or mmc (part of mmc-utils).
Example output of the smartctl program
$ sudo smartctl -a /dev/sdb
smartctl 7.0 2019-03-31 r4903 [x86_64-linux-5.3.11-200.fc30.x86_64] (local build)
Copyright (C) 2002-18, Bruce Allen, Christian Franke, www.smartmontools.org

=== START OF INFORMATION SECTION ===
Model Family:     Samsung based SSDs
Device Model:     Samsung SSD 860 EVO mSATA 250GB
Serial Number:    S41MNC0KA13477K
LU WWN Device Id: 5 002538 e700fa64b
Firmware Version: RVT41B6Q
User Capacity:    250 059 350 016 bytes [250 GB]
Sector Size:      512 bytes logical/physical
Rotation Rate:    Solid State Device
Form Factor:      mSATA
Device is:        In smartctl database [for details use: -P show]
ATA Version is:   ACS-4 T13/BSR INCITS 529 revision 5
SATA Version is:  SATA 3.1, 6.0 Gb/s (current: 3.0 Gb/s)
Local Time is:    Tue Nov 19 01:48:50 2019 MSK
SMART support is: Available - device has SMART capability.
SMART support is: Enabled

=== START OF READ SMART DATA SECTION ===
SMART overall-health self-assessment test result: PASSED

General SMART Values:
Offline data collection status:  (0x00) Offline data collection activity
                                        was never started.
                                        Auto Offline Data Collection: Disabled.
Self-test execution status:      (   0) The previous self-test routine completed
                                        without error or no self-test has ever
                                        been run.
Total time to complete Offline
data collection:                (    0) seconds.
Offline data collection
capabilities:                    (0x53) SMART execute Offline immediate.
                                        Auto Offline data collection on/off support.
                                        Suspend Offline collection upon new
                                        command.
                                        No Offline surface scan supported.
                                        Self-test supported.
                                        No Conveyance Self-test supported.
                                        Selective Self-test supported.
SMART capabilities:            (0x0003) Saves SMART data before entering
                                        power-saving mode.
                                        Supports SMART auto save timer.
Error logging capability:        (0x01) Error logging supported.
                                        General Purpose Logging supported.
Short self-test routine
recommended polling time:        (   2) minutes.
Extended self-test routine
recommended polling time:        (  85) minutes.
SCT capabilities:              (0x003d) SCT Status supported.
                                        SCT Error Recovery Control supported.
                                        SCT Feature Control supported.
                                        SCT Data Table supported.

SMART Attributes Data Structure revision number: 1
Vendor Specific SMART Attributes with Thresholds:
ID# ATTRIBUTE_NAME          FLAG     VALUE WORST THRESH TYPE      UPDATED  WHEN_FAILED RAW_VALUE
  5 Reallocated_Sector_Ct   0x0033   100   100   010    Pre-fail  Always       -       0
  9 Power_On_Hours          0x0032   098   098   000    Old_age   Always       -       5171
 12 Power_Cycle_Count       0x0032   099   099   000    Old_age   Always       -       459
177 Wear_Leveling_Count     0x0013   096   096   000    Pre-fail  Always       -       62
179 Used_Rsvd_Blk_Cnt_Tot   0x0013   100   100   010    Pre-fail  Always       -       0
181 Program_Fail_Cnt_Total  0x0032   100   100   010    Old_age   Always       -       0
182 Erase_Fail_Count_Total  0x0032   100   100   010    Old_age   Always       -       0
183 Runtime_Bad_Block       0x0013   100   100   010    Pre-fail  Always       -       0
187 Uncorrectable_Error_Cnt 0x0032   100   100   000    Old_age   Always       -       0
190 Airflow_Temperature_Cel 0x0032   058   039   000    Old_age   Always       -       42
195 ECC_Error_Rate          0x001a   200   200   000    Old_age   Always       -       0
199 CRC_Error_Count         0x003e   100   100   000    Old_age   Always       -       0
235 POR_Recovery_Count      0x0012   099   099   000    Old_age   Always       -       29
241 Total_LBAs_Written      0x0032   099   099   000    Old_age   Always       -       38615215765

SMART Error Log Version: 1
No Errors Logged

SMART Self-test log structure revision number 1
No self-tests have been logged.  [To run self-tests, use: smartctl -t]

SMART Selective self-test log data structure revision number 1
 SPAN  MIN_LBA  MAX_LBA  CURRENT_TEST_STATUS
    1        0        0  Not_testing
    2        0        0  Not_testing
    3        0        0  Not_testing
    4        0        0  Not_testing
    5        0        0  Not_testing
Selective self-test flags (0x0):
  After scanning selected spans, do NOT read-scan remainder of disk.
If Selective self-test is pending on power-up, resume after 0 minute delay.
My SSD stores the number of written data in the parameter 241 Total_LBAs_Written, in logical blocks (LBA), not in bytes. The size of a logical block in my case is 512 bytes (this can be seen in the smartctl output, in Sector Size). To convert to bytes, you need to multiply the parameter value by 512.
38615215765 × 512 ÷ 1000 ÷ 1000 ÷ 1000 ÷ 1000 = 19.770 TB
38615215765 × 512 ÷ 1024 ÷ 1024 ÷ 1024 ÷ 1024 = 17.981 TiB
Program skdump on my SSD is trying to interpret the value of Total_LBAs_Written in its own way, which leads to the output 1296217.695 TB, which is obviously incorrect.
To find out the amount of written information at the device level, we will use the program btrace from the package set blktrace. It shows both general statistics for the entire duration of the program's operation and individual processes and threads (including kernels) that performed the writes.
Run the following command to gather information over 10 minutes, where /dev/sdb is your disk:
# btrace -w 600 -a write /dev/sdbTypical command output
…
  8,16   0     3253    50.085433192     0  C  WS 125424240 + 64 [0]
  8,16   0     3254    50.085550024     0  C  WS 193577744 + 64 [0]
  8,16   0     3255    50.085685165     0  C  WS 197246976 + 64 [0]
  8,16   0     3256    50.085936852     0  C  WS 125736264 + 128 [0]
  8,16   0     3257    50.086060780     0  C  WS 96261752 + 64 [0]
  8,16   0     3258    50.086195031     0  C  WS 94948640 + 64 [0]
  8,16   0     3259    50.086327355     0  C  WS 124656144 + 64 [0]
  8,16   0     3260    50.086843733 15368  C WSM 310218496 + 32 [0]
  8,16   0     3261    50.086975238   753  A WSM 310218368 + 32 < - (8,20) 291339904
  8,16   0     3262    50.086975560   753  Q WSM 310218368 + 32 [dmcrypt_write/2]
  8,16   0     3263    50.086977345   753  G WSM 310218368 + 32 [dmcrypt_write/2]
  8,16   0     3264    50.086978072   753  I WSM 310218368 + 32 [dmcrypt_write/2]
  8,16   0     3265    50.086979159   753  D WSM 310218368 + 32 [dmcrypt_write/2]
  8,16   0     3266    50.087055685     0  C WSM 310218368 + 32 [0]
  8,16   0     3267    50.087060168   753  A WSM 310218592 + 160 < - (8,20) 291340128
  8,16   0     3268    50.087060367   753  Q WSM 310218592 + 160 [dmcrypt_write/2]
  8,16   0     3269    50.087061242   753  G WSM 310218592 + 160 [dmcrypt_write/2]
  8,16   0     3270    50.087061698   753  I WSM 310218592 + 160 [dmcrypt_write/2]
  8,16   0     3271    50.087062361   753  D WSM 310218592 + 160 [dmcrypt_write/2]
  8,16   0     3272    50.087386179     0  C WSM 310218592 + 160 [0]
  8,16   0     3273    50.087436417 15368  A FWS 0 + 0 < - (253,1) 0
  8,16   0     3274    50.087437471 15368  Q FWS [LS Thread]
  8,16   0     3275    50.087440862 15368  G FWS [LS Thread]
  8,16   0     3276    50.088300047     0  C  WS 0 [0]
  8,16   0     3277    50.088470917   753  A WFSM 18882688 + 8 < - (8,20) 4224
  8,16   0     3278    50.088471091   753  Q WFSM 18882688 + 8 [dmcrypt_write/2]
  8,16   0     3279    50.088471688   753  G WFSM 18882688 + 8 [dmcrypt_write/2]
  8,16   0     3280    50.088474334 32254  D WSM 18882688 + 8 [kworker/0:2H]
  8,16   0     3281    50.088515572     0  C WSM 18882688 + 8 [0]
  8,16   0     3282    50.089229069     0  C WSM 18882688 [0]
CPU0 (8,16):
 Reads Queued:           0,        0KiB  Writes Queued:         345,   25,932KiB
 Read Dispatches:        0,        0KiB  Write Dispatches:      331,   25,788KiB
 Reads Requeued:         0               Writes Requeued:         0
 Reads Completed:        0,        0KiB  Writes Completed:    1,597,  117,112KiB
 Read Merges:            0,        0KiB  Write Merges:            1,       16KiB
 Read depth:             0               Write depth:           177
 IO unplugs:             0               Timer unplugs:           0
CPU1 (8,16):
 Reads Queued:           0,        0KiB  Writes Queued:         502,   39,948KiB
 Read Dispatches:        0,        0KiB  Write Dispatches:      495,   40,076KiB
 Reads Requeued:         0               Writes Requeued:         0
 Reads Completed:        0,        0KiB  Writes Completed:        0,        0KiB
 Read Merges:            0,        0KiB  Write Merges:            0,        0KiB
 Read depth:             0               Write depth:           177
 IO unplugs:             0               Timer unplugs:           0
CPU2 (8,16):
 Reads Queued:           0,        0KiB  Writes Queued:         297,   26,800KiB
 Read Dispatches:        0,        0KiB  Write Dispatches:      287,   26,800KiB
 Reads Requeued:         0               Writes Requeued:         0
 Reads Completed:        0,        0KiB  Writes Completed:        0,        0KiB
 Read Merges:            0,        0KiB  Write Merges:            0,        0KiB
 Read depth:             0               Write depth:           177
 IO unplugs:             0               Timer unplugs:           0
CPU3 (8,16):
 Reads Queued:           0,        0KiB  Writes Queued:         418,   24,432KiB
 Read Dispatches:        0,        0KiB  Write Dispatches:      408,   24,448KiB
 Reads Requeued:         0               Writes Requeued:         0
 Reads Completed:        0,        0KiB  Writes Completed:        0,        0KiB
 Read Merges:            0,        0KiB  Write Merges:            2,      272KiB
 Read depth:             0               Write depth:           177
 IO unplugs:             0               Timer unplugs:           0

Total (8,16):
 Reads Queued:           0,        0KiB  Writes Queued:       1,562,  117,112KiB
 Read Dispatches:        0,        0KiB  Write Dispatches:    1,521,  117,112KiB
 Reads Requeued:         0               Writes Requeued:         0
 Reads Completed:        0,        0KiB  Writes Completed:    1,597,  117,112KiB
 Read Merges:            0,        0KiB  Write Merges:            3,      288KiB
 IO unplugs:             0               Timer unplugs:           0

Throughput (R/W): 0KiB/s / 2,338KiB/s
Events (8,16): 9,287 entries
Skips: 0 forward (0 -   0.0%)
btrace allows you to clearly see the actual amount of data written, but it is difficult to determine which programs are performing the writes from its output.
Identification of programs writing to the storage device
Program iotop will show the processes writing to the disk and the amount of data written.
The following parameters provide the most convenient output:
# iotop -obPatExample of the program output
02:55:47 Total DISK READ :       0.00 B/s | Total DISK WRITE :      30.65 K/s
02:55:47 Actual DISK READ:       0.00 B/s | Actual DISK WRITE:       0.00 B/s
    TIME  PID  PRIO  USER     DISK READ  DISK WRITE  SWAPIN      IO    COMMAND
b'02:55:47   753 be/4 root          0.00 B      0.00 B  0.00 %  0.04 % [dmcrypt_write/2]'
b'02:55:47   788 be/4 root         72.00 K     18.27 M  0.00 %  0.02 % [btrfs-transacti]'
b'02:55:47 15057 be/4 valdikss    216.00 K    283.05 M  0.00 %  0.01 % firefox'
b'02:55:47  1588 ?dif root          0.00 B      0.00 B  0.00 %  0.00 % Xorg -nolisten tcp -auth /var/run/sddm/{398f030f-9667-4dff-b371-81eaae48dfdf} -background none -noreset -displayfd 18 -seat seat0 vt1'
b'02:55:47 15692 be/4 valdikss    988.00 K      9.41 M  0.00 %  0.00 % python3 /usr/bin/gajim'
b'02:55:47 15730 ?dif valdikss      9.07 M      0.00 B  0.00 %  0.00 % telegram-desktop --'
b'02:55:47  2174 ?dif valdikss   1840.00 K      2.47 M  0.00 %  0.00 % yakuake'
b'02:55:47 19827 be/4 root         16.00 K    896.00 K  0.00 %  0.00 % [kworker/u16:7-events_unbound]'
b'02:55:47 19074 be/4 root         16.00 K    480.00 K  0.00 %  0.00 % [kworker/u16:4-btrfs-endio-write]'
b'02:55:47 19006 be/4 root         16.00 K   1872.00 K  0.00 %  0.00 % [kworker/u16:1-events_unbound]'
b'02:55:47  1429 be/4 root        484.00 K      0.00 B  0.00 %  0.00 % accounts-daemon'
b'02:55:47 15820 be/4 valdikss    312.00 K      0.00 B  0.00 %  0.00 % firefox -contentproc -childID 6 -isForBrowser -prefsLen 7894 -prefMapSize 223880 -parentBuildID 20191022164834 -greomni /usr/lib64/firefox/omni.ja -appomni /usr/lib64/firefox/browser/omni.ja -appdir /usr/lib64/firefox/browser 15057 tab'
b'02:55:47  2125 ?dif valdikss      0.00 B     92.00 K  0.00 %  0.00 % plasmashell'
b'02:55:47  1268 be/3 root          0.00 B      4.00 K  0.00 %  0.00 % auditd'
b'02:55:47  1414 be/4 root          0.00 B      4.00 K  0.00 %  0.00 % sssd_nss --uid 0 --gid 0 --logger=files'
b'02:55:47 15238 be/4 valdikss      0.00 B      4.00 K  0.00 %  0.00 % thunderbird'
b'02:55:47 18605 be/4 root          0.00 B      3.19 M  0.00 %  0.00 % [kworker/u16:0-btrfs-endio-write]'
b'02:55:47 18867 be/4 root          0.00 B     96.00 K  0.00 %  0.00 % [kworker/u16:5-btrfs-endio-meta]'
b'02:55:47 19070 be/4 root          0.00 B    160.00 K  0.00 %  0.00 % [kworker/u16:2-btrfs-freespace-write]'
b'02:55:47 19645 be/4 root          0.00 B      2.17 M  0.00 %  0.00 % [kworker/u16:3-events_unbound]'
b'02:55:47 19982 be/4 root          0.00 B    496.00 K  0.00 %  0.00 % [kworker/u16:6-btrfs-endio-write]'
Firefox stands out, having written 283 megabytes in just a few minutes of iotop running.
Identification of files being written to
Information about the process that is hammering the disk is useful, but knowing the paths of the writes is even better.
Let's use the program fatrace, which tracks changes in the file system.
# fatrace -f WExample of the program output
firefox(15057): CW /home/valdikss/.mozilla/firefox/xyf4vqh2.default/storage/default/moz-extension+++e5c304fb-af40-498a-9ba8-47eb0416e933^userContextId=4294967295/idb/3647222921wleabcEoxlt-eengsairo.sqlite-wal
firefox(15057): CW /home/valdikss/.mozilla/firefox/xyf4vqh2.default/storage/default/moz-extension+++e5c304fb-af40-498a-9ba8-47eb0416e933^userContextId=4294967295/idb/3647222921wleabcEoxlt-eengsairo.sqlite
firefox(15057): W /home/valdikss/.mozilla/firefox/xyf4vqh2.default/storage/default/https+++habr.com/ls/data.sqlite-journal
firefox(15057): W /home/valdikss/.mozilla/firefox/xyf4vqh2.default/storage/default/https+++habr.com/ls/data.sqlite-journal
firefox(15057): W /home/valdikss/.mozilla/firefox/xyf4vqh2.default/storage/default/https+++habr.com/ls/data.sqlite-journal
firefox(15057): W /home/valdikss/.mozilla/firefox/xyf4vqh2.default/storage/default/https+++habr.com/ls/data.sqlite-journal
firefox(15057): W /home/valdikss/.mozilla/firefox/xyf4vqh2.default/storage/default/https+++habr.com/ls/data.sqlite-journal
firefox(15057): W /home/valdikss/.mozilla/firefox/xyf4vqh2.default/storage/default/https+++habr.com/ls/data.sqlite-journal
firefox(15057): W /home/valdikss/.mozilla/firefox/xyf4vqh2.default/storage/default/https+++habr.com/ls/data.sqlite-journal
firefox(15057): CW /home/valdikss/.mozilla/firefox/xyf4vqh2.default/storage/default/https+++habr.com/ls/usage-journal
firefox(15057): W /home/valdikss/.mozilla/firefox/xyf4vqh2.default/storage/default/https+++habr.com/ls/usage
firefox(15057): CW /home/valdikss/.mozilla/firefox/xyf4vqh2.default/storage/default/https+++habr.com/ls/usage
firefox(15057): W /home/valdikss/.mozilla/firefox/xyf4vqh2.default/storage/default/https+++habr.com/ls/data.sqlite-journal
firefox(15057): W /home/valdikss/.mozilla/firefox/xyf4vqh2.default/storage/default/https+++habr.com/ls/data.sqlite
firefox(15057): W /home/valdikss/.mozilla/firefox/xyf4vqh2.default/storage/default/https+++habr.com/ls/data.sqlite
firefox(15057): W /home/valdikss/.mozilla/firefox/xyf4vqh2.default/storage/default/https+++habr.com/ls/data.sqlite
firefox(15057): W /home/valdikss/.mozilla/firefox/xyf4vqh2.default/webappsstore.sqlite-wal
firefox(15057): W /home/valdikss/.mozilla/firefox/xyf4vqh2.default/webappsstore.sqlite-wal
firefox(15057): W /home/valdikss/.mozilla/firefox/xyf4vqh2.default/webappsstore.sqlite-wal
firefox(15057): W /home/valdikss/.mozilla/firefox/xyf4vqh2.default/webappsstore.sqlite-wal
firefox(15057): W /home/valdikss/.mozilla/firefox/xyf4vqh2.default/webappsstore.sqlite-wal
firefox(15057): W /home/valdikss/.mozilla/firefox/xyf4vqh2.default/webappsstore.sqlite-wal
firefox(15057): W /home/valdikss/.mozilla/firefox/xyf4vqh2.default/webappsstore.sqlite-wal
firefox(15057): CW /home/valdikss/.mozilla/firefox/xyf4vqh2.default/storage/default/https+++habr.com/ls/data.sqlite-journal
firefox(15057): W /home/valdikss/.mozilla/firefox/xyf4vqh2.default/webappsstore.sqlite
firefox(15057): W /home/valdikss/.mozilla/firefox/xyf4vqh2.default/webappsstore.sqlite
firefox(15057): W /home/valdikss/.mozilla/firefox/xyf4vqh2.default/webappsstore.sqlite
Fatrace cannot show the amount of data written due to its relatively simple tracking of file access using inotify.
From the output, it is clear how Habr saves my article in the browser's local storage while I am writing it, as well as the Group Speed Dial extension, which, as I discovered precisely using Fatrace, reads its data every 30 seconds. It reads, rather than writes: CW The message before the file indicates that the file is opened for reading and writing, while simultaneously creating the file if it doesn't exist (openat is called with the flag O_RDWR|O_CREAT), but it does not indicate that any information was actually written to the file.
Just to make sure, let's use strace with a filter on filesystem calls:
strace -yy -e trace=open,openat,close,write -f -p 15057 2>&1 | grep extensionCommand output
[pid 20352] openat(AT_FDCWD, "/home/valdikss/.mozilla/firefox/xyf4vqh2.default/storage/default/moz-extension+++e5c304fb-af40-498a-9ba8-47eb0416e933^userContextId=4294967295/idb/3647222921wleabcEoxlt-eengsairo.sqlite", O_RDWR|O_CREAT|O_CLOEXEC, 0644) = 153
[pid 20352] read(153, "SQLite format 3 20 22 @   d 23"..., 100) = 100
[pid 20352] read(153, "SQLite format 3 20 22 @   d 23"..., 4096) = 4096
[pid 20352] openat(AT_FDCWD, "/home/valdikss/.mozilla/firefox/xyf4vqh2.default/storage/default/moz-extension+++e5c304fb-af40-498a-9ba8-47eb0416e933^userContextId=4294967295/idb/3647222921wleabcEoxlt-eengsairo.sqlite-wal", O_RDWR|O_CREAT|O_CLOEXEC, 0644) = 166
…
[pid 20352] read(54, " r4304364354354364-  4204!4'414" 250 &"..., 4096) = 4096
[pid 20352] read(54, " 136Pt2262504 O24532016:"16.27 r245306>2461t1q370"..., 4096) = 4096
[pid 20352] close(77) = 0
[pid 20352] close(54) = 0
There are no calls write(), which indicates the absence of any writes to the file.
File System Overhead Definition
The large discrepancy in the readings iotop and btrace suggested testing the file system by manually writing data to a file and monitoring the btrace readings.
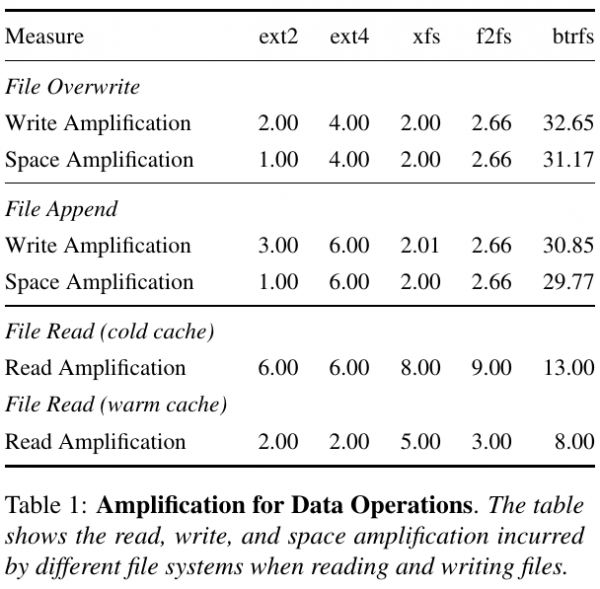
To completely exclude writing to disk, boot into emergency mode of systemd and manually record a few bytes of data to an existing file, btrace on an SSD with btrfs reports a write of 3 megabytes. real data. A newly created file system on an 8 GB flash drive writes a minimum of 264 KiB when writing a single byte.
In comparison, writing a pair of bytes to a file on ext4 ends with writing 24 kilobytes of data to disk.
In 2017, Jayashree Mohan, Rohan Kadekodi, and Vijay Chidambaram Their results for btrfs and ext4 when writing 4 KB correlate with mine.
Conclusion and Findings
Through the described manipulations, it was discovered that:
- Frequent writing of job states for the printer by the CUPS printing daemon in /var/cache/cups каждую минуту. Проблема устранена очисткой /var/spool/cups (хотя никаких заданий печати не было);
- The fact of reading the database every 30 seconds by the Group Speed Dial extension for Firefox;
- Periodic logging by various performance monitoring services in Fedora, which resulted in writing several megabytes of data to btrfs: pmcd.service, pmie.service, pmlogger.service;
- Huge amplification when writing a small amount of data using btrfs.
Conclusion: it is not worth using btrfs if programs frequently write small amounts of data (a few kilobytes), otherwise this will result in megabytes of written data. This is especially relevant for single-board computers with an OS on MicroSD.
Source: habr.com
