

Logs are an important part of a system, allowing us to understand whether it is functioning (or not) as expected. In a microservices architecture, working with logs becomes a distinct discipline in its own right. There are many questions to address:
- how to write logs from the application;
- where to write logs;
- how to transport logs for storage and processing;
- how to process and store logs.
The adoption of popular containerization technologies adds extra layers of complexity to the solutions available.
This is precisely the topic of Yuri Bushmelev's presentation, "The Landscape of Challenges in Log Collection and Delivery".
For those interested, please read on.
My name is Yuri Bushmelev. I work at Lazada. Today, I will talk about how we created our logs, how we collected them, and what we include in them.

Where are we from? Who are we? Lazada is the number one online marketplace in six Southeast Asian countries. Our operations are distributed across data centers. Currently, we have a total of 4 data centers. Why is this important? Because some of our solutions were influenced by the very weak connections between these centers. We have a microservices architecture. I was surprised to find that we already have 80 microservices. When I began working on logging, there were only 20. Additionally, there's a significant piece of legacy PHP that we have to deal with. All of this currently generates over 6 million messages per minute across the system as a whole. Next, I will show how we are managing this and why it is so important.

We need to manage these 6 million messages somehow. What are we supposed to do with them? We need to:
- send them from the application
- receive them for delivery
- deliver them for analysis and storage.
- analyze
- and store them somehow.

When three million messages appeared, I had about this same look. Because we started with just a few cents. Obviously, application logs are written there. For example, could not connect to the database, was able to connect to the database but couldn't read something. But besides that, each of our microservices also writes an access log. Every request that comes to the microservice is logged. Why do we do this? Developers want to have the ability to trace. Each access log has a traceid field, which a special interface uses to unwind the whole chain and nicely present the trace. The trace shows how the request went through, and this helps our developers deal with all kinds of unidentified issues faster.

How to live with this? Now I will briefly describe the options—how this problem is generally solved. How to tackle the task of collecting, transferring, and storing logs.
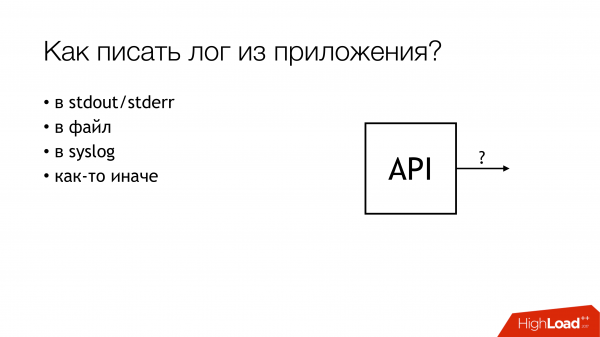
How to write from the application? Clearly, there are different ways. Specifically, there are best practices, as trendy folks tell us. There’s old school in two forms, as our ancestors described. There are other methods.
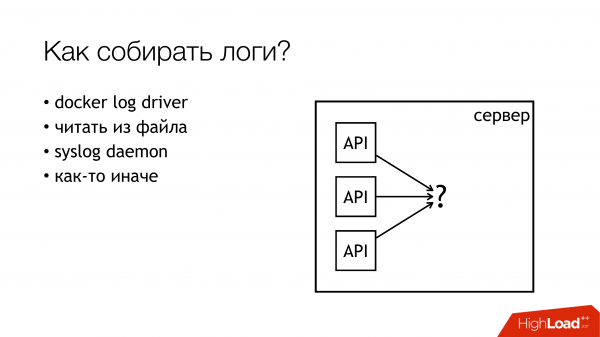
The situation with log collection is roughly the same. There aren’t many options for solving this specific part. There are more now, but still not too many.
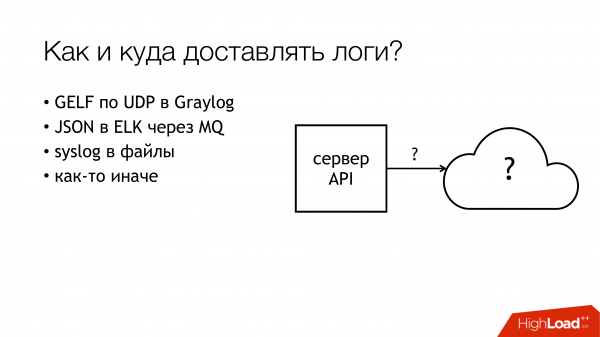
However, when it comes to delivery and subsequent analysis—the number of variations begins to explode. I won’t describe each option now. I think the main options are well-known to everyone who has shown interest in the topic.

I will show you how we did this at Lazada and how it all actually started.

A year ago, I joined Lazada, and I was assigned to a project about logs. It looked something like this. The log from the application was written to stdout and stderr. Everyone did it the trendy way. But then the developers removed it from the standard streams, and infrastructure specialists would sort it out. Between infrastructure specialists and developers, there are also release engineers who said, "Uh… okay, let’s just wrap it in a file with a shell, and that's it." And since it’s all in a container, they wrapped it right in the container, mapped the directory inside, and put it there. I think it's pretty obvious what came out of that.
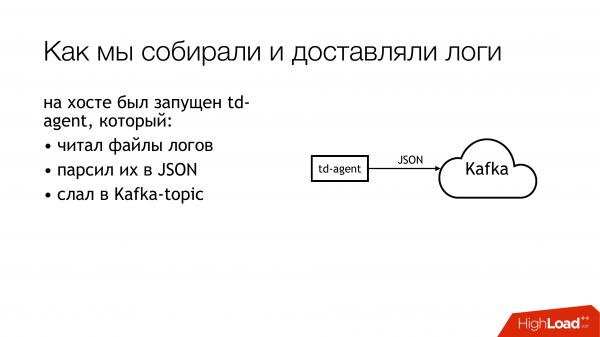
Let's take a look a bit further ahead. How we delivered these logs. Someone chose td-agent, which is actually fluentd, but not quite fluentd. I never quite understood the relationship between these two projects, but they seem to be about the same thing. This fluentd, written in Ruby, would read log files, parse them into JSON using some regex patterns. It would then send them to Kafka. Moreover, for each API, we had 4 separate topics in Kafka. Why 4? Because we have live, staging, and both stdout and stderr. Developers create them, and infrastructure teams have to set them up in Kafka. Plus, Kafka was managed by another department. So, we had to create a ticket for them to set up 4 topics for each API. Everyone kept forgetting about it. In general, it was chaos.
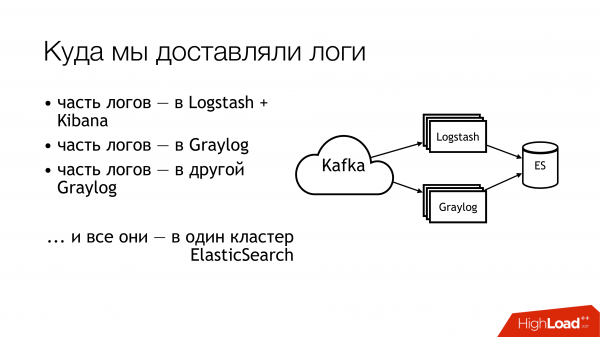
What did we do with this next? We sent it to Kafka. Then, half of the logs flew into Logstash. The other half of the logs got split up. Part went to one Graylog, part to another Graylog. In the end, all of this ended up in one Elasticsearch cluster. So, all this mess ultimately fell there. This is not how it should be done!
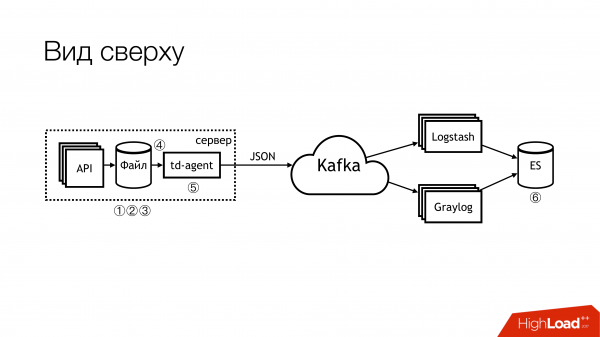
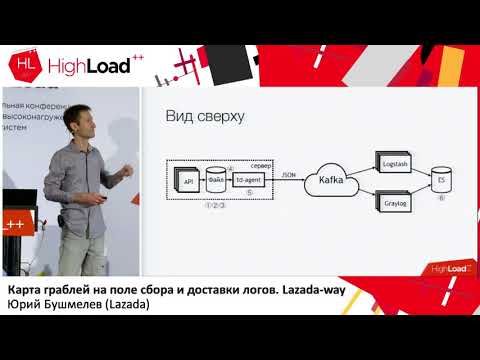
This is what it looks like when viewed from a distance. Do not do this! Here, the problematic areas are immediately marked with numbers. There are actually more, but 6 are particularly problematic, and something needs to be done about them. I will discuss them separately now.

Here (1, 2, 3) we write files, and accordingly, there are three pitfalls right here.
The first one (1) is we need to write them somewhere. We wouldn't always want to give the API the ability to write directly to a file. Ideally, the API should be isolated in a container, and even better – it should be read-only. I'm a sysadmin, so I have a slightly different perspective on these things.
The second point (2.3) is that we receive a lot of requests in the API. The API writes a lot of data to a file. The files grow. We need to rotate them. Otherwise, we won't be able to keep up with the disks. Rotating them is tricky because they are redirected through shell to a directory. We can't rotate it at all. You can't tell the application to reopen the descriptors. Because the developers will look at you like you’re foolish: "What descriptors? We’re writing to stdout." The infrastructure team implemented a copytruncate in logrotate, which simply makes a copy of the file and truncates the original. Consequently, between these copying processes, disk space usually runs out.
(4) We had different formats in various APIs. They differed slightly, but we needed to write different regexps. Since all this was managed by Puppet, there was a large bundle of classes with their own bugs. Plus, td-agent could consume memory most of the time, lag, or just pretend to be working while doing nothing. It was impossible to tell from the outside that it was doing nothing. In the best case, it would crash, and someone would later restart it. More accurately, an alert would come in, and someone would manually restart it.

(6) And the biggest mess was Elasticsearch. Because it was an old version. We didn’t have dedicated masters at that time. We had heterogeneous logs where fields could overlap. Different logs from different applications could be written with the same field names, but contain different data inside. For example, one log comes with an Integer in the field named level. Another log comes with a String in the field level. In the absence of static mapping, it resulted in a wonderful issue. If after the index rotation in Elasticsearch the first message that arrives is a string, we are fine. But if the first one that arrives is an Integer, then all subsequent messages that arrive as Strings are simply discarded. Because the field types do not match.

We began to ask ourselves these questions. We decided not to look for those to blame.

We need to take action! It's obvious that we need to establish standards. We already had some standards in place. Some were introduced a little later. Fortunately, a unified log format for all APIs was approved by that time. It is outlined directly in the service interaction standards. Accordingly, those who want to receive logs must write them in this format. If someone does not write logs in this format, it means we cannot guarantee anything.
Next, we would like to establish a unified standard for the methods of writing, delivering, and collecting logs. Essentially, where to write them and how to deliver them. The ideal situation is when the same library is used across projects. There is a separate logging library for Go, and a separate library for PHP. Everyone we have should use them. Currently, I would say we are about 80% successful in this. But some are still experiencing difficulties.
And there (on the slide), we are just beginning to outline the ‘SLA for log delivery’. It doesn’t exist yet, but we are working on it. Because it is very convenient when the infrastructure says that if you write in a certain format to a certain place and no more than N messages per second, we will deliver it there with a certain probability. This alleviates a lot of headaches. If there is an SLA, that would be fantastic!
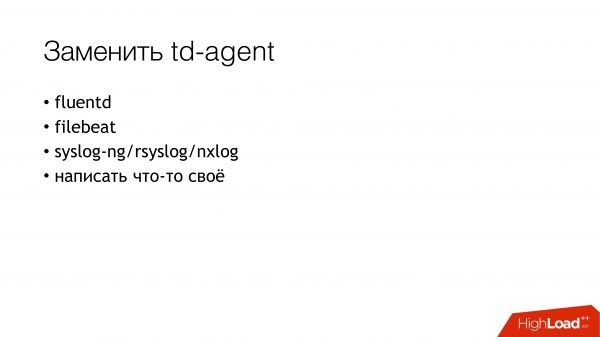
How did we start solving the problem? The main issue was with td-agent. It was unclear where our logs were going. Are they being delivered? Are they being collected? Where are they at all? Therefore, the first step was to replace td-agent. I briefly outlined some options for what to replace it with.
Fluentd. Firstly, I encountered it at my previous job, where it also crashed periodically. Secondly, it's essentially the same but better suited for our needs.
Filebeat. What made it convenient for us? The fact that it is written in Go, and we have extensive expertise in Go. Accordingly, if needed, we could modify it to fit our requirements. That’s why we didn’t choose it; we wanted to avoid any temptation to start rewriting it for our own use.
An obvious solution for sysadmins remains various syslogs in this quantity (syslog-ng/rsyslog/nxlog).
Alternatively, one could write something from scratch, but we dismissed that idea, just like filebeat. If we are to write something, it’s better to create something useful for the business. For log delivery, it's best to use something ready-made.
Therefore, the choice essentially came down to selecting between syslog-ng and rsyslog. I leaned towards rsyslog simply because we already had classes for rsyslog in Puppet, and I didn't find any obvious differences between them. Whether it's syslog here or syslog there, it’s all the same. Yes, some have worse documentation, while others have better. One has certain capabilities, and the other has different ones.
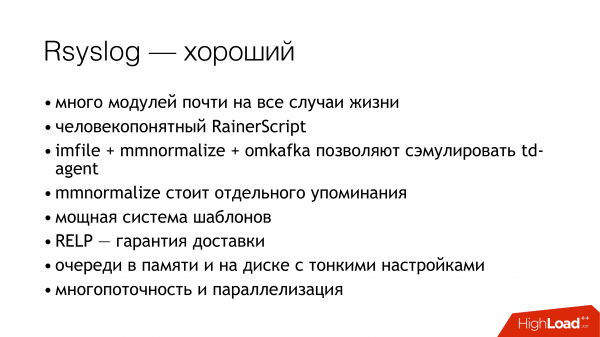
And a little about rsyslog. First, it's great because it has many modules. It features a user-friendly RainerScript (a modern configuration language). An amazing bonus is that we could emulate td-agent's behavior using standard tools, and nothing changed for the applications. We essentially replaced td-agent with rsyslog while keeping everything else untouched. This immediately gave us a working delivery system. Furthermore, mmnormalize is an awesome feature in rsyslog. It allows parsing logs, but not through Grok and regexp. It creates an abstract syntax tree. It parses logs similarly to how a compiler parses source code. This enables very fast operation while consuming minimal CPU resources—it's just an extremely cool feature. There are plenty of other bonuses as well. I won’t get into those.
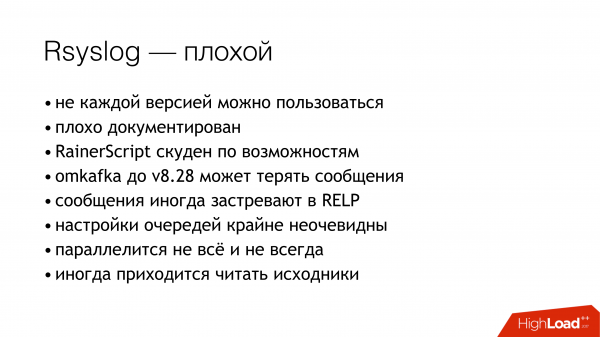
Rsyslog has its share of disadvantages. They are roughly similar to the bonuses. The main problems are that you need to know how to configure it, and you need to choose the right version.
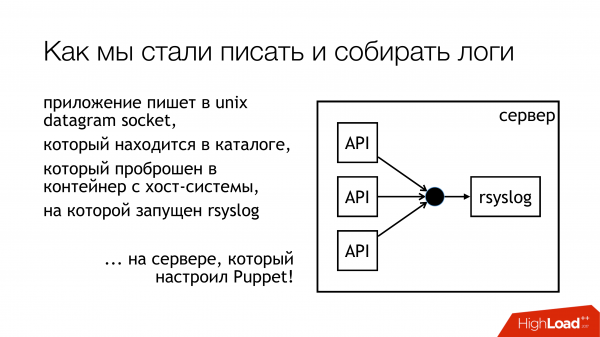
We decided to log to a unix socket. Specifically, not to /dev/log, because that has a mix of system logs, with journald in that pipeline. So, let's write to a custom socket. We'll attach it to a separate ruleset. We won't mix anything up. Everything will be transparent and clear. And that's exactly what we did. The directory with these sockets is standardized and made available in all containers. Containers can see the socket they need, open it, and write to it.
Why not a file? Because everyone read , which tried to pass a file into Docker, only to discover that after restarting rsyslog, the file descriptor changes, and Docker loses that file. It keeps something else open, but it's no longer the socket where the writing occurs. We decided to work around this issue and, in the process, also avoid the problem of locking.
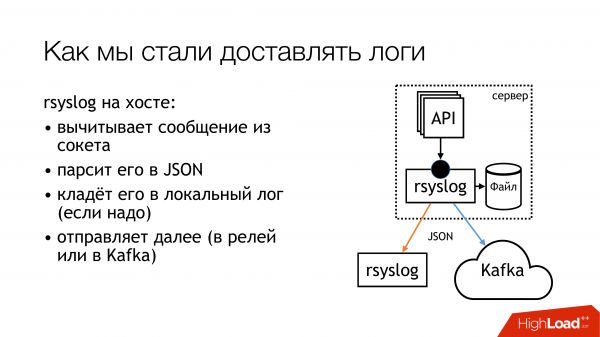
Rsyslog performs the actions specified on the slide and sends logs either to a relay or to Kafka. Kafka corresponds to the old method. The relay—I attempted to use pure rsyslog for log delivery. Without Message Queue, just with rsyslog's standard tools. Essentially, this works.
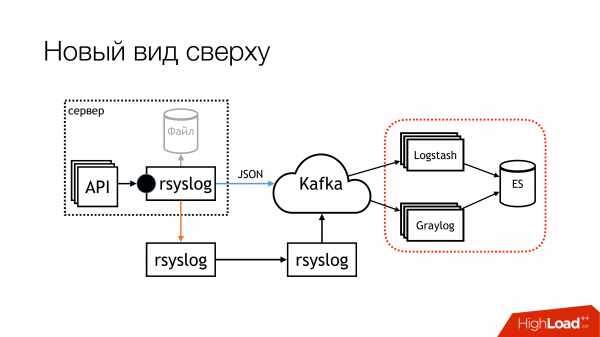
However, there are nuances regarding how to integrate them into this part (Logstash/Graylog/ES). This component (rsyslog-rsyslog) is used between data centers. Here, a compressed TCP link helps save bandwidth and, consequently, increases the chances of receiving logs from another data center when the connection is congested. For example, we have Indonesia, where conditions are poor. There, this is a constant issue.
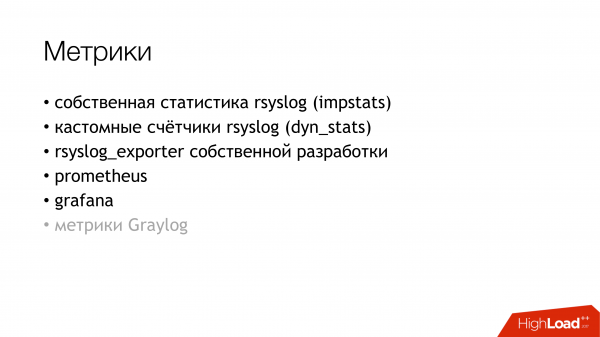
We started thinking about how to monitor the likelihood that the logs we recorded from the application actually reach the other end. We decided to establish metrics. Rsyslog has its own statistics gathering module with certain counters. For instance, it can show you the size of the queue or how many messages came in for a particular action. From that, we could derive some insights. Additionally, it has custom counters that can be configured to show, for example, the number of messages recorded by a specific API. Next, I wrote a rsyslog_exporter in Python, and we sent all this data to Prometheus to generate graphs. We were eager for Graylog metrics, but we haven't managed to set them up yet.
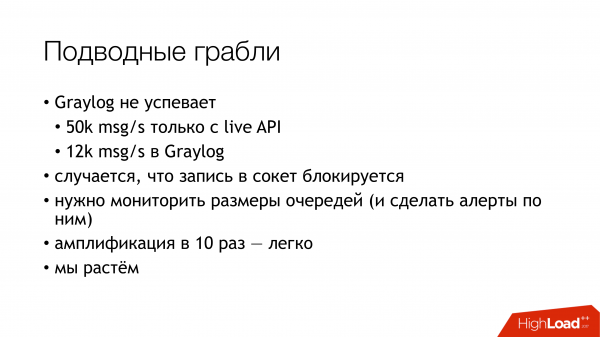
What issues did we encounter? Problems arose when we unexpectedly discovered that our Live API sends 50k messages per second. This is just the Live API, excluding staging. Graylog shows us only 12,000 messages per second. Thus, a reasonable question emerged: where are the rest? From this, we concluded that Graylog simply couldn't handle the load. We checked, and indeed, Graylog with Elasticsearch struggled with this throughput.
Next, other discoveries we made during the process.
Writing to the socket gets blocked. How did this happen? When I used rsyslog for delivery, at some point, the channel between the data centers broke. Delivery halted at one point and another. This all reached the machine with the API that writes to the rsyslog socket. The queue filled up. Then the queue for writing to the Unix socket filled up, which by default is 128 packets. The next write() in the application gets blocked. When we looked at the library we were using in our Go applications, it stated that writing to the socket occurs in a non-blocking mode. We were sure that nothing was being blocked. Because we read... , which wrote about this. But there is one point. Around this call, there was also an infinite loop where attempts were constantly made to push a message into the socket. We did not notice that. We had to rewrite the library. Since then, it has changed a few times, but now we have eliminated all locks in all subsystems. Therefore, we can stop rsyslog, and nothing will crash.
We need to monitor the queue sizes, which helps avoid these pitfalls. Firstly, we can monitor when we start losing messages. Secondly, we can monitor if we have delivery issues.
And another unpleasant moment — amplification by 10 times in a microservices architecture — is very easy. We don’t have that many incoming requests, but due to the graph that these messages traverse further, because of the access logs, we actually increase the load on the logs by about ten times. Unfortunately, I didn’t have time to calculate the exact numbers, but microservices are like that. This needs to be taken into account. Currently, the log collection subsystem is the most loaded one in Lazada.

How to solve the elasticsearch problem? If you need to quickly get logs in one place, without running around all the machines and collecting them there, use file storage. This works reliably. It can be set up on any server. You just need to connect some disks and set up syslog. After this, you will definitely have all the logs in one place. Then you can leisurely configure elasticsearch, graylog, or something else. But you will already have all the logs, and you can store them as long as your disk arrays allow.
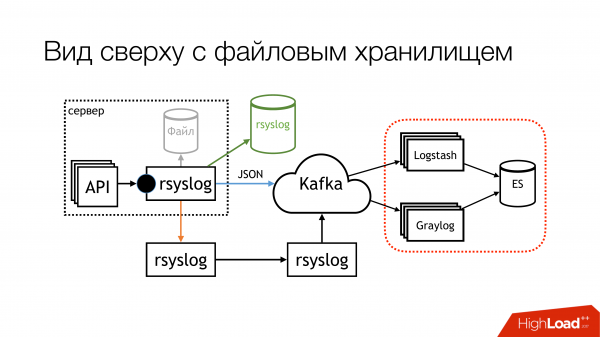
At the time of my report, the scheme looked like this. We have practically stopped writing to files. Now, most likely, we will disconnect the remnants. On the local machines where the APIs are running, we will stop writing to files. Firstly, there is a file storage that works very well. Secondly, these machines constantly run out of space, so it needs to be constantly monitored.
This part with Logstash and Graylog is really a hassle. So we need to get rid of it. We need to choose one.

We decided to ditch Logstash and Kibana. Why? The connection lies in the fact that Kibana without X-Pack and Shield does not allow for differentiated access rights to the logs. Therefore, we opted for Graylog. It’s not my favorite, but it gets the job done. We bought new hardware, set up a fresh Graylog, and migrated all the logs with strict formats to a separate Graylog. We resolved the issue of different types of similar fields organizationally.
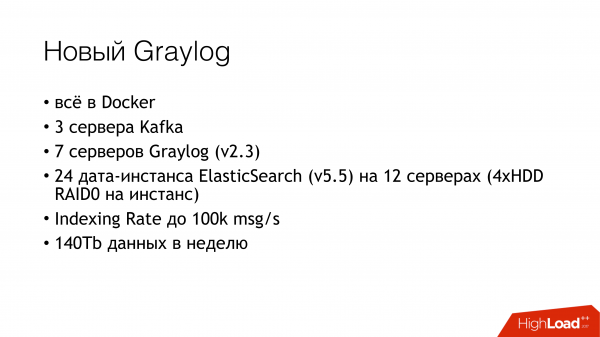
So, what’s included in the new Graylog? We simply recorded everything in Docker. We took a bunch of servers, deployed three Kafka instances, and seven Graylog servers version 2.3 (because we wanted Elasticsearch version 5). All of this was set up on HDD RAID. We observed an indexing rate of up to 100,000 messages per second. We recorded that 140 terabytes of data were processed weekly.
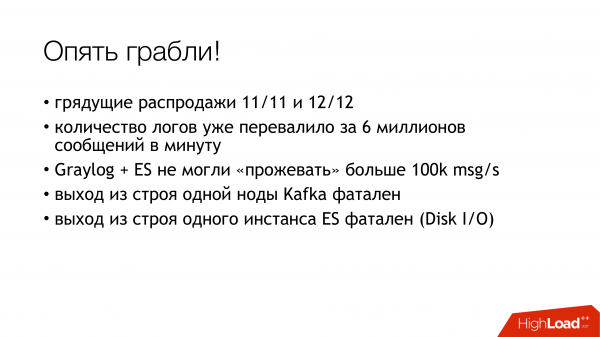
And once again, we hit a snag! We have two sales coming up. We migrated over 6 million messages. Graylog can’t keep up with processing them. We need to find a way to survive once more.
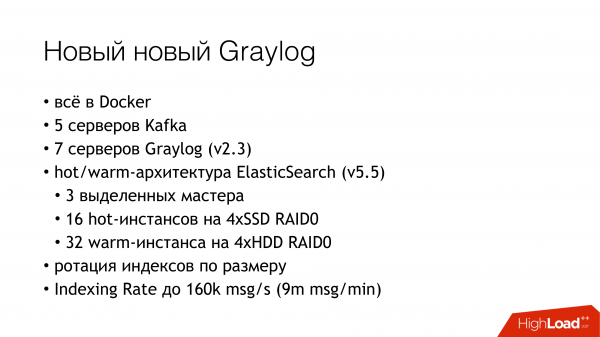
This is how we managed to survive. We added a few more servers and SSDs. Currently, we are operating in this manner. Now we are processing 160k messages per second. We haven’t hit the limit yet, so it’s still unclear how much we can really pull from this.
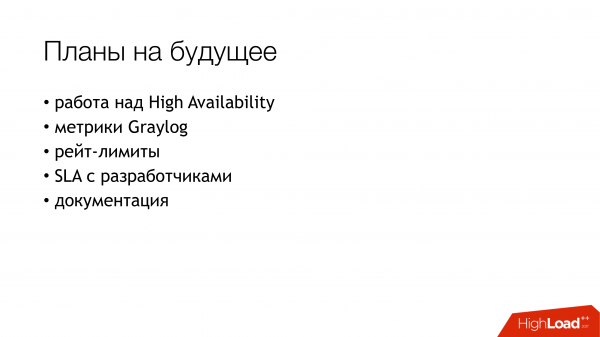
Here are our plans for the future. Realistically, the most important aspect is high availability. We don’t have it yet. Several machines are configured the same, but everything is still running through one machine. We need to take the time to set up failover between them.
Gather metrics from Graylog.
Implement rate limiting so that one overwhelmed API doesn’t consume all our bandwidth and everything else.
And finally, sign some SLA with the developers, stating that we can handle this amount. If you send more, then sorry.
And write documentation.
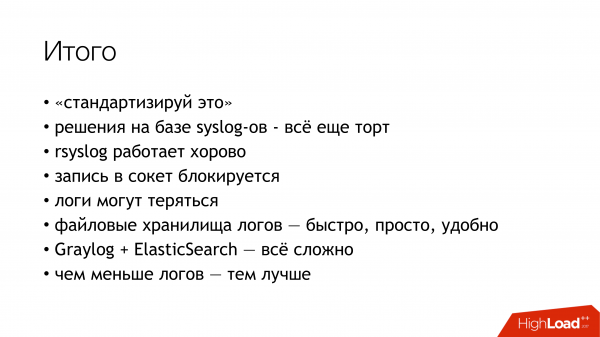
Briefly, here are the conclusions from everything we’ve experienced. First, standards. Second, syslog is great. Third, rsyslog works exactly as outlined in the slide. Now, let’s move on to questions.
Questions.
Question: Why did you decide not to take… (filebeat?)
Answer: We need to write to a file. It was very undesirable. When your API writes thousands of messages per second, rotating once an hour is still not feasible. Writing to a pipe is possible. To which the developers asked me: "What happens if the process we’re writing to crashes?" I simply didn’t know how to respond and said, "Well, okay, let’s not do that."
Question: Why don't you just write logs in HDFS?
Answer: This is the next stage. We considered it at the very beginning, but since there are currently no resources to work on it, it's on our long-term solution list.
Question: A columnar format would be more suitable.
Answer: I understand. We are fully on board with it.
Question: You write to rsyslog. Both TCP and UDP are possible. But if it's UDP, how do you guarantee delivery?
Answer: There are two points. First, I always tell everyone that we do not guarantee log delivery. Because when developers come and say, 'Let's start writing financial data there, and you store it somewhere in case something happens,' we respond, 'Great! How about you block on writing to the socket and do this in transactions, so you can guarantee that you send it to the socket and ensure we receive it on the other side?' At that moment, it becomes unnecessary for everyone. And if it’s not necessary, what questions do we have? If you don’t want to guarantee writing to the socket, why should we guarantee delivery? We make our best effort. We really try to deliver as much as possible and as well as possible, but we do not provide a 100% guarantee. Therefore, please do not write financial data there. For that purpose, there are databases with transactions.
Question: When the API generates a log message and hands over control to microservices, have you encountered the issue where messages from different microservices arrive out of order? This causes confusion.
Answer: It's normal for them to arrive in different orders. You need to be prepared for that. Because any network delivery does not guarantee order, or you need to spend resources specifically for that. If we take file storage, each API saves logs in its own file. Actually, rsyslog sorts them into directories. Each API has its own logs that you can go and check, and then you can correlate them by timestamp in that log. If they go to check in Graylog, it will sort them by timestamp. Everything will be fine there.
Question: The timestamp can differ by milliseconds.
Answer: The timestamp is generated by the API itself. That's the whole point. We have NTP. The API generates the timestamp within the message itself. It's not added by rsyslog.
Question: It's not very clear how the interaction between data centers works. Within the data center, it's clear how logs are collected and processed. How does the interaction between data centers occur? Or does each data center operate independently?
Answer: Almost. Each country is located in one specific data center. Currently, we don't have distribution where one country is hosted across different data centers. So there's no need to merge them. Inside each center, there is a Log Relay. This is an Rsyslog server. In fact, there are two management machines. They are configured identically. But for now, traffic is just flowing through one of them. It aggregates all the logs. It has a disk queue just in case. It compresses the logs and sends them to the central data center (in Singapore), where they are then forwarded to Graylog. And each data center has its own file storage. In case we lose connection, we have all the logs stored there. They will remain there. They will be saved.
Question: Do you get logs from there in case of unusual situations?
Answer: You can go there (to the file storage) and check.
Question: How do you monitor that you're not losing logs?
Answer: Actually, we do lose them, and we monitor that. The monitoring was launched a month ago. In the library used by the Go API, there are metrics. It can count how many times it has failed to write to the socket. There is currently a clever heuristic in place. There is a buffer. It tries to write messages from it to the socket. If the buffer gets full, it starts dropping them. It counts how many it has dropped. If the counters start overflowing, we find out about it. They now also come to Prometheus, and you can see graphs in Grafana. Alerts can be set up. But it's still unclear who to send them to.
Question: In Elasticsearch, you store logs with redundancy. How many replicas do you have?
Answer: One replica.
Question: Is it only one replica?
Answer: It's a master and a replica. Data is stored in two instances.
Question: Have you adjusted the size of the Rsyslog buffer?
Answer: We write datagrams to a custom Unix socket. This immediately imposes a limit of 128 kilobytes. We cannot write more than that. We have defined this in the standard. Anyone who wants to access the storages must write 128 kilobytes. The libraries, by the way, truncate and set a flag indicating that the message has been truncated. In our message standard, there is a special field that shows whether it was truncated during writing or not. So we have the ability to track that aspect as well.
Question: Are you writing broken JSON?
Answer: Broken JSON will be discarded either during relay because the packet is too large, or it will be rejected by Graylog because it won't be able to parse the JSON. But there are nuances that need fixing, most of which are related to rsyslog. I have already filled in a few issues there that still need work.
Question: Why Kafka? Have you tried RabbitMQ? Is Graylog not coping under such loads?
Answer: We are not getting along with Graylog. While Graylog is working for us, it is quite problematic. It's a peculiar tool. And, honestly, it’s not necessary. I would prefer to write directly from rsyslog to Elasticsearch and then monitor it with Kibana. But I need to settle the issue with the security team. This is a possible avenue for our development, where we would throw out Graylog and use Kibana instead. There's no point in using Logstash. Because I can do all of that with rsyslog. And it has a module for writing to Elasticsearch. We are trying to make things work with Graylog. We have even tuned it a bit. But there’s still room for improvement.
About Kafka. Historically, it has been this way. When I came in, it was already there, and logs were already being written to it. We just set up our cluster and moved the logs over. We manage it, and we know how it's doing. Regarding RabbitMQ... we don't get along with RabbitMQ. But we do have it. It's in production, and we've had issues with it. Before the sale, it was patched up and started to work normally. But before that, I wasn't ready to deploy it to production. There's one more thing. Graylog can read AMQP 0.9, while rsyslog can write AMQP 1.0. And there is no solution that can do both. It's either one or the other. So for now, it's only Kafka. But there are nuances there as well. Because omkafka, the version of rsyslog we use, can lose the entire message buffer that it has pulled from rsyslog. For now, we are dealing with this.
Question: You use Kafka because it was already there? Is it not used for any other purposes?
Answer: The Kafka that we had is used by the Data Science team. It's a completely separate project that I unfortunately can't comment on. I am not aware of it. It was under the responsibility of the Data Science team. When they started working with logs, they decided to use it, so as not to set up their own. Now we have upgraded Graylog, and we lost compatibility because it has an old version of Kafka. We had to set up our own. At the same time, we eliminated those four topics for each API. We created one broad topic for all live logs, one broad topic for all staging logs, and simply funnel everything there. Graylog pulls all of this in parallel.
Question: Why is this tweaking with sockets necessary? Have you tried using the syslog log driver for containers?
Answer: At the time we were addressing this issue, our relationship with Docker was tense. It was either Docker 1.0 or 0.9. Docker itself was quite peculiar. Secondly, putting logs into it… I have an unverified suspicion that it passes all logs through itself via the Docker daemon. If one API crashes, the other APIs get stuck because they can't send stdout and stderr. I don't know what this will lead to. I have a gut feeling that we shouldn't use the Docker syslog driver in this instance. Our functional testing department has its own little Graylog cluster for logs. They use Docker log drivers and seem to have everything working fine. But they write GELF directly to Graylog. At the time we were planning all of this, we needed it to simply work. Perhaps later, when someone comes in and says that it has been working fine for ages, we will give it a try.
Question: You handle delivery between data centers using rsyslog. Why not Kafka?
Answer: We actually do both for two reasons. If the channel is completely broken, even our logs in compressed form can't get through. Kafka allows us to simply lose them in the process. This way, we avoid the bottleneck of those logs. In this case, we directly use Kafka. If we have a good channel and want to free it up, we use rsyslog. But in reality, it can be configured to drop what doesn't make it through. Currently, we use rsyslog delivery directly in some places and Kafka in others.
Source: habr.com
