

IntelliJ IDEA today has the most advanced static code analyzer for Java, leaving veteran tools like and . Its numerous "inspections" check code in various aspects, from coding style to typical bugs.
However, since the analysis results are currently displayed only in the developer's IDE local interface, they provide little benefit to the development process. Static analysis as the first step of the build pipeline, its results should determine quality gates, and the build should fail if the quality gates are not met. It is known that TeamCity CI is integrated with IDEA. But even if you are not using TeamCity, you can easily try running IDEA inspections on any other CI server. Let’s see how to do this using IDEA Community Edition, Jenkins, and the Warnings NG plugin.
Step 1. Run analysis in a container and obtain a report
At first glance, launching an IDE (desktop application!) within a CI system that lacks a graphical interface may seem questionable and very cumbersome. Fortunately, IDEA developers have provided the capability to run and from the command line. Moreover, launching IDEA in this mode does not require a graphical subsystem and these tasks can be performed on servers with a text shell.
Inspections are started using the script bin/inspect.sh from the IDEA installation directory. The parameters required are:
- the full path to the project (relative paths are not supported),
- the path to the .xml file with inspection settings (usually found inside the project in .idea/inspectionProfiles/Project_Default.xml),
- the full path to the folder where .xml files with analysis results will be stored.
Additionally, it is expected that
- the path to the Java SDK will be configured in the IDE; otherwise, the analysis will not work. These settings are contained in the configuration file
jdk.table.xmlin the IDEA global configuration folder. The global configuration of IDEA is usually located in the user's home directory by default, but this location in the filein idea.properties. - The analyzed project must be a valid IDEA project, for which some files that are typically ignored will need to be committed to version control, namely:
.idea/inspectionProfiles/Project_Default.xml— analyzer settings, which will clearly be used when running inspections in the container,.idea/modules.xml— otherwise we will get the error ‘This project contains no modules’,.idea/misc.xml— otherwise we will get the error ‘The JDK is not configured properly for this project’,*.iml files— otherwise we will get an error about the unconfigured JDK in the module.
Although these files are usually included in .gitignore, they do not contain any information specific to the developer's environment — unlike, for example, the file workspace.xml, where such information is actually contained, and therefore it should not be committed.
It naturally suggests packaging the JDK along with the IDEA Community Edition into a container in a form ready to be 'aimed' at the analyzed projects. Let's choose a suitable base container, and here’s what our Dockerfile will look like:
Dockerfile
FROM openkbs/ubuntu-bionic-jdk-mvn-py3

ARG INTELLIJ_VERSION="ideaIC-2019.1.1"

ARG INTELLIJ_IDE_TAR=${INTELLIJ_VERSION}.tar.gz

ENV IDEA_PROJECT_DIR="/var/project"

WORKDIR /opt

COPY jdk.table.xml /etc/idea/config/options/

RUN wget https://download-cf.jetbrains.com/idea/${INTELLIJ_IDE_TAR} &&
    tar xzf ${INTELLIJ_IDE_TAR} &&
    tar tzf ${INTELLIJ_IDE_TAR} | head -1 | sed -e 's//.*//' | xargs -I{} ln -s {} idea &&
    rm ${INTELLIJ_IDE_TAR} &&
    echo idea.config.path=/etc/idea/config >> idea/bin/idea.properties &&
    chmod -R 777 /etc/idea

CMD idea/bin/inspect.sh ${IDEA_PROJECT_DIR} ${IDEA_PROJECT_DIR}/.idea/inspectionProfiles/Project_Default.xml ${IDEA_PROJECT_DIR}/target/idea_inspections -v2
Using the option idea.config.path , we made IDEA look for its global configuration in the folder /etc/idea, since the user's home directory in CI conditions is an uncertain thing and often does not exist.
This is what the file copied into the container looks like jdk.table.xml, which specifies the paths to the OpenJDK installed inside the container (a similar file from your own IDEA settings directory can be used as a basis):
jdk.table.xml
Image in its final form .
Before we proceed, let's check the IDEA analyzer running in the container:
docker run --rm -v :/var/project inponomarev/intellij-idea-analyzerThe analysis should complete successfully, and numerous .xml files with analysis reports should appear in the target/idea_inspections subfolder.
There are now no doubts that the IDEA analyzer can run in standalone mode in any CI environment, and we move on to the second step.
Step 2. Displaying and analyzing the report
Receiving a report as .xml files is just half the job; it now needs to be made human-readable. Moreover, its results should be used in quality gates—logic that determines whether an incoming change meets the quality criteria or not.
This will be aided by , which was released in January 2019. With its introduction, many standalone plugins for handling static analysis results in Jenkins (CheckStyle, FindBugs, PMD, etc.) are now marked as obsolete.
The plugin consists of two parts:
- numerous analyzers' message collectors ( which includes all known analyzers from AcuCobol to ZPT Lint),
- and a unified report viewer for all of them.
Among the things that Warnings NG can analyze are Java compiler warnings and warnings from Maven execution logs: although they are constantly present, they are rarely analyzed intentionally. Reports from IntelliJ IDEA are also included in the recognized formats.
Since the plugin is new, it initially works well with Jenkins Pipeline. A build step involving it would look as follows (we simply tell the plugin which report format we recognize and which files to scan):
stage ('Static analysis'){
    sh 'rm -rf target/idea_inspections'
    docker.image('inponomarev/intellij-idea-analyzer').inside {
       sh '/opt/idea/bin/inspect.sh $WORKSPACE $WORKSPACE/.idea/inspectionProfiles/Project_Default.xml $WORKSPACE/target/idea_inspections -v2'
    }
    recordIssues(
       tools: [ideaInspection(pattern: 'target/idea_inspections/*.xml')]
    )
}
The report interface looks like this:
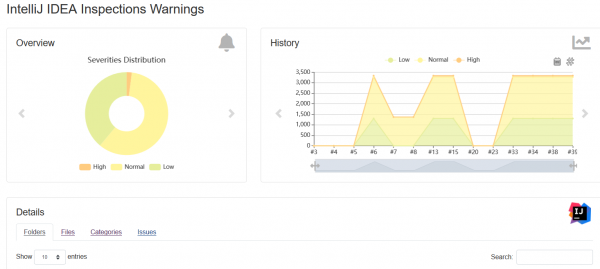
It's convenient that this interface is universal for all recognized analyzers. It contains an interactive diagram showing the distribution of findings by category and a graph illustrating the dynamics of the number of findings. A quick search can be performed in the grid at the bottom of the page. The only feature that didn't work correctly for IDEA inspections is the ability to browse code directly in Jenkins (although for other reports, like Checkstyle, this plugin does it beautifully). It seems to be a bug in the IDEA report parser that needs to be fixed.
Among Warnings NG's capabilities is the ability to aggregate findings from different sources in one report and to program Quality Gates, including a "ramping" on the reference build. Some documentation on programming Quality Gates is available. — however, it's not complete, and you have to look into the source code. On the other hand, if you want full control over what's happening, you can implement the 'ratchet' yourself (see my on this topic).
Conclusion
Before I started preparing this material, I decided to look for: has anyone already written about this topic on Habr? I found only with , where he says:
As far as I know, there is no integration with Jenkins or a maven plugin […] Basically, any enthusiast could connect IDEA Community Edition and Jenkins; many would benefit from it.
So, here we are: two years later, we have the Warnings NG Plugin, and finally, this friendship has come to fruition!
Source: habr.com
