This September, Broadcom (formerly CA) released the new version 20.2 of its DX Operations Intelligence (DX OI) solution. On the market, this product is positioned as an umbrella monitoring system. The system is able to receive and combine data from monitoring systems of various domains (network, infrastructure, applications, databases) from both CA and third-party manufacturers, including open source solutions (Zabbix, Prometheus and others).
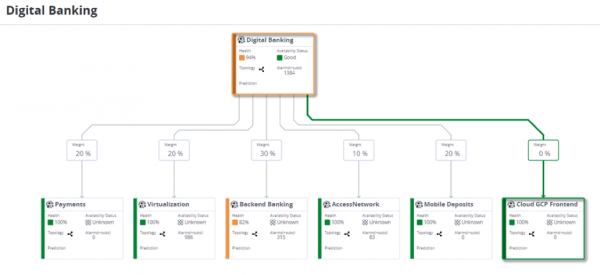
The main function of DX OI is the creation of a full-fledged resource-service model (RSM) based on configuration items (CUs) that fill the inventory database when integrated with third-party systems. DX OI implements Machine Learning and Artificial Intelligence (ML and AI) functions over the data entering the platform, which allows you to evaluate / predict the probability of failure of a specific CI and the degree of impact of a failure on a business service based on a specific CI. In addition, DX OI is a single point of collection of monitoring events and, accordingly, integration with the Service Desk system, which is an indisputable advantage of using the system in unified monitoring centers by duty shifts of organizations. In this article, we will tell you more about the functionality of the system and show the user and administrator interfaces.
DX OI Solution Architecture
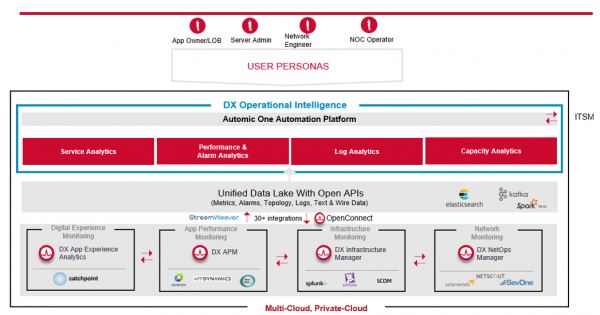
The DX platform has a microservice architecture, installed and running Kubernetes or OpenShift. The following figure shows the components of the solution that can be used as independent monitoring tools or can be replaced with existing monitoring systems with similar functions (there are examples of such systems in the figure) and then connected to the DX OI umbrella. In the diagram below:
- Monitoring of mobile applications in DX App Experience Analytics;
- Application performance monitoring in DX APM;
- Infrastructure monitoring in DX Infrastructure Manager;
- Monitoring network devices in DX NetOps Manager.
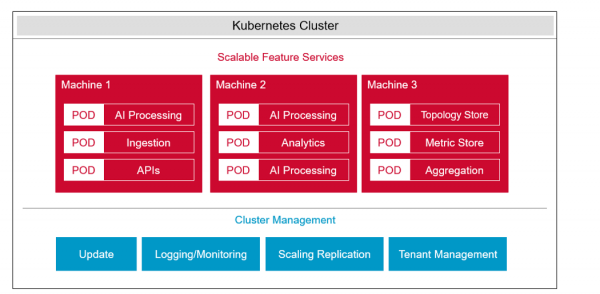
DX components run on a Kubernetes cluster and scale by simply launching new PODs. Below is a top-level solution diagram.
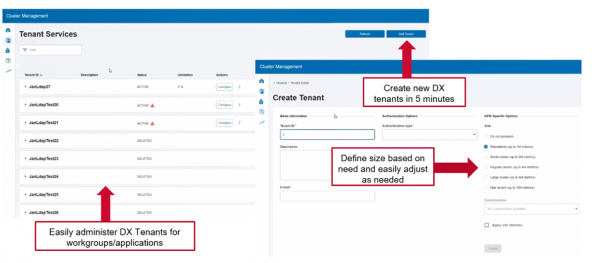
Administration, scaling and upgrading of the DX platform is done in the administrative console. From a single console, you can manage a multi-tenant architecture that can span multiple enterprises or multiple business units within a company. In this model, each facility can be configured individually as a tenant with its own set of configurations.
The Administration Console is a web-based operations and system management tool that provides administrators with a consistent, unified interface for performing monitoring cluster management tasks.
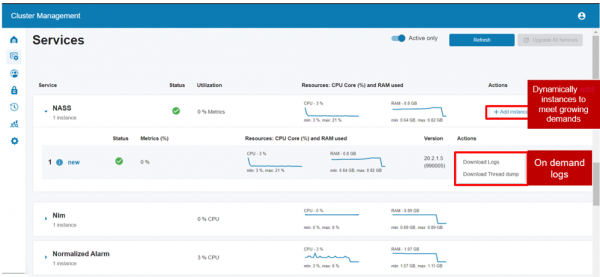
New tenants for business units or enterprises within the company are deployed in minutes. This is an advantage if you want to have a unified monitoring system, but at the same time, at the platform level (and not access rights), delimit monitoring objects between departments.
Resource-service models and monitoring of business services
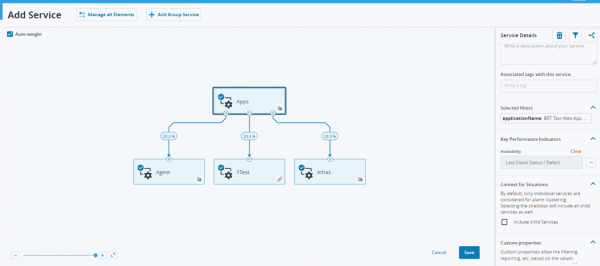
DX OI has built-in mechanisms for creating services and developing classic PCM with the task of the logic of influence and weights between service components. There are also mechanisms for exporting PCM from an external CMDB. The figure below shows the built-in PCM editor (pay attention to the link weights).
DX OI provides a holistic view of key performance indicators for business or IT services at a granular level, including service availability and failure risk prediction. The tool can also provide insight into the impact of a performance issue or a change in the structure of IT components (application or infrastructure) on a business service. The figure below is an interactive dashboard that displays the status of all services.

Let's take a closer look at the Digital Banking service as an example. By clicking on the name of the service, we go to the detailed PCM service. We see that the status of the Digital Banking service depends on the state of infrastructure and transactional subservices with different weights. Working with weights and displaying them is an interesting advantage of DX OI.

Topology is an important element of operational monitoring of the enterprise, allowing operators and engineers to analyze the relationship between components, find the root cause and influence.
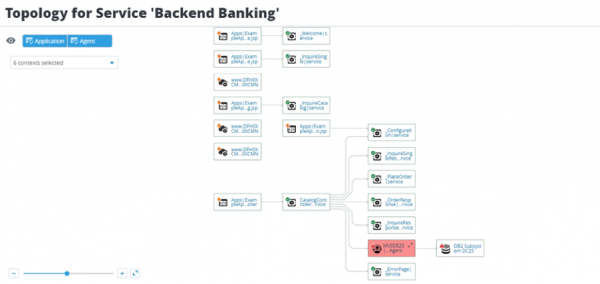
DX OI Topology Viewer is a service that uses topological data from domain monitoring systems that collect data directly from monitoring objects. The tool is designed to search multiple topology storage layers and display a context-specific relationship map. To investigate problems, you can go to the problematic Backend Banking subservice and see the topology and problematic components. Alarm messages and performance metrics can also be analyzed for each component.
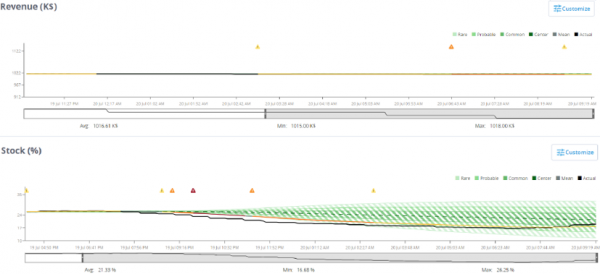
When analyzing the transactional components of Payments (user transactions), we can track business KPI values, which are also taken into account when calculating the availability status and health of the service. An example of a business KPI is shown below:

Event analytics (Alarm Analytics)
Algorithmic noise reduction due to crash clustering
One of the key features of DX OI in event handling is clustering. The mechanism works on all alerts coming into the system to identify patterns based on different contexts and combine them into groups. These clusters are self-learning and do not need to be manually configured.
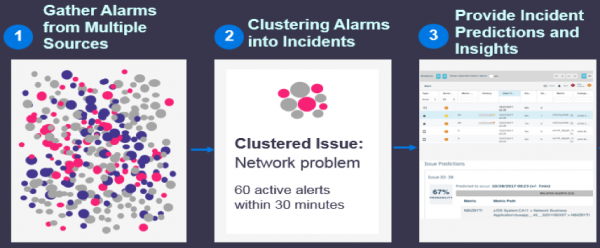
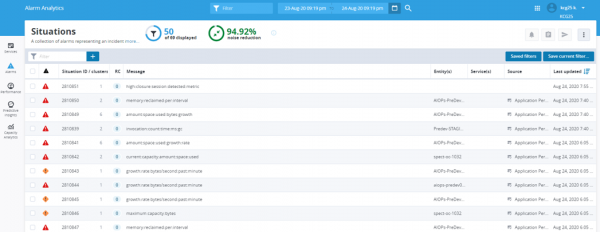
Thus, clustering allows users to combine and group a huge number of events and analyze only those that have a common context. For example, a set of events that represent an incident that affects applications or a data center. The situations are created using machine learning-based clustering algorithms that use temporal correlation, topological relationship, and native language processing for analysis. The figures below show examples of visualization of clustered groups of messages, the so-called Situations Alarms, and Evidence Timeline, which display the main grouping parameters and the process of reducing the number of noise events.

Root problem analysis and crash correlation
In today's hybrid environment, a user transaction can affect multiple systems that are used dynamically. As a result, multiple alerts can be generated from different systems, but related to the same problem or incident. DX OI uses proprietary mechanisms to suppress redundant and duplicate alerts and correlate related alerts for improved detection of critical issues and faster resolution.
Let us consider an example when the system receives numerous emergency messages for different objects (KE) that underlie one service. In case of impact on the availability and operability of the service, the system will generate a service alarm (Service Alarm), indicate and designate the probable root cause (problem CI and alarm message on the CI) that contributed to the decrease in performance or failure of the service. The figure below shows the crash visualization for a Webex service.
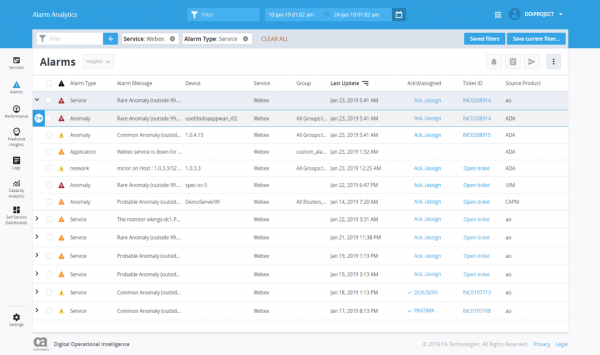
DX OI allows you to work with events through intuitive actions in the web interface of the system. Users can manually assign events to the responsible employee for troubleshooting, reset/acknowledge alerts, create tickets or send email notifications, run automated scripts to resolve an emergency (Remediation Workflow, more on that later). In this way, DX OI allows shift operators to focus on the root alarm message and also help simplify the process of sorting messages into clustered arrays.
Machine algorithms for processing metrics and analyzing performance data
Machine learning allows you to track, aggregate and visualize key performance indicators for any given period of time, which gives the user the following benefits:
- Detection of bottlenecks and performance anomalies;
- Comparison of several indicators for the same devices, interfaces or networks;
- Comparison of the same indicators at several objects;
- Comparison of various indicators for one and several objects;
- Comparison of multidimensional metrics for several objects.
To analyze the metrics entering the system, DX OI uses the functions of machine analytics using mathematical algorithms, which helps to reduce the time when setting static thresholds and generating warnings when anomalies occur.
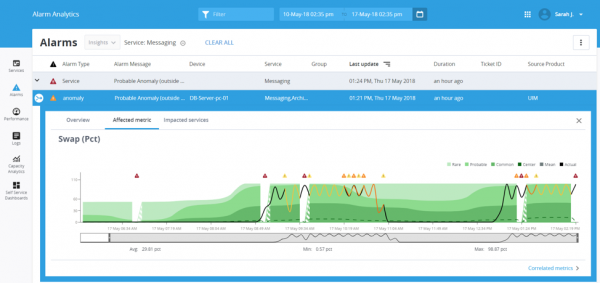
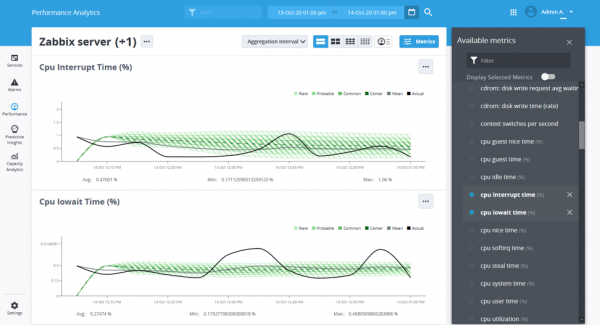
The result of applying mathematical algorithms is the construction of the so-called probability distributions of the metric value (Rare, Probable, Center, Mean, Actual). The figures above and below show the probability distributions.

The two charts above show the following data:
- Actual data (Actual). Actual data is plotted as a solid black line (no alarms) or a colored solid line (alarm condition). The line is calculated based on the actual data for the metric. By comparing the actual data and the median, you can quickly see the variation in the metric. When an event occurs, the black line changes to a colored solid line that corresponds to the severity of the event and displays icons with the corresponding severity above the graph. For example, red for a critical anomaly, orange for a major anomaly, and yellow for a minor anomaly.
- Average value of the indicator (Mean value). The median or mean for a measure is shown as a gray line in the chart. The average value is displayed when there is not enough historical data.
- The median value of the indicator (Center value). The median line is the middle of the range and is shown as a green dotted line. The zones closest to this line are closest to the typical values of the indicator.
- Common data (Common Value). The Total Zone data tracks the closest to the centerline or normal for your metric and is displayed as a dark green bar. Analytical calculations place the total zone one percentile above or below normal.
- probabilistic data. The probability zone data is shown on the graph with a green bar. The system places the probability zone two percentiles above or below normal.
- Rare data. Rare zone data is shown on the graph as a light green bar. The system places a zone with rare metric values three percentiles above or below the norm and signals the behavior of the indicator outside the normal range, while the system generates the so-called Anomaly Alert.
An anomaly is a measurement or event that is inconsistent with the normal performance of a metric. Anomaly detection to identify issues and understand trends in infrastructure and applications is a key feature of DX OI. Anomaly detection allows you to both recognize unusual behavior (for example, a server that responds more slowly than usual, or unusual network activity caused by a hack) and respond accordingly (initiating an incident, running an automatic Remediation script).
The DX OI anomaly detection feature provides the following benefits:
- You don't need to set thresholds. DX OI will independently compare the data and identify anomalies.
- DX OI includes more than ten artificial intelligence and machine learning algorithms, including EWMA (Exponentially-Weighted-Moving-Average) and KDE (Kernel Density Estimation). These algorithms allow you to perform fast root cause analysis and predict future metrics.
Predictive analytics and failure alerts
Predictive Insights is a feature that uses the power of machine learning to identify patterns and trends. Based on these trends, the system predicts events that may occur in the future. These messages indicate that action must be taken before the metric values go beyond the normal range, impacting critical business services. Predictive Insights are shown in the figure below.
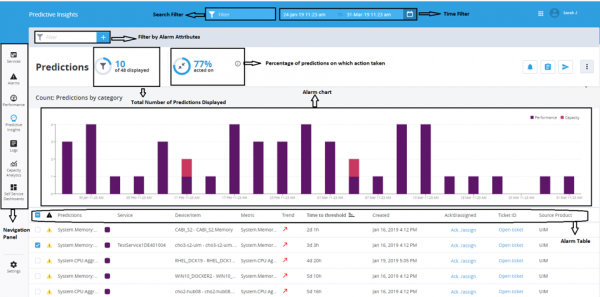
And this is a visualization of predictive alerts for a specific metric.

Forecasting the load of computing power with the function of setting load scenarios
The Capacity Analytics capacity planning feature helps manage IT resources by ensuring that resources are properly sized to meet current and future business needs. You will be able to optimize the performance and efficiency of existing resources, plan and justify any financial investment.
The Capacity Analytics feature in DX OI provides the following benefits:
- Forecasting capacities during peak seasons;
- Determination of the moment when additional resources are required to ensure the quality of the service;
- Purchasing additional resources only when needed;
- Efficient infrastructure and network management;
- Eliminate unnecessary energy costs by identifying underutilized resources;
- Perform resource load estimation in case of a planned increase in demand for a service or resource.
The Capacity Analytics DX OI page (shown below) has the following widgets:
- Resource Capacity Status;
- Controlled groups / services (Monitored Groups / Services);
- Large consumers of resources (Top Capacity Consumers).
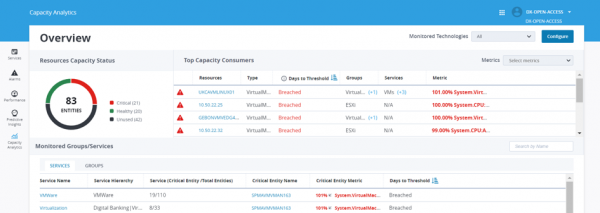
The main Capacity Analytics page shows resource components that are overused and running out of capacity. This page helps platform administrators find overused resources and helps them resize and optimize resources. The state of resources can be analyzed based on color codes and their respective values. Resources are categorized according to their degree of congestion on the resource capacity status page. You can click on each of the colors to see a list of the components in the selected category. Next, a heat map is displayed with all objects and forecasts for 12 months, which allows you to identify resources that are about to be exhausted.
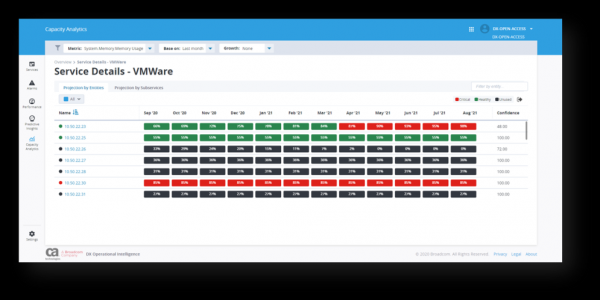
For each of the metrics in Capacity Analytics, you can specify the filters that DX Operational Intelligence uses to make forecasts (figure below).
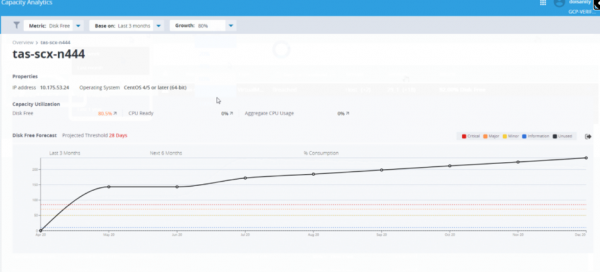
The following filters are available:
- Metric. The metric to be used for the forecast.
- Base on. Selection of the amount of historical data that will be used to build forecasts for the future. This field is used to compare and analyze last month trends, last 3 months trends, yearly trends, etc.
- growth. The expected growth rate of the workload that you want to use to model the capacity forecast. This data can be used to forecast growth beyond forecasts. For example, resource usage is expected to rise another 40 percent due to the opening of a new office.
Log analysis
The DX OI log analysis feature provides:
- collection, aggregation of logs from different sources (including those obtained by agency and agentless methods);
- parsing and data normalization;
- analysis for compliance with the set conditions and generation of events;
- correlation of events based on logs, including events received as a result of IT infrastructure monitoring;
- data visualization based on analysis in DX Dashboards;
- conclusions about the availability of services based on the analysis of data from the logs.
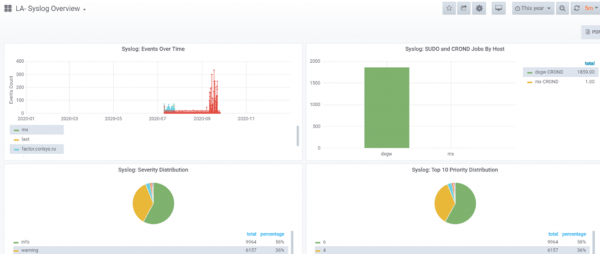
Collection of logs using an agentless method is performed by the system for Windows Event logs and Syslog. Agent-based way to collect text logs.
Automated Emergency Resolution Function (Remediation)
Automated actions to correct the emergency (Remediation Workflow) allow you to solve problems that caused the generation of an event in DX OI. For example, if a CPU usage problem generates an alarm, the Remediation Workflow solves the problem by restarting the server that has the problem. The integration between DX OI and the automation system allows remediation processes to be triggered from the event console in DX Operational Intelligence and tracked in the automation system console.
After integrating with an automation system, you can trigger automatic actions to correct any emergency in the DX OI console from the context of an alarm. You can view recommended actions along with information about confidence percentages (the likelihood that the situation will be resolved by taking the action).

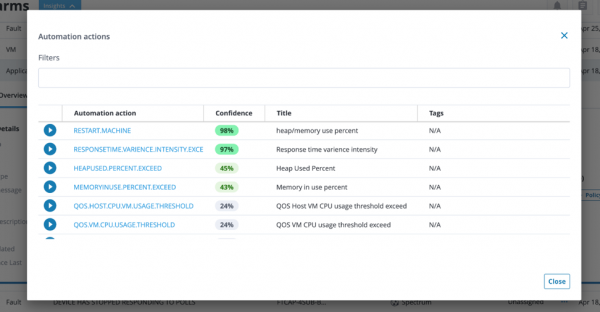
Initially, when there are no statistics on the results of the Remediation Workflow, the recommendation engine suggests candidates based on keyword searches, then the machine learning results are used, and the engine begins to recommend a heuristic-based remediation technique. As soon as you begin to evaluate the results of the received hints, the accuracy of the recommendations will improve.
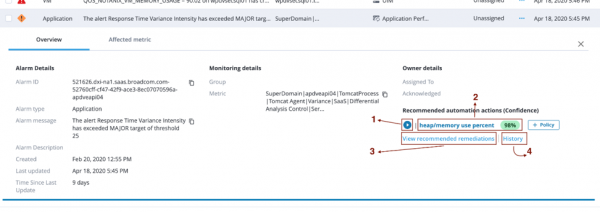
An example of user feedback: the user chooses whether they like or dislike the proposed action, and the system takes this choice into account when making further recommendations. Like/dislike:

The recommended corrective actions for a particular alarm are based on a combination of feedback that determines if the action is acceptable. DX OI comes with ready-to-use integration with Automic Automation.
Integration of DX OI with third-party systems
We will not dwell on the integration of data from native Broadcom monitoring products (DX NetOps, DX Infrastructure Management, DX Application Performance Management). Instead, let's look at how data from third-party 3rd-party systems is integrated and consider an example of integration with one of the most popular systems - Zabbix.
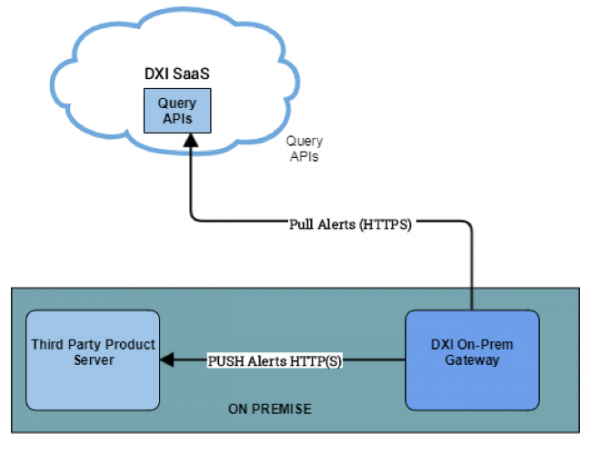
For integration with third-party systems, the DX Gateway component is used. DX Gateway consists of 3 components - On-Prem Gateway, RESTmon and Log Collector (Logstash). You can install all 3 components or just the one you need by changing the general configuration file when installing DX Gateway. The figure below shows the DX Gateway architecture.
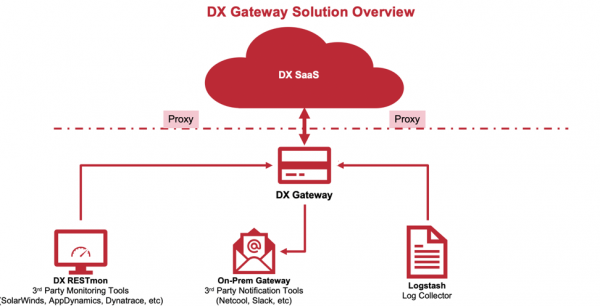
Let's consider the purpose of the DX Gateway components separately.
On-Prem Gateway. This is an interface that collects alarms from the DX platform and sends alarm events to third party systems. The On-Prem Gateway acts as a poller that periodically collects event data from the DX OI using the HTTPS request API, then sends alerts to a third party server that is integrated with the DX platform using webhooks.
DX Log Collector receives syslog from network devices or servers and uploads them to OI. DX Log Collector allows you to separate the software that generates messages, the system that stores them, and the software that reports and analyzes them. Each message is tagged with an object code indicating the type of software generating the message and is assigned a severity level. All of this can then be viewed in DX Dashboards.
DX RESTmon integrates with third-party products/services via REST API and passes data to OI. The figure below shows the operation of DX RESTmon using the example of integration with Solarwinds and SCOM monitoring systems.
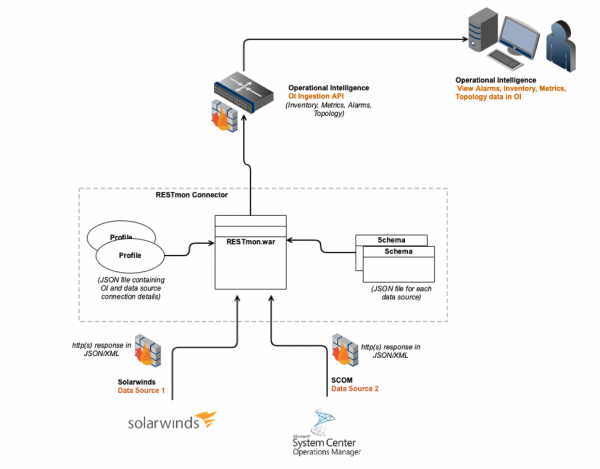
Key features of DX RESTmon:
- Connect to any third party data source to receive data:
- PULL: connecting and retrieving data from public REST APIs;
- PUSH: data flow to RESTmon via REST.
- Support for JSON and XML formats;
- Receive metrics, alerts, groups, topology, inventory, and logs;
- Ready-made connectors for various tools/technologies, it is also possible to develop a connector to any source with an open API (list of boxed connectors in the figure below);
- Support for basic authentication (default) when accessing the Swagger interface and API;
- HTTPS support (default) for all incoming and outgoing messages;
- Support for incoming and outgoing proxies;
- Powerful text parsing capabilities for logs received via REST;
- Customizable parsing with RESTmon for efficient parsing and visualization of logs;
- Support for extracting information about groups of devices from monitoring applications and downloading to OI for analysis and visualization;
- Support for regular expression matching. This can be used to parse and match log messages received via REST, and to generate or close events based on certain regular expression conditions.
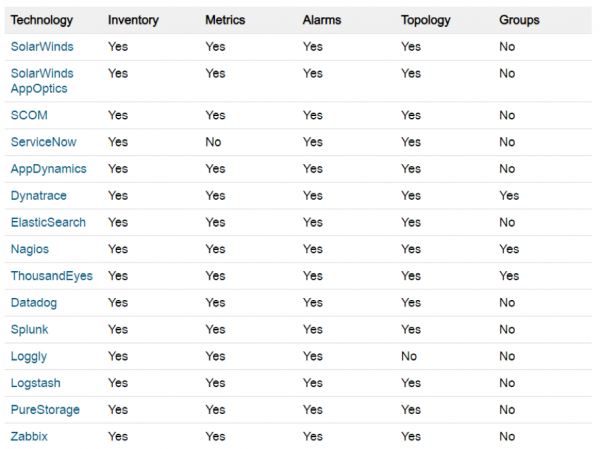
Now let's look at the process of setting up DX OI integration with Zabbix via DX RESTmon. Boxed integration takes the following data from Zabbix:
- inventory data;
- topology;
- Problems;
- metrics.
Since the connector for Zabbix is available out of the box, all that needs to be done to set up the integration is to update the profile with the Zabbix server API IP address and account, and then upload the profile through the Swagger web interface. An example is in the next two figures.
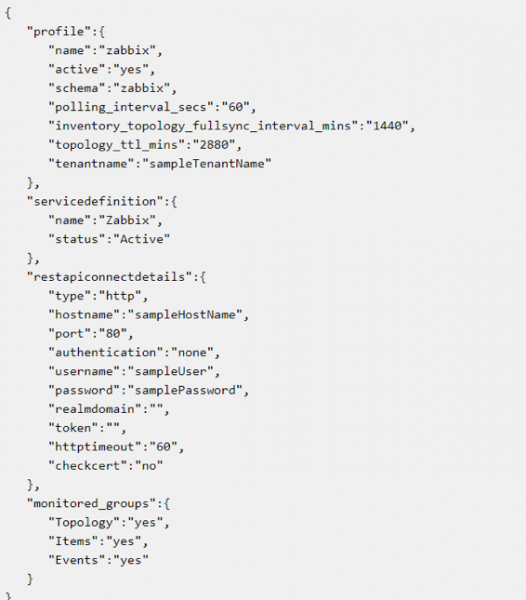
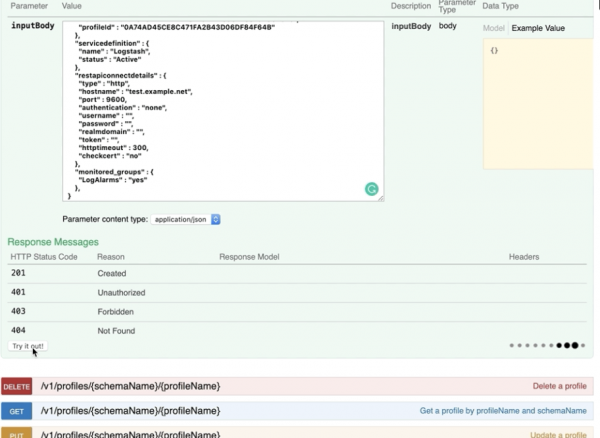
After configuring the integration, the DX OI analytical functions described above will be available for data coming from Zabbix, namely: Alarm Analytics, Performance Analytics, Predictive Insights, Service Analytics and Remediation. The figure below shows an example of analyzing performance metrics for objects integrated from Zabbix.
Conclusion
DX OI is a state-of-the-art analytics tool that will provide significant operational efficiency to IT departments, allowing you to make faster and more correct decisions to improve the quality of IT services and business services through cross-domain contextual analysis. For application owners and business units, DX OI will calculate availability and service quality not only in the context of IT technology metrics, but also business KPIs derived from end-user transactional statistics.
If you would like to learn more about this solution, please apply for a demo or pilot on our website.
Source: habr.com


