

Statistics for 24 hours after the honeypot was installed on a Digital Ocean node in Singapore
Pew pew! Let’s start right away with the attack map
Our super cool map shows unique ASNs that connected to our Cowrie honeypot in the last 24 hours. Yellow corresponds to SSH connections, while red indicates Telnet. Such animations often impress the company's board of directors, allowing for more funding for security and resources. However, the map has some value, clearly demonstrating the geographical and organizational distribution of attack sources on our host over just 24 hours. The animation does not reflect the volume of traffic from each source.
What is the Pew Pew map?
Pew Pew Map — this is , typically animated and very beautiful. It’s a trendy way to sell your product, famously used by Norse Corp. The company ended poorly: it turned out that the pretty animations were their only merit, and they used fragmentary data for analysis.
Made with Leafletjs
For those who want to develop an attack map for a large screen in the operations center (your boss will love it), there is a library . We combine it with the , Maxmind GeoIP service — .
WTF: what is the Cowrie honeypot?
A honeypot is a system that is placed on the network specifically to attract attackers. Connections to the system are usually illegal and allow the detection of the attacker through detailed logs. The logs not only store regular connection information but also session information that reveals the attacker’s tactics, techniques, and procedures (TTP) .
is designed for recording SSH and Telnet connections. Such honeypots are often exposed to the internet to track the tools, scripts, and hosts of attackers.
My message for companies that think they aren't being attacked: 'You are not looking hard enough.'
— James Snook

What’s in the logs?
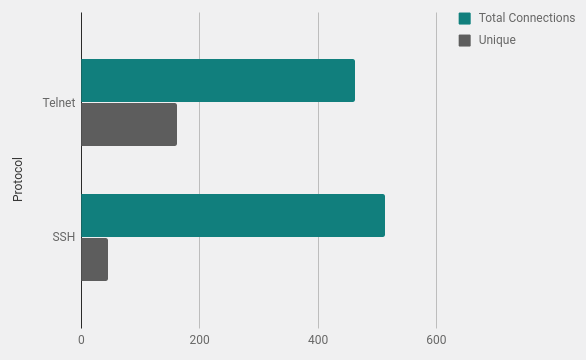
Total number of connections
Connections from numerous hosts made repeated connection attempts. This is normal since attacking scripts contain a list of credentials and try several combinations. The Cowrie honeypot is configured to accept certain combinations of username and password. This is set in the user.db file.
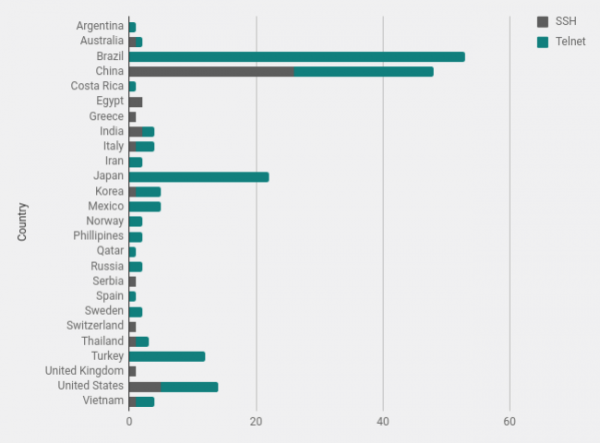
Geography of attacks
According to Maxmind's geolocation data, I calculated the number of connections from each country. Brazil and China lead by a large margin, frequently generating significant noise from scanners.
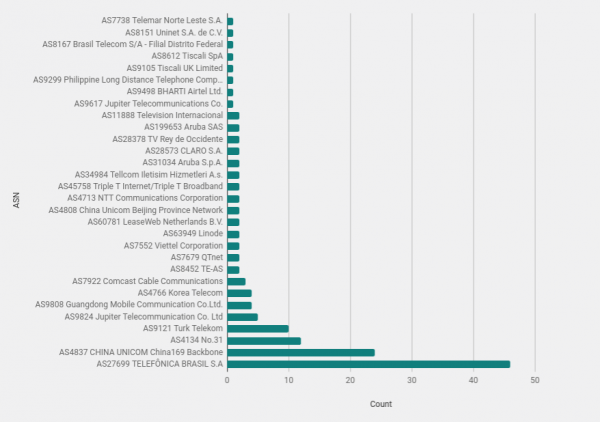
Network Block Owner
Studying the owners of network blocks (ASN) can reveal organizations with a high number of attacking hosts. Of course, in such cases, it is always essential to remember that many attacks originate from compromised hosts. It is reasonable to assume that most attackers are not foolish enough to scan the network from a home computer.
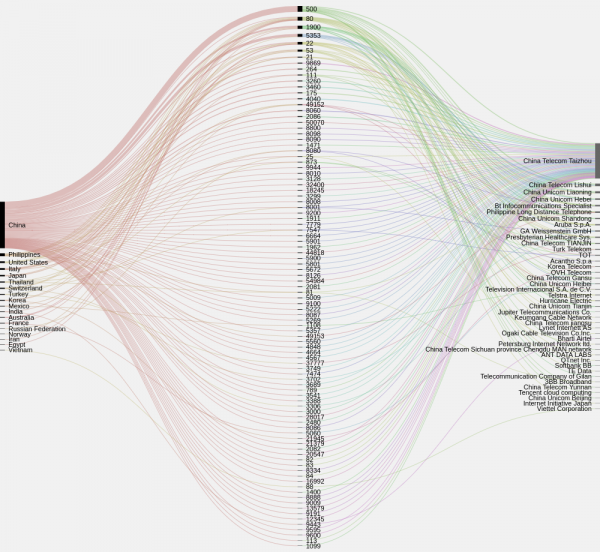
Open Ports on Attacking Systems (data from Shodan.io)
Running an IP list through the excellent quickly identifies systems with open ports and what those ports are. The figure below shows the concentration of open ports by country and organization. It could reveal blocks of compromised systems, but within the small sample nothing remarkable is visible except for a large number of open ports 500 in China..
An interesting finding is the significant number of systems in Brazil that have ports 22, 23 closed. or Other ports, according to Censys and Shodan. Apparently, these are connections from end-user computers.
Bots? Not necessarily.
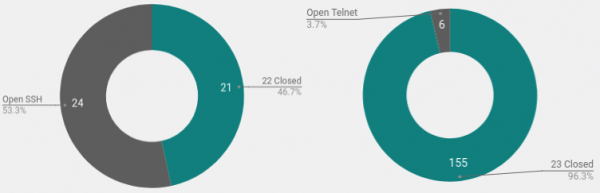
Data For ports 22 and 23 that day showed strange behavior. I assumed that most scans and password attacks come from bots. The script spreads through open ports, guessing passwords, and from a new system copies itself and continues spreading using the same method.
However, here we see that only a small number of hosts scanning telnet have port 23 exposed. This indicates that the systems are either compromised in another way or the attackers are executing scripts manually.
Home Connections
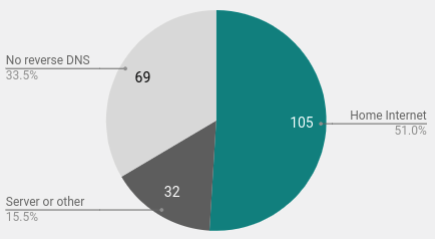
Another interesting finding was the significant number of home users in the sample. Using reverse lookup, I identified 105 connections from specific home computers. For many home connections, the DNS reverse lookup displays host names with words like dsl, home, cable, fiber, and so on.
Learn and Explore: Set Up Your Own Honeypot
Recently, I wrote a brief manual on how to As mentioned, in our case we used a Digital Ocean VPS located in Singapore. The analysis over 24 hours cost literally a few cents, and the system setup took 30 minutes.
Instead of running Cowrie on the internet and catching all the noise, you can benefit from a honeypot in a local network. Just set up notifications if requests come to certain ports. This could be either an attacker within the network, a curious employee, or a vulnerability scan.
Conclusions
After observing the actions of attackers over a day, it becomes clear that it is impossible to pinpoint a clear source of attacks to a specific organization, country, or even operating system.
The wide distribution of sources shows that the scanning noise is constant and not associated with a specific source. Anyone working on the internet must ensure that their system has several layers of security.A common and effective solution for SSH is to move the service to a random high port. This does not eliminate the need for strict password protection and monitoring, but it at least ensures that logs are not constantly filled with scanning activity. Connections to a high port are more likely to be targeted attacks that may interest you.
Often, open telnet ports are found on routers or other devices, making them hard to easily move to a high port. and is the only way to ensure these services are protected by a firewall or disabled. Whenever possible, avoid using Telnet altogether, as this protocol is not encrypted. If it is absolutely necessary, monitor it closely and use strong passwords.
Source: habr.com
