

As of December 31, 2019, we had 124,956 operational hard drives. Among them, 2,229 were boot drives and 122,658 contained data. In this review, we will examine the failure statistics for data drives. We will also look at the 12 TB and 14 TB drive versions and the new 16 TB drives, which we have actively used since the beginning of the fourth quarter of 2019.
Statistics for 2019
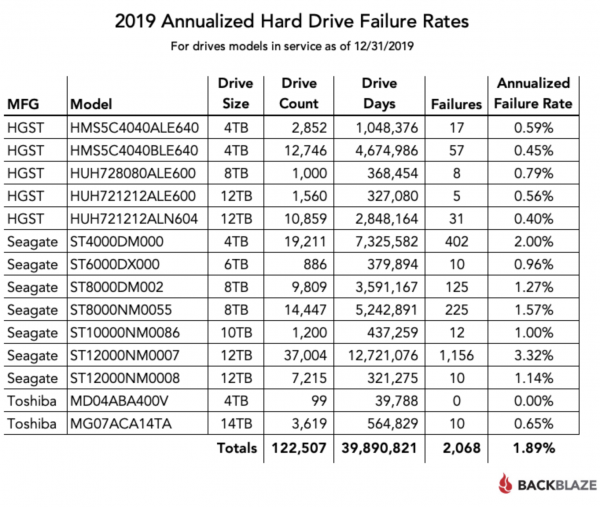
By the end of 2019, we monitored 122,658 hard drives used for data storage. We excluded drives that were used for testing and those that had not accumulated approximately 5,000 drive-days (per model) during the fourth quarter. Thus, we collected data based on 122,507 hard drives. The table below displays our statistics:
Notes and Observations
151 hard drives (122,658 minus 122,507) were not included in the statistics. These drives were used for testing or did not accumulate a total of 5,000 drive-days during the fourth quarter of 2019. Therefore, we remove from the statistics those drives which, in our opinion, have not been in service long enough to draw any conclusions.
The only flawless drive for 2019 was the 4 TB Toshiba, model: MD04ABA400V. This is an excellent result, but since we had relatively few such drives, a failure of just one would yield a rate of around 0.92%. Still good, but no longer 0%.
The Toshiba 14 TB model MG07ACA14TA shows very good results with a 0.65% AFR and stands alongside drives from HGST. Seagate's 6 TB and 10 TB models consistently maintain rates of 0.96% and 1.00%, respectively.
The AFR for all drives in 2019 was 1.89%, which is significantly higher than in 2018. We will discuss this further later.
Beyond the Statistics — 'Hidden' Drive Models
Many models did not make it into our 2019 statistics because they did not operate for a sufficient amount of time. We want to talk about these models and how we use them.
Seagate 16 TB
In the fourth quarter of 2019, we began qualifying Seagate disks with 16 TB, model: ST16000NM001G. By the end of the fourth quarter, we had 40 drives, totaling 1,440 drive-days, significantly below the threshold of 5,000 days for our 2019 statistics. There were no failures among these drives in the fourth quarter. If they pass our qualification successfully, they will be used for our this year.
Toshiba 8 TB
In Q4 2019, there were 20 Toshiba 8 TB drives, model: HDWF180. These drives operated for two years. In the fourth quarter, they had only 1,840 working days, which is below the threshold for statistics, but their lifespan totals 13,994 days with only one drive failure, giving us an AFR of 2.6%. We like these drives, but when we could purchase them in the quantities we needed, they cost as much as the 12 TB drives. More capacity, same price. Given that we are transitioning to 16 TB drives and above, we are unlikely to purchase these drives in the future.
HGST 10 TB
There are 20 HGST 10 TB drives in operation, model: HUH721010ALE600. These drives have been in use for just over a year. They are in the same storage as the 10 TB Seagate drives in Backblaze. Over 4 quarters, the HGST drives have operated for only 1,840 days, and since installation — 8,042. There have been 0 (zero) failures. As with the Toshiba 8 TB drives, acquiring more of the 10 TB version is unlikely.
Toshiba 16 TB
You won’t find them in the Q4 statistics, but in Q1 2020, we added 20 Toshiba 16 TB drives, model: MG08ACA16TA. They have operated for a total of 100 days, so it is too early to talk about anything other than the statistics for Q1 2020.
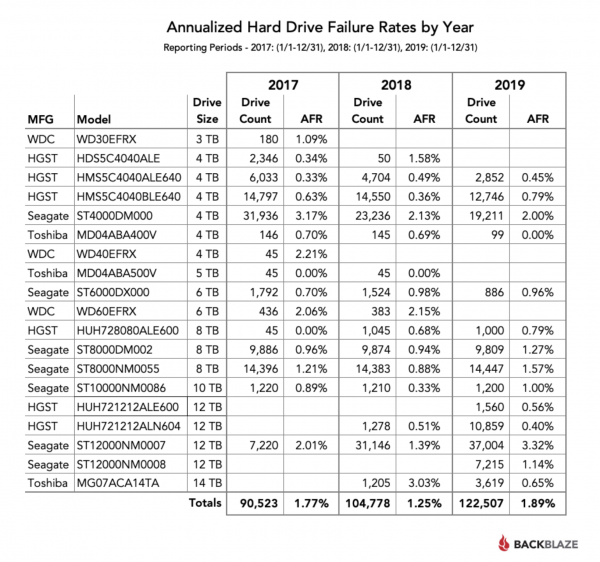
Comparison of hard drive statistics for 2017, 2018, and 2019.
The table below compares the annual failure rates (AFR) for each of the last three years:
AFR increase in 2019
The overall AFR for 2019 has significantly risen. The AFR increased for 75% of models from 2018 to 2019. This growth can be attributed to two main factors. First, the entire line of 8 TB drives is experiencing a "mid-life crisis" as they age. The highest AFR is seen in the 8 TB group of disks. Despite such a high AFR, there’s no need for excessive concern. The reason is that these drives have accumulated ¼ of the days recorded in our statistics, and even slight changes can impact them. The second factor is the Seagate 12 TB drives; this issue is actively being addressed within the project , as previously reported.
Migration is slowing down, yet growth continues.
In 2019, we added 17,729 new network drives. In 2018, most of the 14,255 added drives were used for migration purposes. In 2019, less than half of the new drives were intended for migration, while the rest were used for new systems. In 2019, we decommissioned 8,800 drives totaling 37 petabytes and replaced them with 8,800 drives, all 12 TB, which totals about 105 petabytes. Then in 2019, we added another 181 petabytes for data storage using 12 and 14 TB drives.
Diversity
The diversity of manufacturers for drive brands slightly increased in 2019. In 2018, Seagate drives made up 78.15% of the drives, but by the end of 2019, this figure decreased to 73.28%. HGST increased from 20.77% in 2018 to 23.69% in 2019, while Toshiba rose from 1.34% in 2018 to 3.03% in 2019. In 2019, there were no drives with the Western Digital branding in the data center, as WDC was rebranding the new HGST drives.
Lifetime Statistics
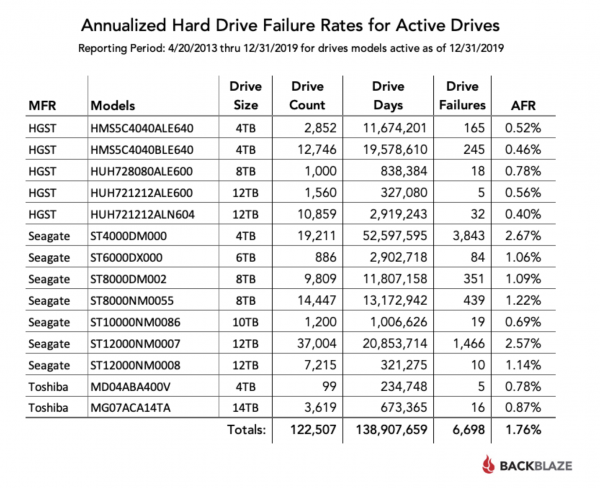
While comparing annual hard drive failure rates over several years is an excellent way to identify trends, we also examine the annual failure rates of our hard drives over their entire lifespan. The diagram below shows the annual failure rate of all drive models in production as of December 31, 2019:
Data
The complete dataset is available on .
Source: habr.com
