

Who are we and what were the project's prerequisites?
Good day, my name is Vladimir Lazarev, I am the head of the BI integrator . We create visual reports for businesses on marketing, sales, finance, and logistics based on leading analytics platforms Qlik Sense, Power BI, Tableau.
In BI platforms, the visual aspect is crucial. If you have looked at dozens of demo reports from BI systems and do not like the appearance of a particular platform, you are unlikely to implement it, even if you are satisfied with the price and technical specifications. From this arises the need to see the same data in different analytical platforms to allow for comparison.
And preferably, the data should be interesting… 🙂
Where did the idea for this report come from?
Several years ago, the Higher School of Economics published an article about the pricing formation for the services of women with low social responsibility in Moscow. This was based on aggregated data from the analysis of 1,800 surveys. We found the data underlying these conclusions by the sociologists of HSE interesting. So we decided to explore this topic.
Key ideas:
- To show not only the surface conclusions but also the data on which they are based;
- To allow interested parties to independently analyze patterns, formulate hypotheses, and verify them.
- The study should include a large sample of surveys to enhance reliability;
- To show not only the 'market supply' but also the demand based on statistical data from search engines;
Data sources:
- SQL database of surveys*, formed based on one site that is among the top three in search results on Yandex and Google.
- Excel file with relevant** queries for the subject area analysis.
- Excel file with historical frequency of queries in the Yandex search engine.
- Excel file with query frequency in the Google search engine.
* A parser was used to collect the information. Data parsing was done as a one-time action.
** The tool used for selecting relevant queries was
Business roles & USER story
In typical projects, we always clarify who will use the analytics and what questions (direct or indirect) the person wants to find answers to.
However, there's a catch — this project has no client. So we had to invent three roles and their questions.
So the roles we defined are as follows:
- A young woman of low social responsibility
- A website administrator with profiles
- A property owner looking to rent
A young woman of low social responsibility
‘Indie’ Elvira is 25 years old. She looks good; acquaintances estimate her age to be around 19-20 years. She is into fitness, visits a tanning salon, eats healthily, has good manicures, and takes care of herself. She is used to living well and doesn't deny herself much. However, this lifestyle requires considerable money. She believes that an office job isn’t for her. She enjoys sex and sees nothing shameful in this activity. With an economic education and an analytical mindset, she has approached the process of determining pricing and the list of services with a pragmatic perspective. Elvira decided to analyze the data using a BI platform.
Goal: to identify key points in order to remain competitive and earn more.
She is interested in the following questions:
- At what price do ‘colleagues’ with similar parameters (height, weight, bust, age) sell their hours in the area where Elvira lives? Is there any sense in finding an apartment option in another district of Moscow for the same amount, but with a higher average check or less competition?
- Should she exaggerate or underestimate her age in the profile?
- Is there an economic rationale for increasing her breast size from 2 to 4, and how quickly will the investments in surgery pay off?
The website owner with profiles
Meet Felix Albertovich — the owner of the website with profiles. A commanding, charming 45-year-old man with great communication skills and a rich background in marketing and beyond. He has filled the site with numerous profiles of different girls, ensuring good traffic to this resource through SEO promotion. Currently, he earns money from paid placements of profiles on the site.
Goal: to understand society's requests and identify promising directions for working with his site.
By contacting a business analytics agency, he expects to receive the following answers:
- What does the typical 'indie' look like?
- What queries do users make in search engines?
An enterprising self-employed citizen renting out an apartment
Mitya is an adventurer, keeping pace with the times, with a thorough approach to business. He is used to relying on numbers and statistics. Mitya owns an apartment in the Central Administrative District of Moscow. He wants to find ways to earn more money from his asset.
Goal: to find a new, more effective model for using his apartment
Key questions:
- If renting an apartment to a girl of low social standing not for a fixed amount but for a percentage of income, can this approach yield more profit?
Managerial insights from Elvira
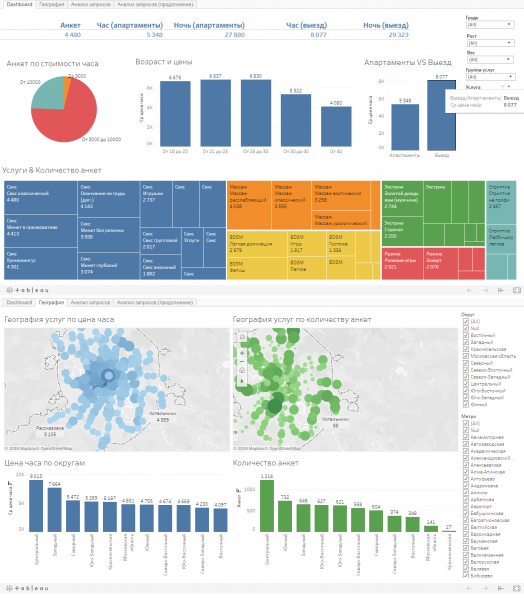
Elvira noticed that 'colleagues' with similar parameters for age, breast size, height, and weight offer the same rates — 4080 to 4930 rubles/hour. With the exception of the 'Western' and 'Central' districts.
Competition is minimal in the 'Moscow region,' with only 20 profiles, and the cost of renting accommodation is almost half that of any administrative district in Moscow while maintaining the hourly rate.
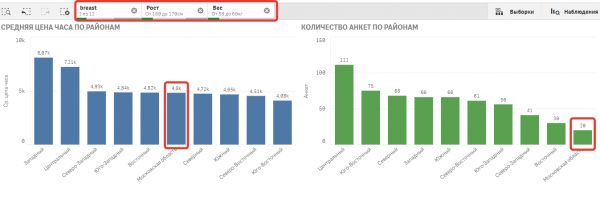
At the same time, Elvira would like to sell her services at a higher price over time, so she created a duplicate profile, stating her location in the Western district and working exclusively for night calls. If there are enough offers, she will move to that area.
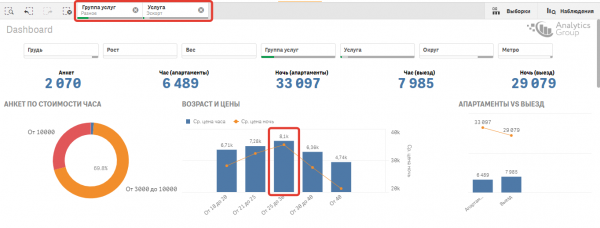
She listed her actual age as 25, as she noticed that the maximum price for a night was indicated in profiles in the 25 to 30 age category. A filter was established for priority services.
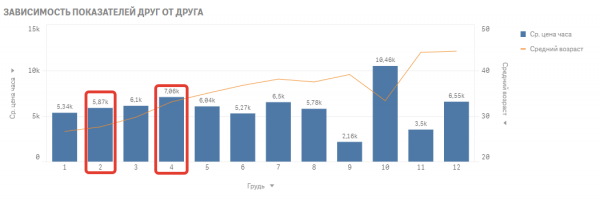
Regarding the feasibility of increasing breast size from 2 to 4, Elvira calculated:
- Her hourly rate increases by 1,190 (7,060 — 5,870 = 1,190).
- The cost of breast augmentation surgery is 300,000 rubles.
- Thus, the investment in breast augmentation will pay off after 252 person-hours. With a workload of 5 hours a day, this amounts to 50 working days.
Managerial insights from Felix
Felix Albertovich first decided to understand the typical 'indie' profile. So he saw:
- Average age: 29.8 years
- Average breast size: 2.8
- Average height: 168 cm
- Average weight: 57 kg
- Average clothing size: 44
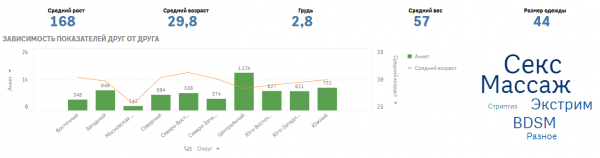
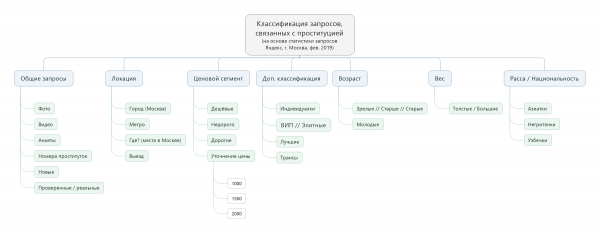
Felix Albertovich then decided to analyze search queries in search engines. Previously, he had already categorized key queries into groups, but we lacked an understanding of the weight of each keyword and its query statistics.
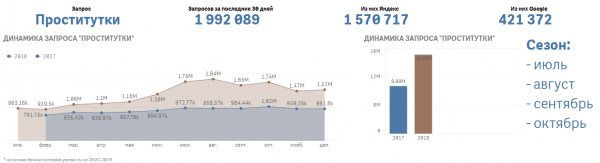
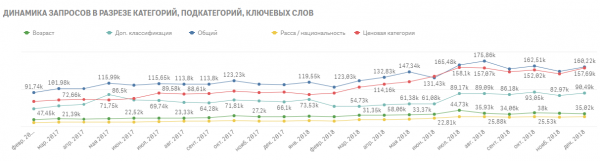
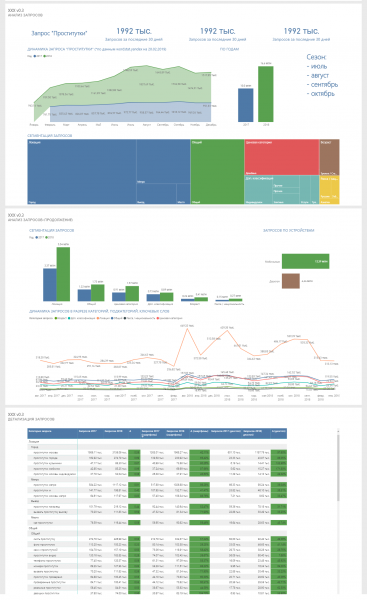
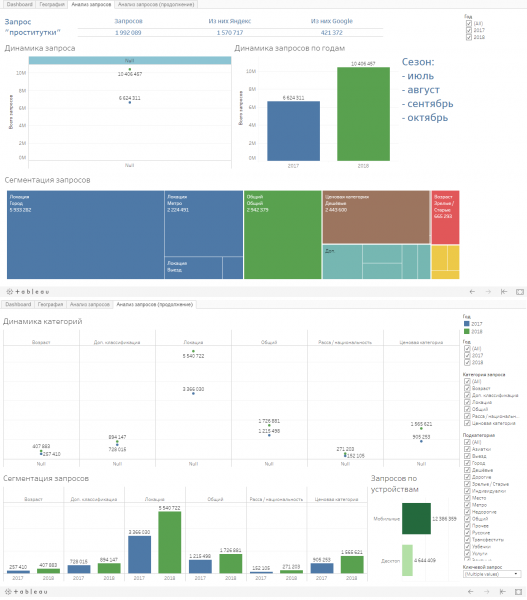
In the analytical report, Felix saw a steady growth in the number of queries. In 2018, compared to 2017, the number of queries increased by 60% (from 9.99 million to 16.59 million).
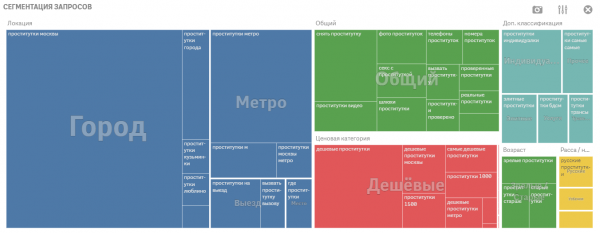
As expected, most queries are location-related. The second category consists of general queries, and the third is price classification. This prompted Felix to utilize dynamic content on the site, depending on the search query that brought the user to it.
He also noticed a significant dominance in search queries coming from mobile phones—almost three times more. Therefore, he assigned his web developer to check the quality of the site's display on mobile devices.
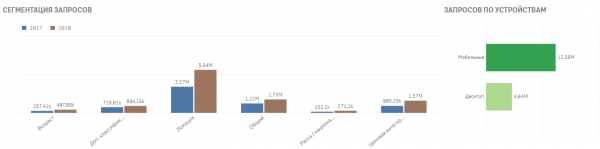
An interesting point is that certain groups of queries are growing faster than others.
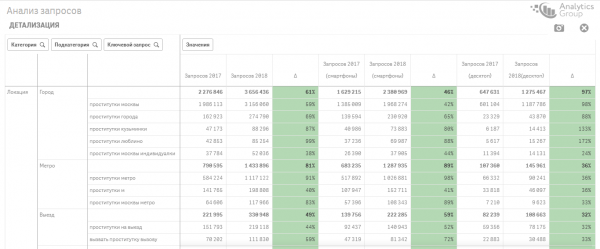
For instance, the 'Price Category'—the subcategory 'Cheap' grew by 74% (compared to the average growth of 60%). Additionally, specific keywords like 'the cheapest *****' increased by 113% and '**** uzbeck girls' grew by 120%. However, Felix looks at this data considering both the percentage ratio and the absolute numbers.
Management conclusions of Mitya
Mitya has an apartment in the Central Administrative Okrug of Moscow and wants to rent it out. Such an apartment rents for 100,000 to 120,000 rubles on the market. However, he wants to earn more. Therefore, he decided to rent the apartment 'indie' for a percentage of the income. For them, this means less risk of undesirable reactions from the apartment owner, and for him, more income from the apartment.
Mitya hypothesized that girls who sell their hour at a higher price would potentially bring him higher income. He has an apartment in the Central Administrative Okrug, so he first looked at the budgets that girls typically ask for their hour in the area.
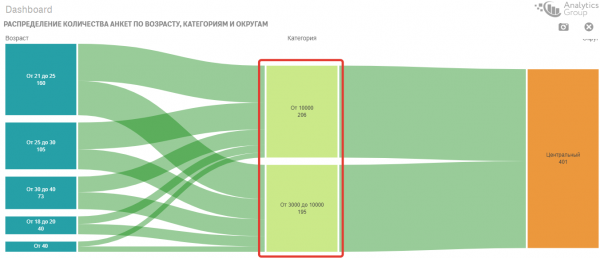
The majority of profiles (206) sell their hour in the Central Administrative Okrug for 10,000 rubles. Then he sorted the profiles that were not located in the Central Administrative Okrug but sell themselves for a similar price. This is the audience he will sort on the site, with the aim of calling them and offering a different rental scheme for the apartment, but in the Central Administrative Okrug.
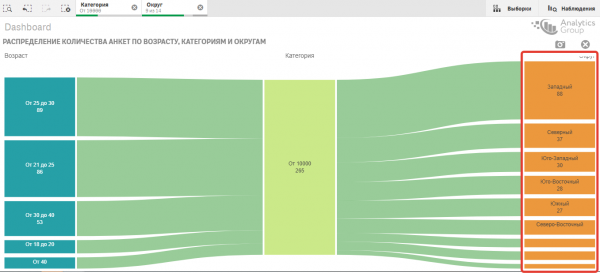
With an average of 3 hours a day of sales from this audience, the total revenue per month amounts to: 11,203 * 3 hours * 30 days = 1,008,270 rubles/month.
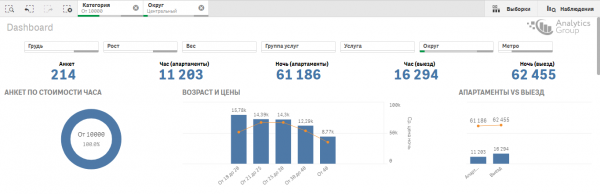
If he is to receive 20%, it means the apartment will sell for more than 200,000 rubles/month.
In his calculations, Mitya did not take into account the income from additional services:
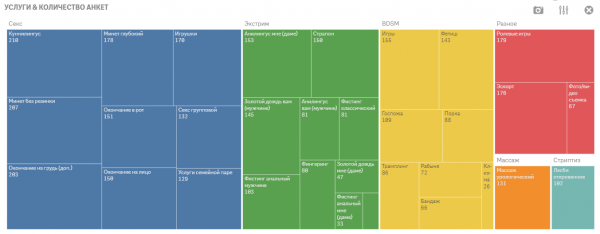
Conclusion
In conclusion to this article, it should be noted that the subject area of the analysis is quite controversial. Undoubtedly, this topic is a societal issue. We intentionally wrote this article with humor, and the 'Management Conclusions' were intentionally crafted with a touch of absurdity to make the information easier to digest, but we hope it encourages reflection on the trends.
In this regard, the analytical platform allows us to see the real picture like nothing else; just numbers that should be followed by the right human actions.
In this example, we demonstrated that any topic or business and its metrics can be analyzed, creating hypotheses based on facts. This is especially relevant when there is a lot of data, when it's located in different sources, and consolidating it into a unified picture takes a lot of time. This is pertinent for marketing, sales, finance, logistics, and inventory accounting. If you have a need, reach out, we'd be happy to discuss possible solutions.
Screenshots of Microsoft Power BI
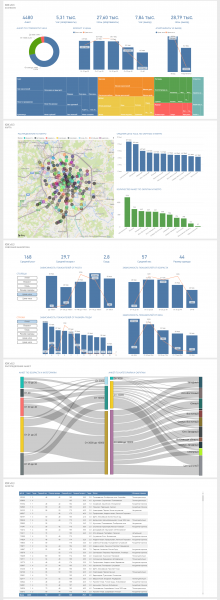
Screenshots of Tableau
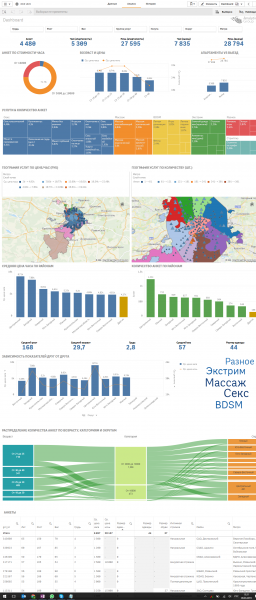
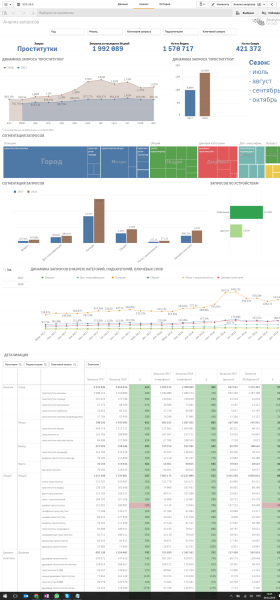
Screenshots of Qlik Sense
Source: habr.com
