

Recently, I found myself facing the problem of choosing an apartment, and of course, the first thing I did was to find out what is happening in the real estate market. As often happens, half of the experts say that real estate prices will rise, while the other half claims that prices will fall. In the end, I decided to figure it out myself, and here’s what I discovered.
©
To understand how prices have changed recently, I needed to find actual sale prices for real estate. Prices from targeted websites like or are not suitable since apartments there usually sell at a discount and it’s impossible to learn the actual sale price. That’s when I noticed a real estate website where I could view the actual prices that apartments were bought for. I’m talking about the site , more details can be read in the review. In short, this organization deals with the sale of apartments under a leaseback agreement at auctions.
To find out the prices in various areas of Moscow, as well as to see which apartments are more frequently traded, where purchases are closer to the starting price, and where prices might change significantly. For this, I first parsed the data from the site , the data is divided into two types: completed and uncompleted auctions, with apartments that were not sold potentially appearing in both categories.
I compiled the parsed data into a table for clarity:
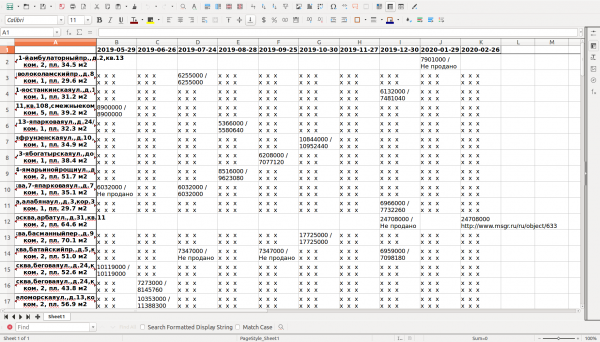
The table includes data from the last 10 auctions.
In the table above, column ‘A’ contains information about auction apartments (addresses without spaces and capital letters due to differences in the original data), the first row lists the dates of upcoming and completed auctions. Sold apartments are filled with ‘xxx’ for each row (this is done to understand which apartments may be available in upcoming unannounced auctions), the cell's top row indicates the starting price, and the bottom row shows the sale price. For the upcoming auctions, a link with the apartment’s description is provided in the cells.
This table also reveals some interesting patterns; for instance, if an apartment does not sell after two auctions, the price will typically be lowered at the third auction, and this decrease continues every two auctions. However, a larger sample shows exceptions to this rule, where an apartment may be discounted at the next auction if it did not sell at the first one.
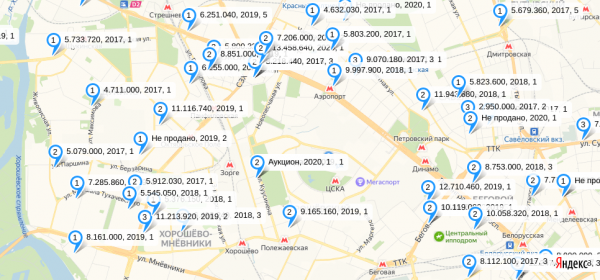
To understand which neighborhoods and which categories of apartments are traded more frequently, I plotted all the addresses on the map:
Link to the full .
The map marks the addresses of apartments that have been or will be sold, with the sales price (not auction price) indicated in the label's header, along with the year of the sale and the number of times the apartment was sold. The number in the label indicates the number of rooms in the apartment. The label's description contains information about past and upcoming auctions, as well as the address (addresses without spaces and capital letters due to differences in writing in the source data) and other information about the apartment.
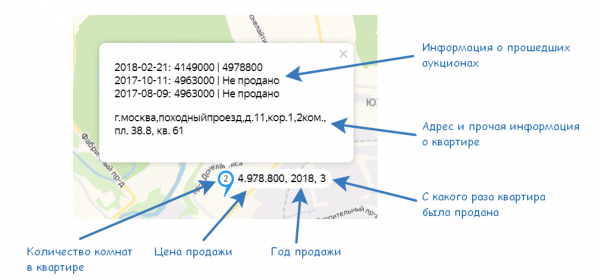
Thanks to the map, you can see how prices in the area have changed over time and how much similar options are traded. Notably, new properties, i.e., apartments in new buildings, even in areas with poor transport access, usually sell with negotiations, while older apartments can often be purchased at the starting price or with minor negotiations. The map allows for an approximate forecast of auctions by examining previously sold apartments located around the one being auctioned.
Although it's not entirely accurate to compare old and new properties, and auction apartments heavily skew towards old properties due to their nature , let's look at some histograms with these assumptions.
Histogram of average apartment prices by year and number of rooms:
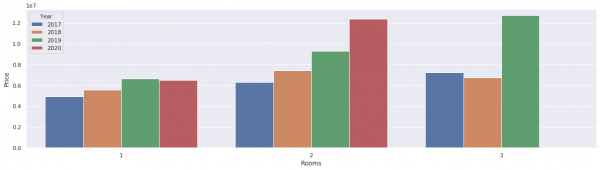
Total number of apartments: 397
It is not quite correct to view average prices in isolation from the neighborhood, so let's examine apartments in each area separately (only neighborhoods within the MKAD are considered).
Histogram of average prices for one-room apartments, divided by neighborhoods and year:
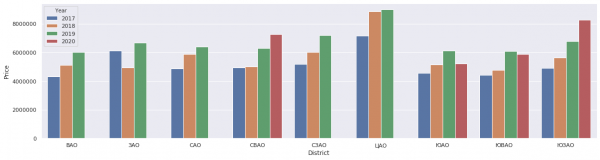
Total number of one-room apartments: 218
Histogram of average prices for two-room apartments, divided by neighborhoods and year:
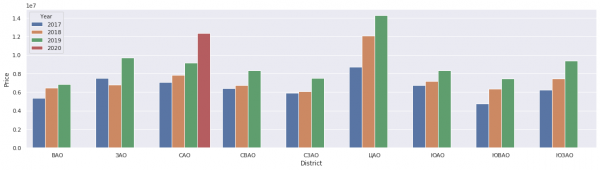
Total number of two-bedroom apartments: 159
Unfortunately, there are too few three-bedroom apartments, making it impossible to build a representative histogram.
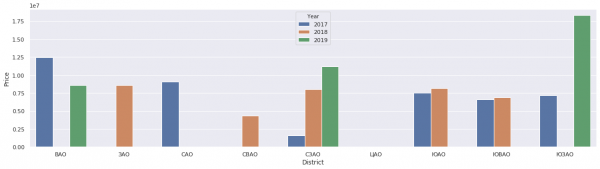
Total number of three-bedroom apartments: 20
Considering the assumptions outlined above (again, at the time of writing this article in 2020, only one auction had taken place), some conclusions can still be drawn. Looking at the price distribution by areas, it is noticeable that overall prices are rising; however, a reversal is already beginning to emerge, with prices in some areas starting to reverse while in others, the growth is slowing down. This generally indicates that maximum prices may have been reached, and a subsequent decrease is likely.
Source code on
Source: habr.com
