

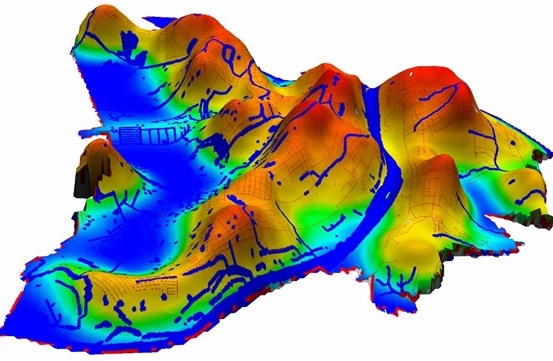
Example of calculating the thermal potential for the street network of Nizhny Novgorod
The territory of the city is a complex, heterogeneous system that is constantly changing. The description of the territory and the assessment of the urban environment can be done using spatial objects (factors). The factors describing the territory vary in their nature of influence (positive, negative) and geometric configuration (points, lines, polygons).
Often, it is quite difficult to determine the degree of influence of each individual object on the overall development of the territory or on a specific aspect of it. Today, the problem of defining and describing concepts such as 'culture', 'social sphere', 'social tension', 'quality of life', 'economic development', and 'public health' is becoming increasingly relevant. The ambiguity of these concepts increases when we want to apply them in relation to different social groups, populations of various ages and genders.
It should also be noted that the boundaries of the city in the modern sense are quite conditional. Daily population migration and the transport accessibility of remote areas further 'blur the boundary' of the city. The concept of agglomeration, which is widely used today, generally reflects the boundaries of the city, but at the same time makes the very notion of city boundaries even more vague.
Despite the issues described above, the analysis and assessment of territories today are among the promising and interesting areas that allow addressing many current challenges of the urban environment.
The article proposes a method for analyzing the territory using a 'thermal' model. This method is based on the study of potentials created by objects (factors) of various natures (point, linear, and area). Analyzing the territory using this method allows for transitioning from a set of spatial data (factors) describing the territory to an accurate numerical (scoring) assessment at each point of the territory.
The potentials studied in the territory analysis have a physical interpretation – the distribution of heat in environments of different dimensions (2D, 3D). This phenomenon can be represented in the form of "thermal" images ("thermal" maps of the territory), providing insight into the degree of development of the area depending on the intensity of the color of the image.
Territory Factors
Territory analysis involves the search and processing of information about the influencing factors on the territory and their indicators. The influencing factors are objects that affect the surrounding area, possessing a set of characteristics and spatial coordinates. Examples of influencing factors may include stores, industrial sites, roads, forests, and water bodies.
The indicators of influence are objects that reflect the influence of objects and also possess a set of characteristics and spatial coordinates. Examples of influence indicators include ATMs, billboards, and monuments.
In the further discussions, we will use the concept of influencing factors, which combines both terms – factors and influence indicators.
Below is an example of spatial data that serves as influencing factors.
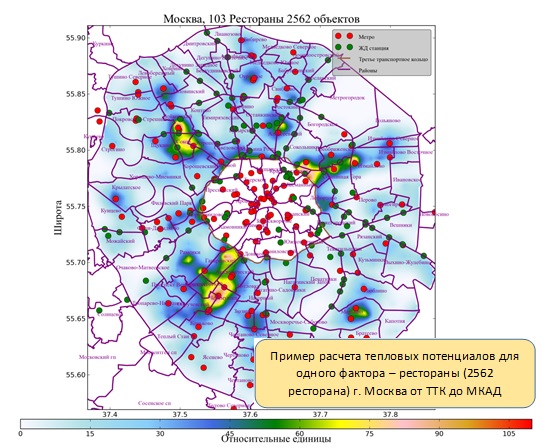
One of the important stages in conducting territory analysis is the stage of collecting and processing initial information. Currently, there is a substantial amount of information about the influencing factors on the territory of varying degrees of detail.
Information can be obtained from open sources or limited-access sources. In many cases, open information is sufficient for analysis, although it generally requires quite labor-intensive processing.
Among open sources, we believe that the leading resource is OpenStreetMap (OSM). The information obtained from this source is updated daily worldwide.
The information from OpenStreetMap (OSM) is presented in the following formats:
— OSM format. The main format with the extension ".osm" is used to describe graphical representations as XML– nodes, ways, relations.
— "Polish format". A text format with the extension ".mp" is used for graphic work.
— PBF format. A data storage format with the extension ".osm.pbf".
Other potential information sources include:
— 2GIS
The resource contains high-quality, monthly processed information, with an excellent 3-level classifier for enterprises and organizations.
— KML (Keyhole Markup Language) files
KML (Keyhole Markup Language) files are a file format used to display geographic data in applications like Google Earth, Google Maps, and Google Maps for mobile devices.
With KML files, you can:
— set various icons and create labels to denote locations on the Earth's surface
— create different perspectives for selected objects by altering the camera position
— use various overlay images
— define styles to customize the display of an object, apply HTML code to create hyperlinks and embedded images
— use folders for hierarchical grouping of elements
— dynamically retrieve and update KML files from remote or local network nodes
— obtain KML data in accordance with changes in the 3D viewer tool
— Federal Service for State Registration, Cadastre and Cartography "Rosreestr"
Information on the Rosreestr portal is valuable for its content and relevance, but unfortunately does not provide the possibility to obtain graphics for capital construction objects and land plots free of charge. The Rosreestr portal also contains a large volume of restricted-access information.
— Statistics Authorities
Statistical data is a legitimate source of information about the territory; however, as of today, data from statistical authorities is only available for a limited number of indicators, mostly in reports from statistical authorities and regional government reports.
— Information Systems of Government Bodies
High-quality information is contained in the information systems of government bodies, but only a small part of it is published in open access and available for analysis.
Conducting an analysis of territories does not impose any specific requirements on the composition of information; essentially, you can use everything you can find, with information from open-source resources being largely interchangeable. However, it should be noted that even the information obtained from the OSM resource alone is sufficient to conduct an analysis of an unfamiliar territory.
Territory analysis using a 'thermal' model. Physical interpretation of potentials.
As mentioned earlier, territory analysis is currently a relevant topic and a powerful tool for justifying the attraction of investments in the development of infrastructure in various urban environments.
The variety of tasks solved through conducting territory analysis can be grouped into several major directions:
— Obtaining the most interpretable and detailed assessment of the territory at each point.
By solving the assigned task, you can obtain a set of point ratings for each area of the territory, providing insight into the overall level of development, as well as in a specific area of interest. Such an area of interest could include, for instance, culture, industry, commerce, etc.
— Identifying the most advantageous locations for situating investment projects of a specific type (e.g., banks, specialty stores, shopping and entertainment centers) within the selected territory.
— Analyzing the most effective use of land.
This direction allows for a detailed investigation of the territory's characteristics, the market situation prevailing in the studied area, and the identification of in-demand options.
— Determining the contribution of one factor to the value model, using the example of new roads and new routes.
— Analyzing different aspects of a single territory and comparing different territories.
The originality of the method proposed in the article for territory analysis using a 'thermal' model lies in the use of development indicators—potentials presented in numerical form that reflect the extent of impact of an object (factor of influence) on the territory.
To understand the essence of the study, it is necessary to say a few words about thermal potential itself and provide its physical interpretation.
In physics, there are concepts such as force field and force function. The force field has the dimension of energy, while the force function has the dimension of force.
For the law of universal gravitation, the force field is defined by the formula:
F=k/r², where
k is a constant;
r is the distance between the interacting objects.
The force function ϕ is defined by the expression:
dϕ=-F*dr, where
ϕ is the potential of the force field;
dϕ, dr are differentials;
r is the distance between the interacting objects,
therefore ϕ=k/r.
The physical meaning of the potential of the force field ϕ is the work E done by the force field over a certain distance. In the case of the law of universal gravitation, when changing the distance to the object from r₂ to r₁, the force function is determined by the formula
E=k*(1/r₁-1/r₂), where
E is the work done by the force field over a certain distance;
r₁, r₂ are the initial and final positions of the object.
For the analysis of territory, the influence of objects (factors) on the territory can be regarded as force (force function), and the level of development of the territory as the total thermal potential (force field) from all objects (factors). In physics problems, thermal potential is represented by temperature, whereas in territory analysis using the 'thermal' model, potential represents the total impact of all influencing factors on a point in the territory.
Spatial data consists of points, lines, and polygons. To calculate potentials, extended spatial data is divided into small fragments. For each fragment, the potential from a point is calculated with a multiplier equal to the size of the object (factor) fragment.
The data is grouped into meaningful clusters based on close similarity. For example, trade objects are grouped by products. There are groups for forest objects, water objects, populated places, transport stops, etc. The meaningfully grouped collections constitute a factor. By traversing all objects (factors), we obtain a set of thermal potentials that are suitable for further processing.
Using potentials ("heat maps") allows the transition from spatial data to "heat" images of influence factors on territories (visualization of potentials). This transition enables the determination of the presence degree of a factor at each point on the territory and conducting further analysis, i.e., to display different directions of city development in color. Thus, we obtain a glow of varying intensity for each point on the territory.
Examples of "heat" images of the territory of Nizhny Novgorod city across several factors are presented below.
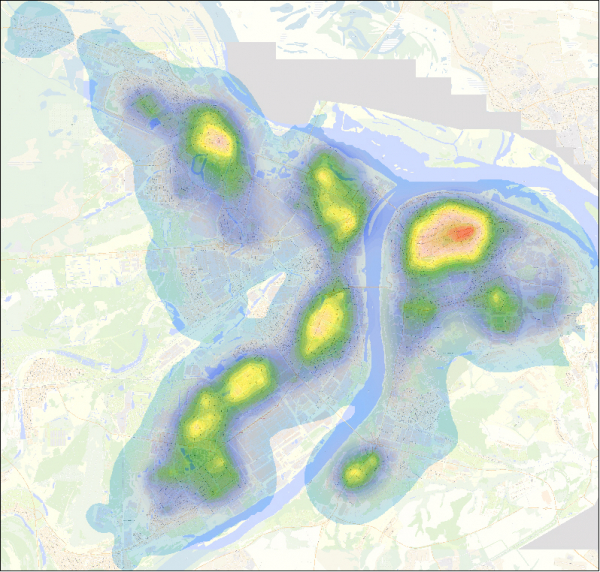
"Heat" map of N. Novgorod city reflecting the factor "Pharmacy Network"
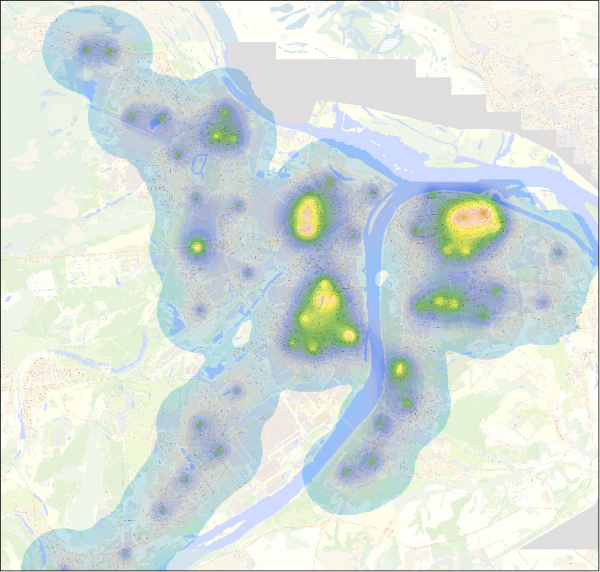
"Heat" map of N. Novgorod city reflecting the factor "Adult Clinics"
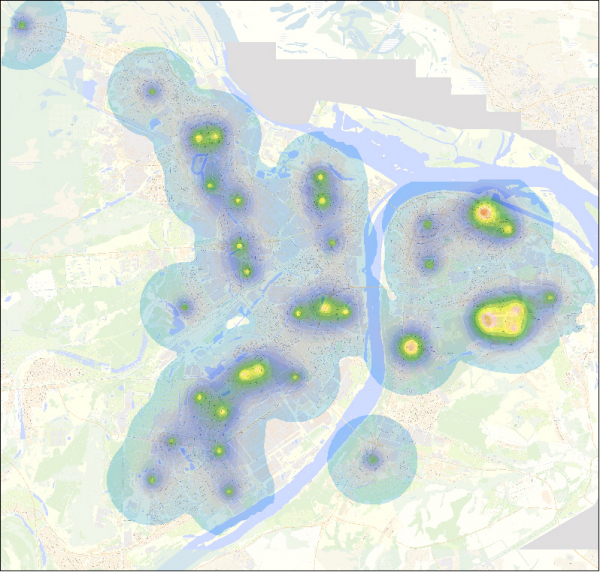
"Heat" map of N. Novgorod city reflecting the factor "Children’s Clinics"
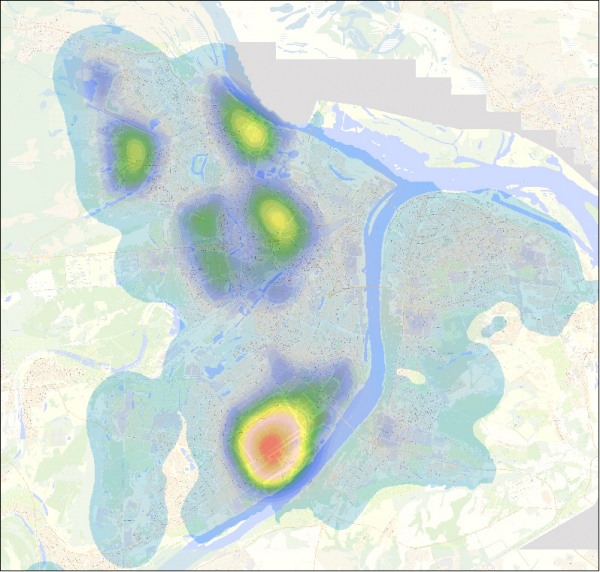
"Heat" map of N. Novgorod city reflecting the factor "Industrial Areas"
"Heat" images of the territory allow us to determine the concentration of potentials from various influence objects. Next, it is necessary to combine the obtained potentials into an integral characteristic that will allow an evaluation of the territory across a large number of factors. For this, a method is required that can analyze a large volume of information, recognize objects, and reduce the dimensionality of data while losing the least amount of information. One such method is Principal Component Analysis (PCA). More details about this method can be read in .
The essence of the method is to find a linear combination of the original parameters that varies most strongly in the analysis area. For spatial data, it is the variation most significantly changing across the territory.
Principal Component Analysis highlights objects (factors) that change most significantly across the territory. As a result of the method's work, new variables – principal components – emerge, which are more informative compared to the original data, making it easier to analyze, describe, and visualize the territory, and to build models.
Principal components are analytical expressions—a sum of the potentials of the original factors with certain coefficients. However, if any factor has a significant impact on the area but does not change across the analyzed territory, the principal component method will not include that factor in the principal components.
Principal components are ordered by decreasing information—that is, the distribution across the territory. The first principal components carry significantly more information than individual factors and effectively describe the territory. Typically, when using around a hundred factors, the first principal component contains about 50% of all information (variance) for the territory. Principal components do not correlate with each other and can be used for models as characteristics of the territory at each point.
A principal component, as some abstractly computed indicator of the territory, does not have a clear name or classification. However, the set of factors that are strongly correlated with the principal component allows for its interpretation. Generally, the following factors correlate with principal components:
— level of infrastructure development;
— transport component of the territory;
— climatic zones;
— level of agricultural development;
— economic potential of the territory.
Further analysis, including clustering, proceeds with several of the first significant principal components.
The illustrations show a graphical representation of the first principal components over the territories of several cities in the Russian Federation.
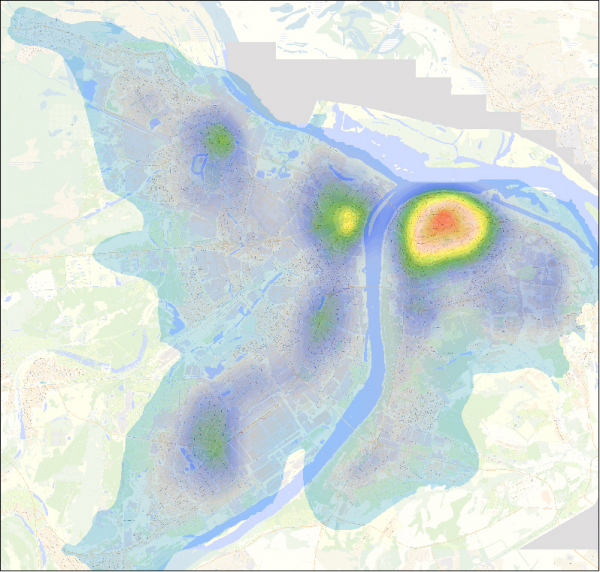
The first principal component characterizing the level of urban infrastructure development in Nizhny Novgorod.
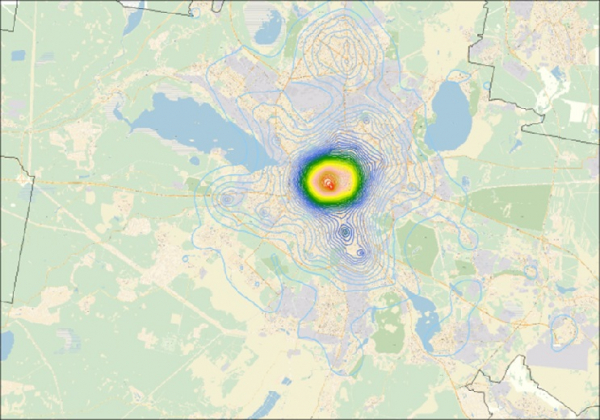
The first principal component characterizing the level of urban infrastructure development in Yekaterinburg.
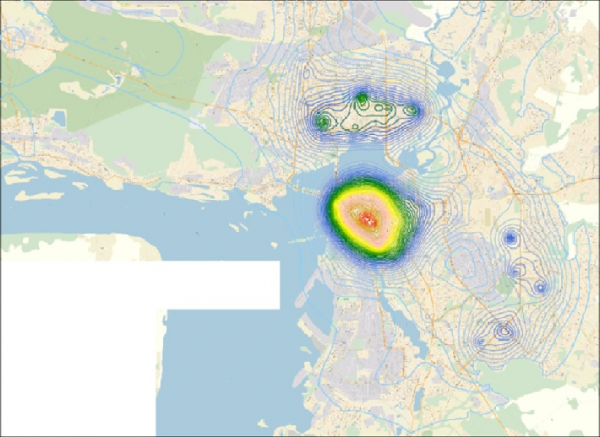
The first principal component characterizing the level of urban infrastructure development in Kazan.
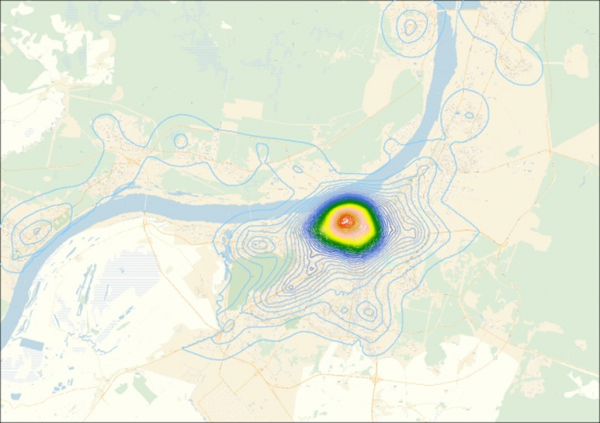
The first principal component characterizing the level of urban infrastructure development in Perm.
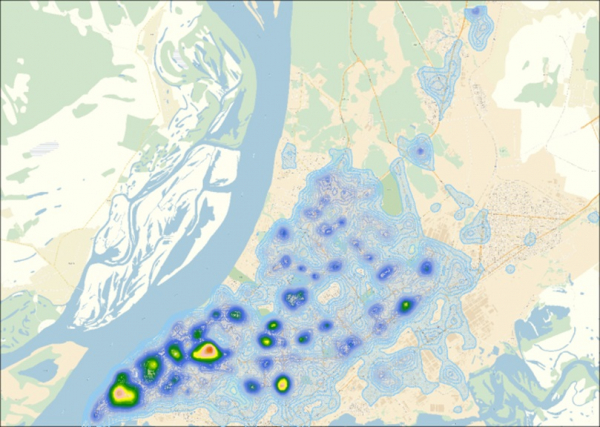
The first principal component characterizing the level of urban infrastructure development in Samara.
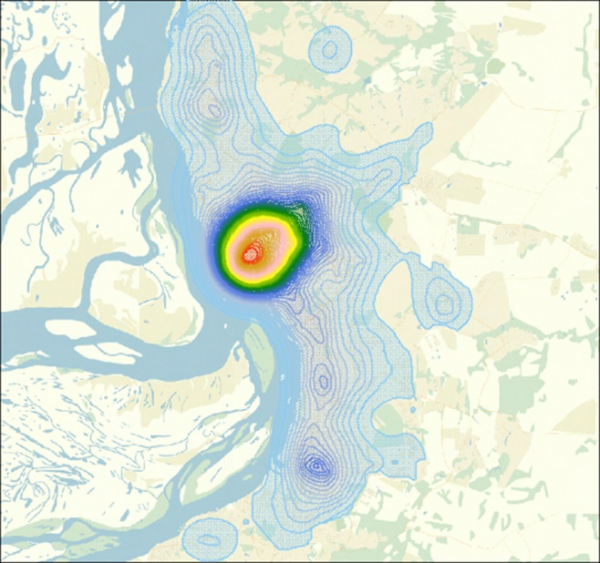
The first principal component characterizing the level of urban infrastructure development in Khabarovsk.
Integral characteristics: clustering
The next stage of territory analysis involves identifying areas of urban environments that are homogeneous in quality. This search is based on analyzing the values of the main components at each point in the territory. The task of identifying these homogeneous areas can be achieved through clustering – a process of grouping territories based on the proximity of a set of characteristics.
Clustering of territory pursues two goals:
— creating a more perceptible visualization of the territory;
— highlighting areas for developing separate models.
Territories are clustered according to selected factors for analysis. These factors may include those influencing pricing or factors describing some aspect of territorial development, such as the social sphere.
There are two common classical clustering methods: the K-means method and the dendrogram method. When working with territories, the K-means method has proven effective, characterized by the "growth" of a cluster by adding new objects to growth points. The advantages of the K-means method lie in its similarity to the natural process of territory formation: integrating similarities rather than separating dissimilarities.
The K-means method was used to conduct calculations for Nizhny Novgorod (illustration below).
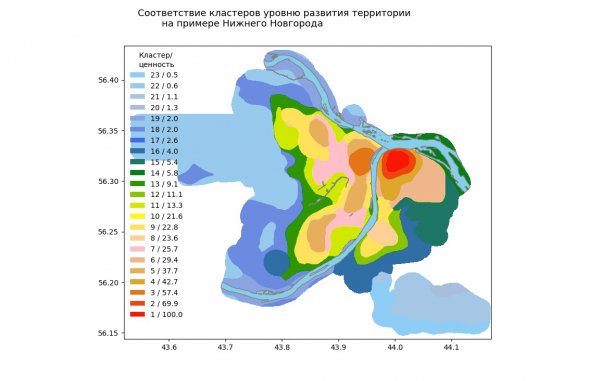
Clusters' correspondence to the level of territory development based on the example of Nizhny Novgorod
With the proposed approach, we can gain insights into the territory through various themes. The themes of interest may include, for example, the level of urban infrastructure development, the level of 'elitism' of the territory, the level of cultural development, and the social component of territorial development. These themes are poorly defined integral concepts and consist of many interrelated factors.
With a certain parameter selection algorithm for analysis (including expert involvement), we will obtain thematic maps that provide insights into one aspect of territorial development.
Integral characteristics refer to the first main components, primarily the most informative first main component, and the clustering of territories based on selected parameters.
The thematic maps of the first main components across various development aspects are presented in the figures below.
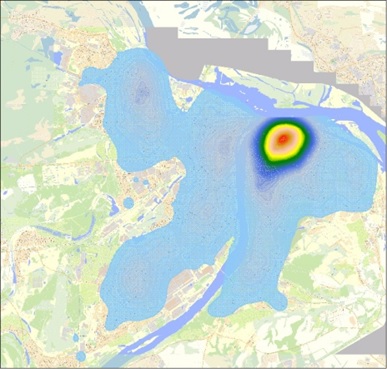
Thematic map "Cultural Objects" based on the example of Nizhny Novgorod.
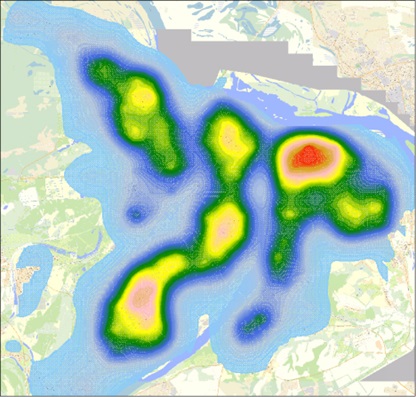
Thematic map "Social Sphere" based on the example of Nizhny Novgorod.
Integral characteristics allow for an understanding of the territory's features by considering multiple factors with minimal information loss.
In conclusion, it is important to emphasize that today, the analysis of territories is an extremely important stage in addressing urban development challenges, selecting investment locations for construction, finding the most advantageous locations for new projects, and other tasks.
The method of territory analysis proposed in the article, using a "thermal" model based on factors of different natures, is not critical to the set of factors; that is, it does not impose limitations or requirements on the initial information.
The diversity and redundancy of the initial information, along with the ability to utilize open data, provides unlimited opportunities for analyzing any territories in the world.
In the upcoming publications dedicated to territory analysis tasks, we plan to reveal the features of model composition using main components and the methods of their implementation for tasks such as:
— selecting the ideal location for a new project;
— constructing a price surface for a certain category of objects using market value;
— assessing the profitability of a particular type of activity based on the locations of these objects.
We also plan to present methods for the reverse transition from main components to factors, which in turn allows for the development of a factor model for this territory.
Source: habr.com
