

We still have a strategy that we follow—this year, for the second time in a row, we finish as the top company. There’s no secret recipe or ingredient here; just daily work that yields results. It’s like working out in the gym, putting in the effort.
Below the cut, we analyze the blog's activity over the last 4 years.
All calculations in this publication are based on an analysis of a CSV file containing information about all blog posts, which can be exported from the corporate blog control panel—thanks to Habr for this opportunity.
Blog on Habr
Here, instead of just writing down numbers, it's much nicer to compare them with the figures from previous periods. Considering that we've been running the blog on Habr for four years now, you can definitely observe the trends:
2016. The blog has published 72 posts—58 (80%) of which received a positive rating and 14 (20%) a negative one.
2017. The blog has published 170 posts, with only one (0.58%) receiving a negative rating.
2018. A total of 260 posts have been published, all with positive ratings.
2019. In Dudya's voice: Three hundred and eight posts.
Out of which, 308 posts received positive ratings.

In 2018, we thought we had gone a bit overboard—with 247 working days in the year, we published 260 posts, meaning one post a day and a few on the weekends. This year has the same number of working days, but we increased our posts—we found our rhythm, picked up the pace, and the workload doesn’t seem unmanageable. Moreover, it feels like this isn't the limit of our capabilities—there's a feeling that in 2020, we might push even harder so you can read us twice a day 🙂 Just kidding (though there’s a hint of truth in every joke).
We are still focused on translations—sifting through content across the network to select the most relevant material for the primary audience of our products—developers and administrators. We select the content ourselves, translating at the request of readers. We believe this approach is optimal—this way, we can anticipate the quality of the publication and the community's reaction to it, allowing us to calculate resource expenditures. However, it can no longer be said that the RUVDS blog consists solely of translations—this year we decided to ramp up our original content. Report , cycles of articles on and , hardware tests and much more — surely you've read some of this already. We will try to increase the percentage of original content in the new year — if you want to publish something on Habr, write to us, and we will make arrangements.
Meanwhile, a big thank you to all our readers for the positive feedback on our activity.
Let's return to the numbers
Out of 308 publications, none had a negative rating, although there were some downsides (albeit fewer than in previous years). A total of 13,232 votes were cast (11,870 pluses and 1,362 minuses), with the cumulative rating of posts at 10,508, meaning the average post rating was +34 (in 2018 it was +25).
Compared to previous years:
| 2016 | 2017 | 2018 | 2019 | |
|---|---|---|---|---|
| Posts published With a positive rating | 72 58 (80%) 14 (20%) | 170 169 (99.4%) 1 (0.6%) | 260 260 (100%) 0 | 308 308 (100%) 0 |
| Total votes Of which positives Total rating of all posts: | 1681 (~23.3/post) 1235 (73.5%) +789 (~10.9/post) | 5644 (~33/post) 4794 (85%) +3880 (~22.8/post) | 8639 (~33/post) 7580 (87.8%) +6521 (~25/post) | 13232 (~42.9/post) 11870 (89.7%) +10508 (~34/post) |
| Total comments on posts | 1919 (~26.6/post) | 4908 (~28.8/post) | 5255 (~20.2/post) | 7863 (~25.5/post) |
| Total additions to bookmarks | 5575 (~77.4/post) | 27236 (~160.2/post) | 36182 (~139/post) | 36361 (~118/post) |
| Total post views | 1,238,367 (~17,299/post) | 3,547,173 (~20,865/post) | 4,247,966 (~16,338/post) | 4,973,912 (~16,149/post) |
The numbers continue to please us, but as is often the case, we want more. Therefore, we will try to consider mistakes (from comments and the reasons for minuses) and become better in the new year.
Last year we celebrated being ranked first among companies occasionally, although we never quite reached the 1000 unit threshold of the Habr index. This year we consistently surpassed it, and our blog held the top position for almost the entire year.
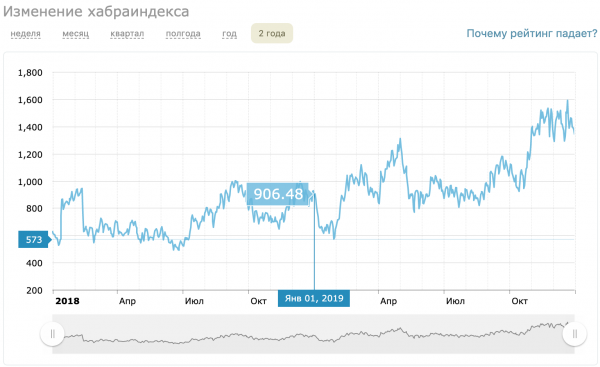
The number of blog subscribers grew from 2,000 to 12,000 over the year, but apparently, this is primarily due to onboarding new Habr users.
Which hubs we write the most in:
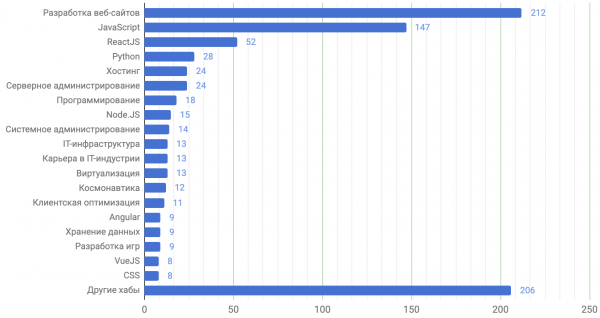
As it was last year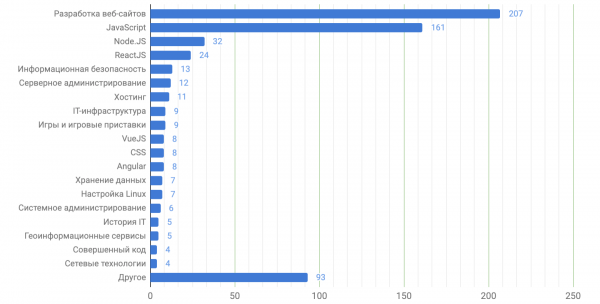
TOP
Top 10 posts of our blog by rating
| 128 | |
| 121 | |
| 103 | |
| 83 | |
| 83 | |
| 79 | |
| 78 | |
| 77 | |
| 75 | |
| 75 |
Interestingly, the highest-rated post was written just recently.
Top 10 most viewed blog posts
| 110521 | |
| 67458 | |
| 64414 | |
| 59435 | |
| 56406 | |
| 54290 | |
| 51786 | |
| 51114 | |
| 49592 | |
| 46956 |
Top 10 blog posts by comments
| 399 | |
| 285 | |
| 227 | |
| 222 | |
| 182 | |
| 175 | |
| 171 | |
| 166 | |
| 121 | |
| 117 |
Top 10 blog posts by favorites
| 892 | |
| 537 | |
| 519 | |
| 466 | |
| 410 | |
| 395 | |
| 389 | |
| 375 | |
| 358 | |
| 339 |
PDFs!
We traditionally package large translation cycles into a PDF file that is easier to store — somewhere in a folder with documentation (or on an e-reader), rather than a stack of links in favorites. This year, we had only one such cycle — , in 27 publications:
→ / 278 страниц, 4.8 Мб
Previous issues:
→ / 150 страниц, 5 Мб
→ / 120 страниц, 1.8 Мб
→ / 103 страницы, 2 Мб
It’s still unclear how in 2020 we will conquer new heights, but there are desires and some plans. We would greatly appreciate it if you could tell us in the comments what you (don’t) like about our blog, what topics you would be interested in reading, and any constructive feedback.
We wish you a good start to the new year and to achieve the goals set for this year!
Source: habr.com
