

GPU Specifications of the Blackwell Family and Tests made it clear that all models in the 50 series, with the exception of the GeForce RTX 5090, are little more than minor upgrades over their previous generation counterparts. The situation has been worsened by the shortage of new graphics cards and, consequently, skyrocketing prices.
For most buyers, high-end devices, monopolized by NVIDIA, spark only theoretical interest. However, at one level down, the technological stagnation of 'green' graphics has created a situation where AMD could leap forward to catch up in such problematic aspects for its RDNA architecture as ray tracing and upscaling. Nevertheless, the prophecy that AMD would restore parity with its competitor (if not aiming for the flagship sector) has been heard for a long time, and each time it sounds less convincing, so the announcement of the Radeon RX 9000 graphics cards did not attract much attention against NVIDIA's vigorous activity. Meanwhile, AMD has conducted extensive work on its errors and if not eliminated, at least compensated for the shortcomings of its previous GPUs.
We present a review of the Radeon RX 9070 XT in an unusual format for 3DNews, as the 'red' newcomer and its main competitor—the GeForce RTX 5070 Ti—landed in our hands simultaneously, and one device cannot be viewed in isolation from the other, as in Russia they are sold for roughly the same price.
 |  |
Navi 48 GPU and RDNA 4 Architecture
It has not been said only by the lazy that NVIDIA has become a monopolist in the high-performance GPU market and behaves accordingly. Less attention is paid to the fact that all companies designing large processors have to rely on a single contractor for their production—the Taiwanese TSMC. The demand for TSMC's capacities has surely become one of the reasons why AMD halted the development of large consumer GPUs, and there is currently only one chip in the 'red' next-generation graphics processor lineup—Navi 48.
| Manufacturer | AMD | ||
|---|---|---|---|
| Title | Navi 32 | Navi 31 | Navi 48 |
| Where Used | Radeon RX 7700 XT; Radeon RX 7800 XT | Radeon RX 7900 GRE; Radeon RX 7900 XT; Radeon RX 7900 XTX | Radeon RX 9070; Radeon RX 9070 XTX |
| Architecture | RDNA 3 | RDNA 3 | RDNA 4 |
| Process Technology, nm | TSMC N5/N6 | TSMC N5/N6 | TSMC N4P |
| Number of Transistors, billion | 28,1 | 57,7 | 53,9 |
| Chip Area, mm² | 346 | 522 | 357 |
| Number of CU/WGP/SE | |||
| Compute Units (CU) | 60 | 96 | 64 |
| Workgroup Processors (WGP) | 30 | 48 | 32 |
| Shader Arrays (SA) | No | No | No |
| Shader Engines (SE) | 4? | 6 | 4 |
| Compute Unit Configuration | |||
| Vector ALUs (FP32) | 2 × 32 | 2 × 32 | 2 × 32 |
| Vector ALUs (FP32/INT32) | 2 × 32 | 2 × 32 | 2 × 32 |
| Scalar ALUs | 2 | 2 | 2 |
| Specialized ALUs (SFU) | 2 × 8 | 2 × 8 | 2 × 8 |
| Ray Tracing Blocks (Ray Accelerators) | 1 | 1 | 1 |
| Texture Mapping Units (TMU) | 4 | 4 | 4 |
| Vector/Scalar Registers, Kbytes | 384/10 | 384/10 | 384/16 |
| L0 Cache Size, Kbytes | 32 | 32 | 32 |
| Workgroup Processor (WGP) Configuration | |||
| Shared Memory Size, Kbytes | 128 | 128 | 128 |
| Instruction Cache Size, Kbytes | 32 | 32 | 32 |
| Scalar Cache Size, Kbytes | 16 | 16 | 16 |
| GPU Compute Units | |||
| Vector ALUs (FP32) | 3 840 (7 680) | 6 144 (12 288) | 4 096 (8 192) |
| Texture Mapping Units (TMU) | 240 | 384 | 256 |
| Raster Operations Blocks (ROP) | 96 | 192 | 128 |
| Ray Tracing Blocks (Ray Accelerators) | 60 | 96 | 64 |
| Memory Configuration | |||
| L1 Cache Size, Kbytes | 2 048 | 3 072 | 2 048 |
| L2 Cache Size, Mbytes | 4 | 6 | 8 |
| Infinity Cache Size, Mbytes | 64 | 96 | 64 |
| VRAM Bus Width, bits | 256 | 384 | 256 |
| VRAM Chip Type | GDDR6 | GDDR6 | GDDR6 |
| PCI Express Interface | 4.0 x16 | 4.0 x16 | 5.0 x16 |
Among older chips, it most closely resembles the second-tier model, Navi 32, in key specifications, but contains nearly as many transistors as Navi 31 (53.9 and 57.7 billion, respectively). Navi 48 is built on TSMC N4P technology, which belongs to the same 5nm photolithography node that was developed two years ago. However, Navi 48 occupies only 68% of the area of Navi 31 due to AMD abandoning the chiplet design, as the MCD chiplets, which contain the third-level cache and memory controllers, are manufactured using the coarser N6 process.
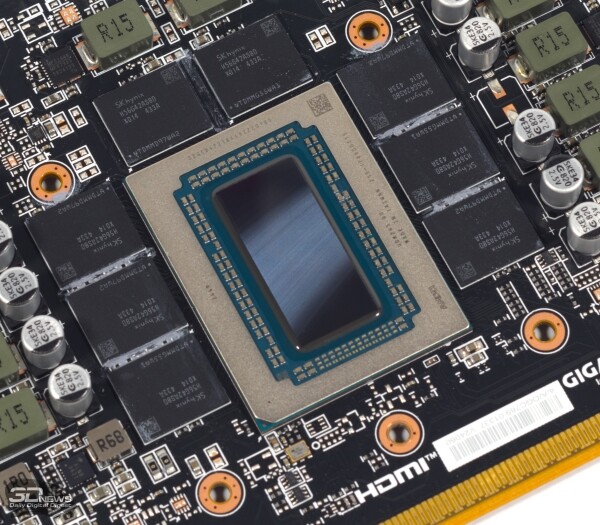
The architecture of the new graphics processor, RDNA 4, is structurally similar to previous iterations. Navi 48 contains 64 Compute Units, or 4,096 FP32-compatible shader ALUs, which is a fairly typical formula for a second-tier GPU — just like the 256-bit video memory bus. However, AMD is positioning Navi 48 against the flagship Navi 31, which has 6,144 standard precision floating-point shader ALUs, in terms of performance evaluations. The difference should be more than compensated by multiple logic enhancements, and to understand them we recommend refreshing your memory on the RDNA 3 architecture, which we covered in detail in our review. .
Compared to the 'green' architecture RDNA 4 represents a more extensive and profound upgrade of previous developments. However, the description of all innovations curiously ends up being a short list because NVIDIA traditionally pays increased attention to complex software or semi-software solutions that require elaborated commentary, while AMD's innovations tend to start and end with hardware.
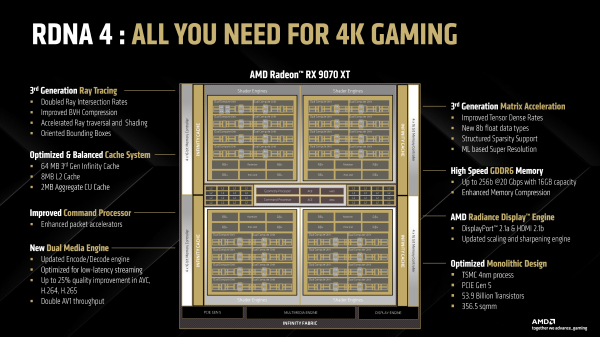
Fundamental changes have occurred in the structure of the Compute Unit, an indivisible computing block analogous to NVIDIA's SM and CPU cores. The instruction scheduler now supports so-called split barriers, which allow for instruction execution during their validity period. Additionally, instruction prefetching from the cache has been optimized, while scalar ALUs, used for efficiently executing conditional branching operations, inherited the ability to work with floating-point data from the mobile RDNA 3.5 architecture. The amount of scalar registers has also increased from 10 to 16 KB.
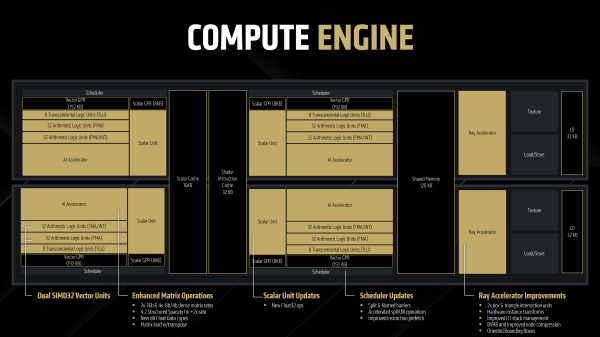
One of the most significant innovations of RDNA 4 is the doubled execution rate of matrix instructions WMMA, which are used in machine learning tasks and data processing through neural networks. Furthermore, the RDNA 4 instruction set contains commands for calculations on structurally sparse matrices and 8-bit floating-point data (FP8 and BF8).
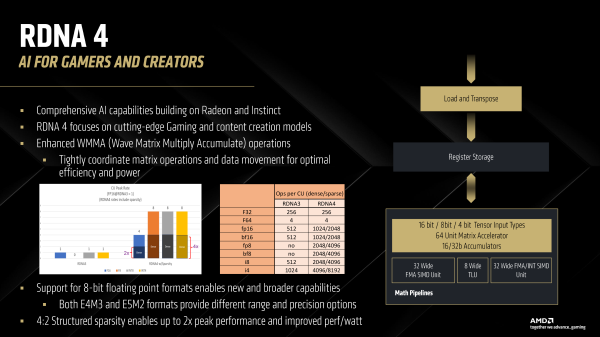
However, a throughput of 1,024 FLOP per clock cycle means that Navi chips have only reached the level of the previous 'green' architecture — Ampere. Moreover, while NVIDIA and Intel chips use separate ALU arrays for matrix operations, in RDNA 4 architecture, this task still relies on shader SIMD.
However, let's not forget that in real applications, RDNA 3-based GPUs never even come close to full load. The declared teraflops in FP32 general-purpose calculations are only achievable under the condition that the VOPD (Vector Operation Dual) format is used, which allows packing together two independent vector instructions. This, in itself, imposes many limitations, so often half of the 32-bit ALUs within the Compute Unit remain idle. In mixed workloads (such as a game with upscaling), matrix operations will certainly consume some computational resources from the shaders, but these losses will not be as significant as they initially seem.
| Compute Unit (AMD RDNA 3) | Compute Unit (AMD RDNA 4) | Streaming Multiprocessor (NVIDIA Ada Lovelace) | Streaming Multiprocessor (NVIDIA Blackwell) | Xe-core (Intel Xe-HPG) | Xe-core (Intel Xe2) | |
|---|---|---|---|---|---|---|
| Execution units | 2 × SIMD32 (FP32/INT32); 2 × SIMD32 (FP32); 2 × SIMD2 (FP64); 2 × SIMD8 (SFU); 2 × scalar ALUs | 2 × SIMD32 (FP32/INT32); 2 × SIMD32 (FP32); 2 × SIMD2 (FP64); 2 × SIMD8 (SFU); 2 × scalar ALUs | 4 × SIMD16 (FP32/INT32); 4 × SIMD16 (FP32); 2 × SISD? (FP64); 4 × SIMD4 (SFU); 4 × scalar ALUs; 4 × tensor cores | 8 × SIMD16 (FP32/INT32); 2 × SISD? (FP64); 4 × SIMD4 (SFU); 4 × scalar ALUs; 4 × tensor cores | 16 × SIMD8 (FP32); 16 × SIMD8 (INT32); 16 × SISD (FP64); 16 × SIMD2 (SFU); 16 × XMX | 8 × SIMD16 (FP32); 8 × SIMD16 (INT32); 8 × SIMD2 (FP64); 8 × SIMD4 (SFU); 8 × XMX |
| SIMD operations per cycle | 128 × FP32; 64 × INT32; 256 × FP16; 4 × FP64; 16 × transcendental functions | 128 × FP32; 64 × INT32; 256 × FP16; 4 × FP64; 16 × transcendental functions | 128 × FP32; 64 × INT32; 128 × FP16; 2 × FP64; 16 × transcendental functions | 128 × FP32; 128 × INT32; 128 × FP16; 2 × FP64; 16 × transcendental functions | 128 × FP32; 128 × INT32; 256 × FP16; 16 × FP64; 32 × transcendental functions | 128 × FP32; 128 × INT32; 256 × FP16; 16 × FP64; 32 × transcendental functions |
| Matrix operations, FLOP per cycle (FP16) | 512 | 1 024 | 2 048 | 2 048 | 2 048 | 2 048 |
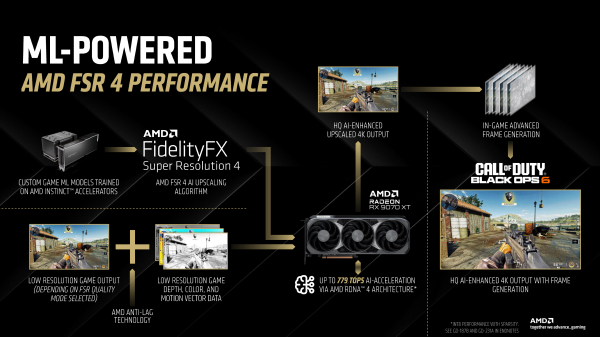
Frame scaling using neural networks is no longer a theoretical situation for Radeon accelerators. The new, fourth version of FSR finally relies on machine learning, including for frame generation, and the models used are a hybrid of convolutional networks and transformers. Unfortunately, unlike previous versions of the upscaler that worked on virtually any hardware, FSR 4 is only supported on RDNA 4 architecture GPUs (due to the expansion of the instruction set WMMA for FP8 data). A universal mode with simplified compute cores, like in Intel's XeSS, is not available.
Another direction of reform in the RDNA architecture is ray tracing. The intersection testing speed with a box BVH and a triangle has doubled per Ray Accelerator (and thus per Compute Unit): from 4 and 1 per cycle to 8 and 2, respectively. However, the RT block of Intel's Battlemage chips operates at a pace of 18 and 2, while Blackwell GPUs find four intersections with a triangle per cycle and an undisclosed number of intersections with a box BVH. Moreover, competitors conduct testing of the two types (against a BVH box and a triangle) simultaneously, whereas AMD still does not allow this. To some extent, parallelism is possible since each Ray Accelerator now contains two independent 'testers', but not at full speed.
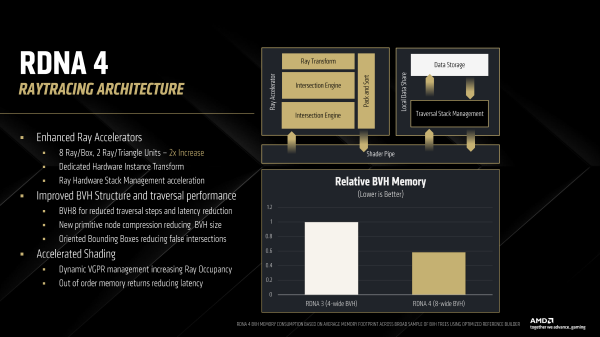
Additionally, the Ray Accelerator has gained the ability to process rays out of order. Rays that do not require access to slow memory stack levels are processed first, and the testing results are saved so that the shader program can receive them in the expected order.
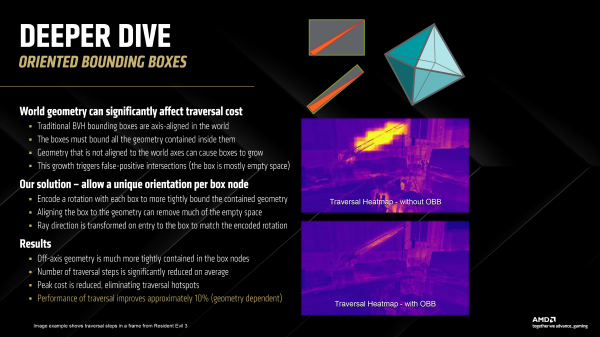
Ray tracing logic now uses a denser BVH8 structure instead of BVH4 (eight instead of four nodes per each volume hierarchy branch), which increases traversal speed while simultaneously reducing pressure on video memory. The size of the BVH in memory has also decreased due to the new primitive compression algorithm. Finally, AMD now allows the orientation of BVH boxes to be decoupled from the absolute scene coordinates. Rotating the boxes according to the geometry of objects reduces the number of steps needed for search.
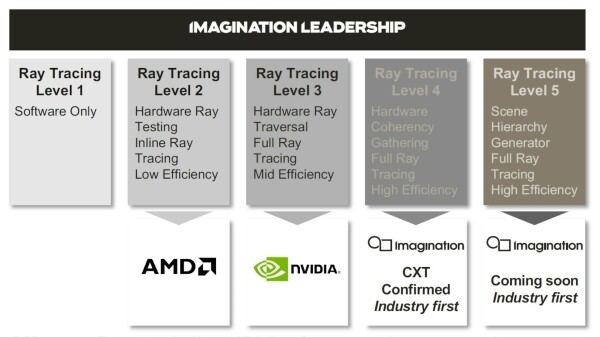
Unfortunately, despite all the mentioned changes, RDNA 4 still executes BVH traversal on shader ALUs rather than through specialized logic. According to the hardware ray tracing classification proposed by Imagination Technologies, AMD's solutions remain at level two, Intel GPUs are at level three, while NVIDIA hardware is moving from level three to level four thanks to the SER feature — dynamic grouping of instruction threads aimed at increasing memory access coherence and consequently reducing latency.
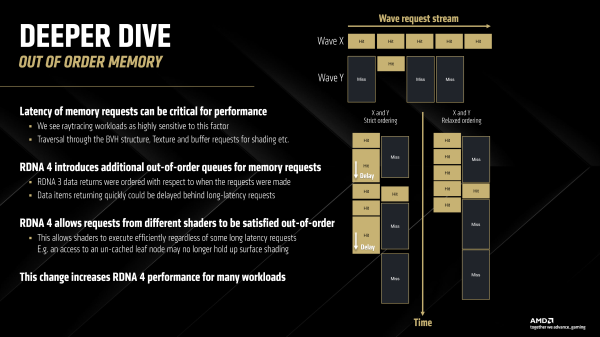
There is no equivalent to SER in the RDNA 4 architecture, but a feature called Out of Order Memory has emerged, which helps solve the same problem in a different way. Previous versions of RDNA, working with multiple instruction groups (wavefronts in AMD terminology), return data from memory strictly in the order the requests were made. When the data requested by a shader is in the fast cache, the return may still be delayed if another shader made its request earlier, and its data is in relatively slow VRAM. Frankly, this limitation seems completely pointless in the context of multi-threaded computations, but it surely arose to simplify GPU organization and, for a time (read: in rasterized games), remained a reasonable compromise. RDNA 4 allows instruction groups to return data independently of the order of requests.
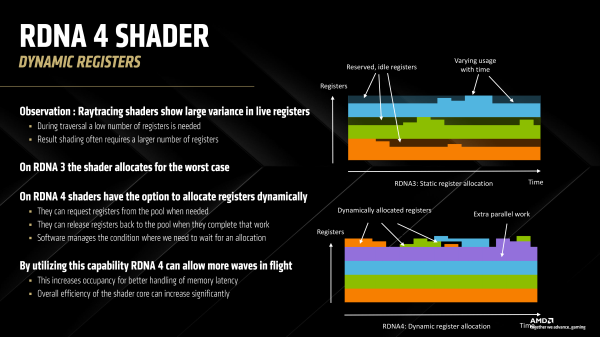
Out of Order Memory is just one of the changes in the memory stack of the RDNA 4 architecture. Register allocation for Compute Unit shaders used to occur statically, based on maximum consumption during the shader's lifetime, meaning a portion of the register file often remained unused. RDNA 4 allows shaders to request and free registers dynamically. This way, the size of the register file is utilized more efficiently.
Interestingly, the Shader Engine, a large structure of the GPU that integrates the CU array, rasterizer, primitive block, and raster operations blocks, has lost its own first-level cache in RDNA 4. However, each L2 cache segment now contains twice as many banks. Thus, both its capacity and bandwidth have increased, in both directions — to the Shader Engine and to the Infinity Cache (in other words, L3). The size of the Infinity Cache itself remains the same as in Navi 32 — 64 MB.
Navi 48 features 16 lines of PCI Express 5.0, but obviously cannot fully utilize such a fast interface in gaming tasks.
Finally, AMD reports that the hardware video codec in the next-generation GPU provides enhanced encoding quality at low bitrates popular for streaming, but nothing more. This means that support for YUV 4:2:2 color sub-sampling, which is present in NVIDIA and Intel GPUs, has not been introduced.
As for display output capabilities, the Navi 48 display controller is compatible with the latest versions of DisplayPort and HDMI interfaces: 2.1a and 2.1b respectively.
Specifications, Pricing
The Radeon RX 9070 XT comes equipped with a fully functional Navi 48 chip with 64 Compute Units, which translates to 4,096 standard precision floating-point ALUs. Finding a formal predecessor among the 'red' accelerators of the previous generation is not easy, as both the model range and GPU numbering principle have changed (Navi chips never reached the eight). In terms of computing blocks and memory stack characteristics, the Radeon RX 9070 XT is similar to the Radeon RX 7800 XT, but AMD positions it as a replacement for the Radeon RX 7900 XTX.
The Game Clock and Boost Clock (target clock frequency in games and clock frequency limit) of the graphics processor have significantly increased compared to the flagship model of the previous generation, reaching 2.4 and 2.97 GHz, respectively. The theoretical performance of the Radeon RX 7900 XTX based on the maximum clock frequency is 26% higher, but AMD plans to compensate for this difference through improvements in the RDNA 4 architecture.
The Radeon RX 9070 XT has 16 GB of GDDR6 memory with a bandwidth of 20 Gbps on a 256-bit bus. Reports suggest that AMD considered increasing the VRAM to 32 GB, but ultimately deemed that configuration excessive for consumer solutions. It's a pity, as game demands continue to grow, and the amount of video memory has been a key competitive advantage for many previous AMD devices.
The reference power consumption of the Radeon RX 9070 XT is 304 W, and the recommended price is $599 (which is $100 more than the Radeon RX 7800 XT).
| Manufacturer | AMD | NVIDIA | ||||||
|---|---|---|---|---|---|---|---|---|
| Model | Radeon RX 7900 XT | Radeon RX 7900 XTX | Radeon RX 9070 | Radeon RX 9070 XT | GeForce RTX 4070 Ti SUPER | GeForce RTX 4080 SUPER | GeForce RTX 5070 Ti | GeForce RTX 5080 |
| Graphics Processor | ||||||||
| Title | Navi 31 XT | Navi 31 XTX | Navi 48 XT | Navi 48 XTX | AD103 | AD103 | GB203 | GB203 |
| Architecture | RDNA 3 | RDNA 3 | RDNA 4 | RDNA 4 | Ada Lovelace | Ada Lovelace | Blackwell | Blackwell |
| Process Technology | TSMC N5/N6 | TSMC N5/N6 | TSMC N4C | TSMC N4C | TSMC 4N | TSMC 4N | TSMC 4NP | TSMC 4NP |
| Number of Transistors, billion | 57,7 | 57,7 | 53,9 | 53,9 | 45,9 | 45,9 | 45,6 | 45,6 |
| Clock Frequency (Base Clock/Game Clock/Boost Clock), MHz | 1 500 /2 025/2 394 | 1 855 /2 269/2 499 | 1 330 /2 070/2 520 | 1 660 /2 400/2 970 | 2 310/2 610 | 2 205/2 550 | 2 295/2 452 | 2 295/2 617 |
| Shader ALUs (FP32) | 5 376 (10 752) | 6 144 (12 228) | 3 584 (7 168) | 4 096 (8 192) | 8 448 | 10 240 | 8 960 | 10 752 |
| Texture Mapping Units (TMU) | 336 | 384 | 224 | 256 | 264 | 320 | 280 | 336 |
| Raster Operations Blocks (ROP) | 192 | 192 | 128 | 128 | 112 | 112 | 96 | 112 |
| Tensor Cores | No | No | No | No | 264 | 320 | 280 | 336 |
| RT Cores | 84 | 96 | 112 | 128 | 66 | 80 | 70 | 84 |
| Last Level Cache Size, MB | 80 | 96 | 64 | 64 | 48 | 64 | 64 | 64 |
| Memory | ||||||||
| Bus Width, bits | 320 | 384 | 256 | 256 | 256 | 256 | 256 | 256 |
| Chip Type | GDDR6 SGRAM | GDDR6 SGRAM | GDDR6 SGRAM | GDDR6 SGRAM | GDDR6X SGRAM | GDDR6X SGRAM | GDDR7 SGRAM | GDDR7 SGRAM |
| Bandwidth per Pin, Gbps | 20 | 20 | 20 | 20 | 21 | 23 | 28 | 30 |
| Total Bandwidth, GB/s | 800 | 960 | 640 | 640 | 672 | 736 | 896 | 960 |
| Capacity, GB | 20 | 24 | 16 | 16 | 16 | 16 | 16 | 16 |
| Performance | ||||||||
| Peak Performance FP32, TFLOPS | 25,7 (51,5) | 30,7 (61,1) | 18,1 (36,1) | 24,3 (48,7) | 44,1 | 52,2 | 43,9 | 56,3 |
| FP64/FP32 Performance | 1/32 (1/64) | 1/32 (1/64) | 1/32 (1/64) | 1/32 (1/64) | 1/64 | 1/64 | 1/64 | 1/64 |
| FP16/FP32 Performance | 2/1 | 2/1 | 2/1 | 2/1 | 1/1 | 1/1 | 1/1 | 1/1 |
| Other | ||||||||
| PCI Express Bus | PCI Express 4.0 x16 | PCI Express 4.0 x16 | PCI Express 5.0 x16 | PCI Express 5.0 x16 | PCI Express 4.0 x16 | PCI Express 4.0 x16 | 5.0 x16 | 5.0 x16 |
| Display Interfaces | DisplayPort 2.1, HDMI 2.1a | DisplayPort 2.1, HDMI 2.1a | DisplayPort 2.1a, HDMI 2.1b | DisplayPort 2.1a, HDMI 2.1b | DisplayPort 1.4a, HDMI 2.1 | DisplayPort 1.4a, HDMI 2.1 | DisplayPort 2.1b, HDMI 2.1b | DisplayPort 2.1b, HDMI 2.1b |
| TDP/TBP, W | 315 | 335 | 220 | 304 | 285 | 320 | 300 | 360 |
| Retail Price (USA), $ | 899 (recommended at launch) | 999 (recommended at launch) | 549 (recommended at launch) | 599 (recommended at launch) | 799 (recommended at launch) | 999 (recommended at launch) | 749 (recommended at launch) | 999 (recommended at launch) |
In turn, the GeForce RTX 5070 Ti is based on the same GB203 graphics processor used in the GeForce RTX 5080, but the younger model has lost 14 streaming multiprocessors, equating to 1,792 FP32-compatible shader ALUs, and the gaming clock speed has been reduced. As a result, the GeForce RTX 5080 has a theoretical performance advantage of 27% over the RTX 5070 Ti, which performs similarly to the RTX 4070 Ti SUPER in this regard. Like the Radeon RX 9070 XT, the lack of raw computational power is intended to be offset by the new GPU architecture, primarily through the feature of generating multiple frames using DLSS (up to three generated frames between two 'real' ones).
The GeForce RTX 5070 Ti is rated for a power consumption of 300 watts and, with an MSRP of $749, it is $50 cheaper than the GeForce RTX 4070 Ti SUPER.
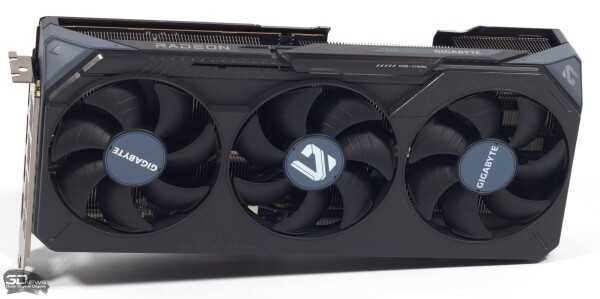
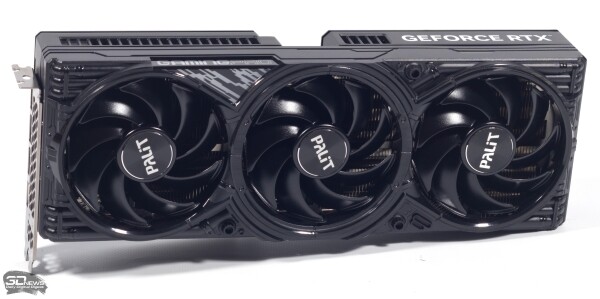
The $150 difference in recommended currency value between the Radeon RX 9070 XT and the GeForce RTX 5070 Ti is negligible given the current Russian prices: the most affordable partner models were found at DNS for 99,999 and 104,999 rubles, respectively. These are the models we will test in benchmarks. The Radeon RX 9070 XT is represented by the GIGABYTE GAMING OC graphics card with a factory overclocked GPU up to 2.52/3.06 GHz, while the GeForce RTX 5070 Ti is represented by the Palit GamingPro accelerator with reference specifications.
GIGABYTE Radeon RX 9070 XT GAMING OC: Design
The GIGABYTE Radeon RX 9070 XT has relatively modest dimensions for a graphics card with a power consumption of no less than (and, as tests will show, significantly more than) 300 watts: 288 mm in length and three slots in width. The only element of the LED backlighting is a short strip on the side. The manufacturer's logo badge is movable: if you shift it onto the LED strip, the logo starts to light up.
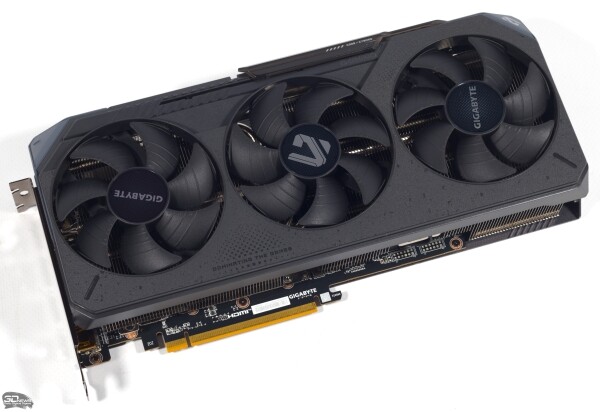
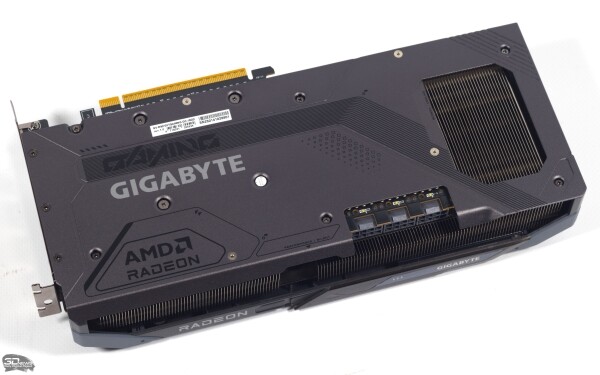
The cooling system is serviced by three fans with a blade diameter of 87 mm. Air passes straight through a small section of the radiator thanks to a cutout in the backplate.
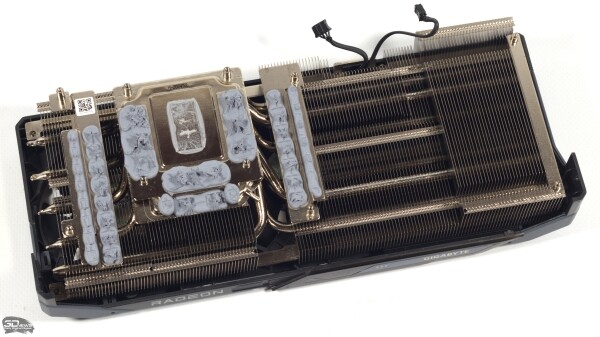
The graphics processor and memory chips transfer heat to the vapor chamber, but the former directly and the latter through a U-shaped metal spacer. Separate plates that act as thermal interfaces for the VRM components are attached to the heatsink fins. There are a total of seven heat pipes with a diameter of 6 mm. Notably, GIGABYTE opted for liquid thermal pads instead of conventional ones. This may be the reason for how the VRAM chips heat up under load (see the empirical section of the review).
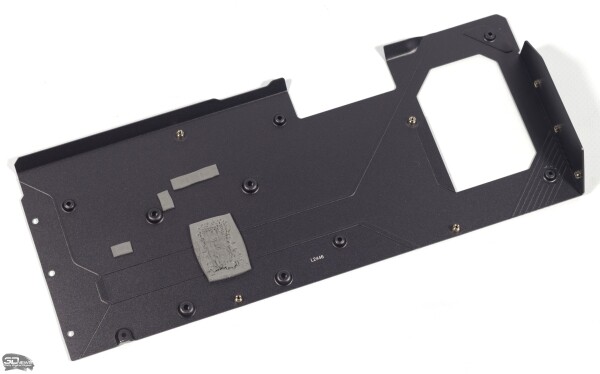
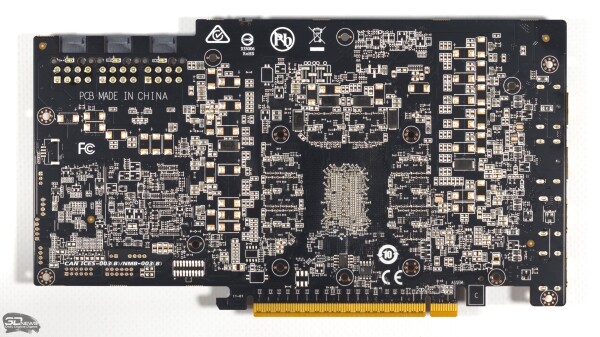
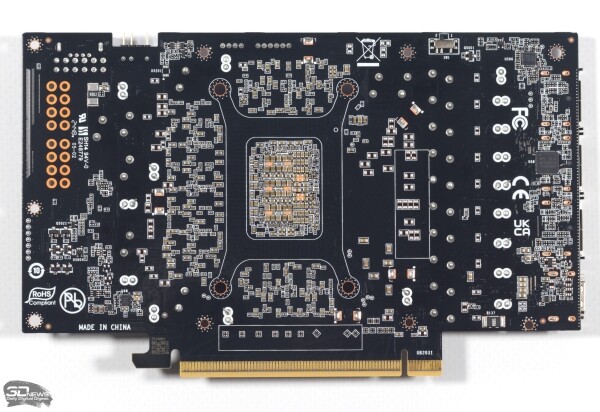
The backplate aids in dissipating heat from the printed circuit board via several thermal pads (which are conventional, not liquid).
GIGABYTE Radeon RX 9070 XT GAMING OC: Printed Circuit Board
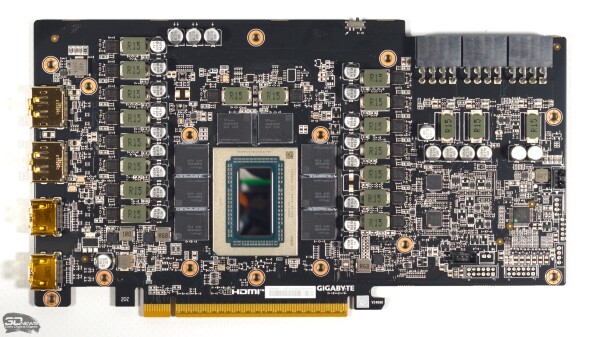
Some variations of the Radeon RX 9070 XT receive power through a 12V-2×6 connector, but GIGABYTE preferred three universal eight-pin connectors. In light of the high power consumption of the graphics card and ongoing complaints about the new connector, this is a more reliable, albeit less convenient and aesthetically pleasing solution. Of the 17 phases in the power system, 14, controlled by the Monolithic Power Systems MP2868A PWM controller, are allocated to the GPU, while three are for the memory. Both VRMs are equipped with MP87993 power stages with an estimated current rating of 90A.
The VRAM is comprised of SK hynix chips, where the marking H56G42AS8DX-014 encodes a bandwidth of 20 Gbps.
In addition to the BIOS copy, which is active by default, the graphics card has a backup 'silent' firmware.
Palit GeForce RTX 5070 Ti GamingPro: Design
The Palit GeForce RTX 5070 Ti GamingPro measures 331.9 mm in length, yet occupies only three expansion slots. Under the GamingPro logo and adjacent to the front panel segment, there are RGB lighting LEDs. The LED operation can be synchronized with the motherboard through a standard ARGB connector located near the 12V-2×6 power input.
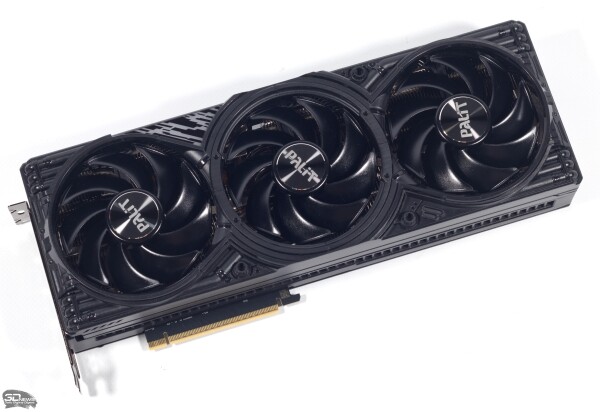
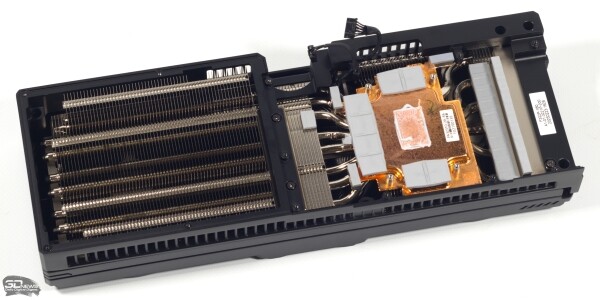
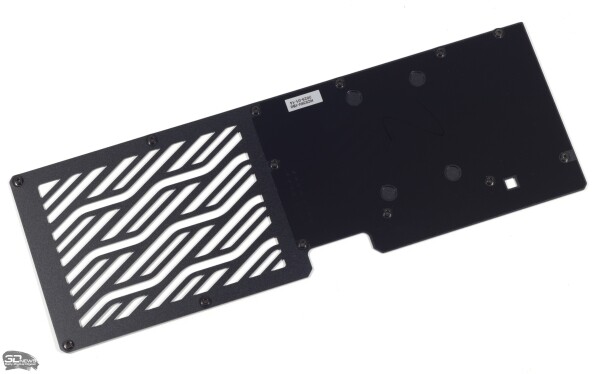
The side surfaces of the casing are formed by a die-cast aluminum frame with ventilation slots on the long sides. The protective plate on the reverse side of the PCB features a familiar grid for airflow through the heatsink. The fan blades have a diameter of 94 mm.
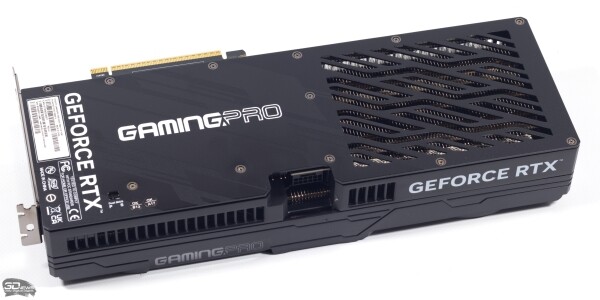
At the base of the cooler lies an evaporation chamber of sufficient size to cover the GPU die and its surrounding memory chips, while separate plate-type heat sinks are provided for the VRM components. The radiator fins are threaded onto eight heat pipes with a diameter of 6 mm.
The metal backplate serves only a protective and decorative function, as there are no thermal pads between it and the PCB.
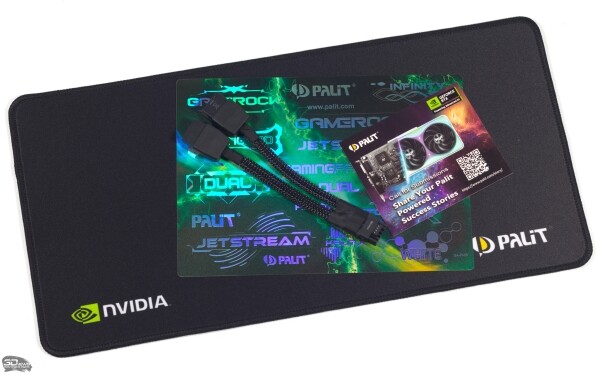
The graphics card comes with an adapter from two eight-pin power connectors to 12V-2×6 and a small cloth mouse pad.
Palit GeForce RTX 5070 Ti GamingPro: printed circuit board
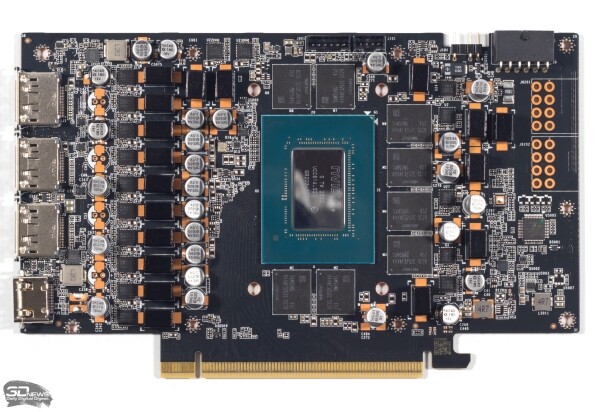
Unlike the graphics card , which we reviewed in the recent GeForce RTX 5080 analysis, the next senior model in the series is built on a spacious PCB, but its power system is simpler. The graphics processor features a 15-phase VRM managed by a Monolithic Power Systems MP29816 PWM controller. The memory chips’ GDDR7 power supply is three-phase, based on the MP2988 controller. Both regulators are equipped with MP87993 transistor assemblies with an estimated current rating of 90 A.
The marking of the Samsung K4VAF325ZC-SC28 memory chips indicates a bandwidth of 28 Gbps.
Like the Radeon RX 9070 XT from GIGABYTE, the Palit accelerator has two BIOS options — 'performance' and 'quiet'.
Test bench, testing methodology
| Test Stand | |
|---|---|
| CPU | AMD Ryzen 9 7950X3D (PBO +150 MHz, CU -20) |
| Motherboard | ASUS ROG Crosshair X670E Hero |
| Memory | G.Skill Trident Z5 Neo RGB (F5-6000J3040G32GX2-TZ5NR), 2 × 32 GB (6200 MT/s, CL30) |
| SSD | Solidigm P44 Pro, 2 TB |
| Power Supply | Corsair AX1600i, 1600 W |
| CPU Cooling System | Custom liquid cooling system (EK-Quantum Velocity² DDC 4.2 PWM D-RGB + EK-Quantum Surface X280M) |
| Case | Open stand |
| Operating system | Windows 11 Pro |
| GPU Software for AMD | |
| All graphics cards | AMD Software Adrenalin Edition 25.2.1/25.3.1 |
| GPU Software for NVIDIA | |
| All graphics cards | NVIDIA GeForce Game Ready Driver 532.60/532.70 |
| Games without ray tracing | |||
|---|---|---|---|
| Game | API | Testing Method | Graphics Settings |
| Alan Wake 2 | DirectX 12 | OCAT, Bright Falls location | Max. graphics quality |
| Black Myth: Wukong | DirectX 12 | Built-in benchmark | Max. graphics quality |
| Cyberpunk 2077 | DirectX 12 | Built-in benchmark | Max. graphics quality |
| F1 24 | DirectX 12 | Built-in benchmark, Monaco track (rain) | Max. graphics quality |
| Hogwarts Legacy | DirectX 12 | OCAT, cart ride in Path to Hogwarts | Max. graphics quality |
| Horizon Zero Dawn Remastered | DirectX 12 | Built-in benchmark | Max. graphics quality |
| Metro Exodus | DirectX 12 | Built-in benchmark | Max. graphics quality; Shading Rate: 100% |
| Red Dead Redemption 2 | Vulkan | Built-in benchmark | Max. graphics quality |
| Returnal | DirectX 12 | Built-in benchmark | Max. graphics quality |
| Total War: WARHAMMER III | DirectX 11 | Built-in benchmark (Mirrors of Madness Benchmark) | Max. graphics quality |
| Games with ray tracing | ||||||
|---|---|---|---|---|---|---|
| Game | API | Testing Method | Graphics Settings | Frame scaling | ||
| AMD | Intel | NVIDIA | ||||
| Alan Wake 2 | DirectX 12 | OCAT, Bright Falls location | Max. graphics quality, high ray tracing quality | FSR Balanced | FSR Balanced | DLSS Balanced + Ray Reconstruction (+ Frame Generation) |
| Black Myth: Wukong | Built-in benchmark | Max. graphics and ray tracing quality (Path Tracing) | FSR Balanced (+ Frame Generation) | XeSS Balanced/FSR Balanced + Frame Generation | DLSS Balanced (+ Frame Generation) | |
| Cyberpunk 2077 | Built-in benchmark (OCAT for frame generation) | Max. graphics and ray tracing quality (Path Tracing) | FSR Balanced (+ Frame Generation) | XeSS Balanced/FSR Balanced + Frame Generation | DLSS Balanced (Transformer Model) + Ray Reconstruction (+ Frame Generation) | |
| F1 24 | Built-in benchmark, Monaco track (rain) | Max. graphics quality and ray tracing | FSR Balanced (+ Frame Generation) | XeSS Balanced/FSR Balanced + Frame Generation | DLSS Balanced (+ Frame Generation) | |
| Hogwarts Legacy | OCAT, cart ride in Path to Hogwarts | Max. graphics quality and ray tracing | FSR Balanced | XeSS Balanced | DLSS Balanced + Ray Reconstruction (+ Frame Generation) | |
| Indiana Jones and the Great Circle | OCAT, location Sukhothai | Max. graphics quality, high quality ray tracing (Path Tracing); Ray Traced Shadows: Only Sunlight | FSR Balanced (+ Frame Generation) | XeSS Balanced/FSR Balanced + Frame Generation | DLSS Balanced (Transformer Model) + Ray Reconstruction (+ Frame Generation) | |
| Metro Exodus Enhanced Edition | Built-in benchmark | Max. graphics quality and ray tracing | N/A | N/A | DLSS Balanced | |
| Returnal | Built-in benchmark (OCAT for frame generation) | Max. graphics quality and ray tracing | FSR Balanced (+ Frame Generation) | XeSS Balanced/FSR Balanced + Frame Generation | DLSS Balanced (+ Frame Generation) | |
In most games, average and minimum frame rate (we indicate the 1st percentile of the distribution) is derived from an array of individual frame render times or the instant frame rate obtained with the built-in benchmark. The exception is games without a built-in benchmark and tests using frame generation: in these cases, to capture the inter-frame intervals, we use the OCAT program.
| Productivity applications | ||
|---|---|---|
| Application | Benchmark | Settings |
| Adobe Premiere Pro 25.x | Standard (4K) | |
| Blender 4.x | Demo Agent 327 Barbershop from Blender's website | Cycles Renderer |
| Blackmagic Design DaVinci Resolve Studio 19.x | Standard (4K); H.264/HEVC Encoding Mode: Auto | |
| CAD applications | SPECviewperf 2020 v3.1 | Screen resolution: 3840 × 2160 |
| Video decoding (ffmpeg 5.x) | |||
|---|---|---|---|
| Format | Resolution | Encoding settings | API |
| H.264 (YUV 4:2:0, 8 bits/channel) | 1920 × 1080 | High Profile, L4.1 | D3D11VA |
| 3840 × 2160 | High Profile, L5.1 | ||
| HEVC (YUV 4:2:0, 8 bits/channel) | 1920 × 1080 | Main Profile, L4.0 | |
| 3840 × 2160 | Main Profile, L5.0 | ||
| 7680 × 4320 | Main Profile, L6.0 | ||
| VP9 (YUV 4:2:0, 8 bits/channel) | 1920 × 1080 | N/A | |
| 3840 × 2160 | |||
| 7680 × 4320 | |||
| AV1 (YUV 4:2:0, 8 bits/channel) | 1920 × 1080 | Main Profile, L4.0 | |
| 3840 × 2160 | Main Profile, L5.0 | ||
| 7680 × 4320 | Main Profile, L6.0 | ||
| Video encoding (ffmpeg 5.x) | |||||||
|---|---|---|---|---|---|---|---|
| Format | Resolution | Encoding settings | API | ||||
| AMD | Intel | NVIDIA | AMD | Intel | NVIDIA | ||
| H.264 (YUV 4:2:0, 8 bits/channel) | 1920 × 1080 | -c:v h264_amf -quality speed -coder cabac -refs 1 -b:v 3M | -c:v h264_qsv -preset veryfast -profile:v main -level 4.1 -b:v 3M | -c:v h264_nvenc -preset fast -coder cabac -refs 1 -b:v 3M | AMF | oneVPL | NVENC |
| 3840 × 2160 | -c:v h264_amf -quality speed -coder cabac -refs 1 -b:v 7.5M | -c:v h264_qsv -preset veryfast -profile:v main -level 5.1 -b:v 7.5M | -c:v h264_nvenc -preset fast -coder cabac -refs 1 -b:v 7.5M | ||||
| HEVC (YUV 4:2:0, 8 bits/channel) | 1920 × 1080 | -c:v hevc_amf -quality speed -b:v 3M | -c:v hevc_qsv -preset veryfast -tier main -b:v 3M | -c:v hevc_nvenc -preset fast -b:v 3M | |||
| 3840 × 2160 | -c:v hevc_amf -quality speed -b:v 7.5M | -c:v hevc_qsv -preset veryfast -tier main -b:v 7.5M | -c:v hevc_nvenc -preset fast -b:v 7.5M | ||||
| 7680 × 4320 | -c:v hevc_amf -quality speed -b:v 20M | -c:v hevc_qsv -preset veryfast -tier main -b:v 20M | -c:v hevc_nvenc -preset fast -b:v 20M | ||||
| AV1 (YUV 4:2:0, 8 bits/channel) | 1920 × 1080 | -c:v hevc_amf -quality speed -b:v 3M | -c:v av1_qsv -preset veryfast -profile main -b:v 3M | -c:v hevc_nvenc -preset fast -b:v 3M | |||
| 3840 × 2160 | -c:v hevc_amf -quality speed -b:v 7.5M | -c:v av1_qsv -preset veryfast -profile main -b:v 7.5M | -c:v hevc_nvenc -preset fast -b:v 7.5M | ||||
| 7680 × 4320 | -c:v hevc_amf -quality speed -b:v 20M | -c:v av1_qsv -preset veryfast -profile main -b:v 20M | -c:v hevc_nvenc -preset fast -b:v 20M | ||||
The power of the graphics cards is recorded separately from the CPU and other PC components using the NVIDIA PCAT device. For load testing and noise levels, Cyberpunk 2077 is used at a resolution of 3840 × 2160 with maximum graphics quality settings (without ray tracing), along with the FurMark stress test using the most aggressive settings (resolution 3840 × 2160, MSAA 8x). All parameters are measured after the graphics card has warmed up, when the GPU temperature and clock speeds stabilize.
Testing participants
The following graphics cards participated in the performance testing:
- AMD Radeon RX 9070 XT (1820/3060 MHz, 20 Gbit/s, 16 GB);
- NVIDIA GeForce RTX 5070 Ti (2295/2452 MHz, 28 Gbit/s, 16 GB);
- ;
- ;
- ;
- ;
- ;
- .
Example. The base and boost GPU frequencies are indicated in parentheses.
Clock speeds, power consumption, temperature, noise level, and overclocking
The Navi 48 GPU has lost the clock domain separation between the front end and the CU array, which AMD introduced in the previous generation Navi chips. However, regardless of which of the two frequencies of the outgoing flagship GPU (Navi 31) is taken as a reference point, the Navi 48 made a significant leap forward — reaching 2.9 GHz. The GeForce RTX 5070 Ti, on the other hand, settles for 2.8 GHz clock speed under gaming load.
| Operating parameters under load (Cyberpunk 2077) | |||||||||
|---|---|---|---|---|---|---|---|---|---|
| Graphics Card | Settings | GPU clock speed, MHz (shader domain) | GPU clock speed, MHz (front-end) | GPU Power Voltage, V | Fan Speed, RPM (% of max.) | Fan speed 2, RPM (% of max.) | |||
| Avg. | Max. | Avg. | Max. | Avg. | Max. | Avg. | Avg. | ||
| GIGABYTE Radeon RX 9070 XT GAMING OC (1820/3060 MHz, 20 Gbit/s, 16 GB) | Silent BIOS | 2900 | 2956 | N/A | N/A | 1,01 | 1,01 | 1479 (30%) | N/A |
| GIGABYTE Radeon RX 9070 XT GAMING OC (1820/3060 MHz, 20 Gbit/s, 16 GB) | Performance BIOS | 2915 | 2941 | N/A | N/A | 1,01 | 1,01 | 1696 (34%) | N/A |
| GIGABYTE Radeon RX 9070 XT GAMING OC (+300 MHz, 22 Gbit/s, 16 GB) | Performance BIOS, +10% TBP | 2980 | 3001 | N/A | N/A | 1,03 | 1,04 | 1880 (38%) | N/A |
| SAPPHIRE NITRO+ Radeon RX 7900 XTX (1720/2499 MHz, 20 Gbit/s, 24 GB) | Secondary BIOS | 2545 | 2585 | 2753 | 2785 | 0,91 | 0,93 | 1412 (34%) | N/A |
| Palit GeForce RTX 5070 Ti GamingPro (2295/2452 MHz, 28 Gbit/s, 16 GB) | Silent BIOS | 2816 | 2820 | N/A | N/A | 1,06 | 1,06 | 1357 (36%) | 1357 (36%) |
| Palit GeForce RTX 5070 Ti GamingPro (2295/2452 MHz, 28 Gbit/s, 16 GB) | Performance BIOS | 2827 | 2835 | N/A | N/A | 1,06 | 1,06 | 1859 (50%) | 1859 (50%) |
| Palit GeForce RTX 5070 Ti GamingPro (+400 MHz, 32 Gbit/s, 16 GB) | Performance BIOS | 3202 | 3210 | N/A | N/A | 1,05 | 1,05 | 2010 (55%) | 2010 (55%) |
| Palit GeForce RTX 4070 Ti GameRock OC Classic (2310/2610 MHz, 21 Gbit/s, 12 GB) | Silent BIOS | 2805 | 2805 | N/A | N/A | 1,10 | 1,10 | 1516 (39%) | 1516 (39%) |
| Palit GeForce RTX 4070 Ti SUPER JetStream OC (2340/2640 MHz, 21 Gbit/s, 16 GB) | 2673 | 2700 | N/A | N/A | 1,04 | 1,05 | 1417 (38%) | 1417 (38%) | |
| NVIDIA GeForce RTX 4080 FE (2205/2505 MHz, 22.4 Gbit/s, 16 GB) | 2775 | 2775 | N/A | N/A | 1,08 | 1,08 | 1383 (43%) | 1299 (39%) | |
| Palit GeForce RTX 4080 SUPER JetStream OC (2295/2580 MHz, 23 Gbit/s, 16 GB) | 2722 | 2745 | N/A | N/A | 1,04 | 1,07 | 1473 (39%) | 1473 (39%) | |
| Palit GeForce RTX 5080 GameRock (2295/2617 MHz, 30 Gbit/s, 16 GB) | Silent BIOS | 2790 | 2790 | N/A | N/A | 1,04 | 1,04 | 1490 (40%) | 1490 (40%) |
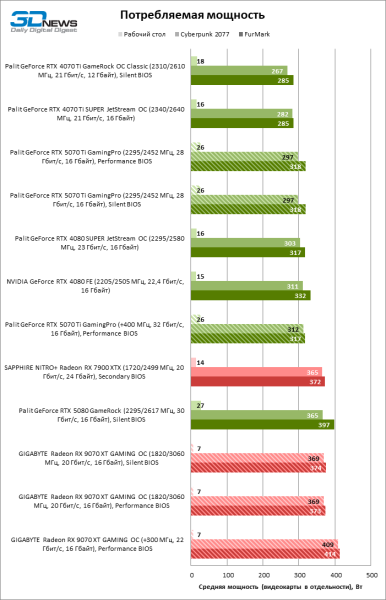
While the Radeon RX 9070 XT may not be the flagship model of its generation (which this time there won’t be), the power consumption of the GIGABYTE version reaches 374W — almost on par with the Radeon RX 7900 XTX. In contrast, the power draw of the 'red' graphics card is surprisingly low in idle conditions — just 7W. The GeForce RTX 5070 Ti from Palit consumes no more than 318W — comparable to the 80s models in the 40 series.
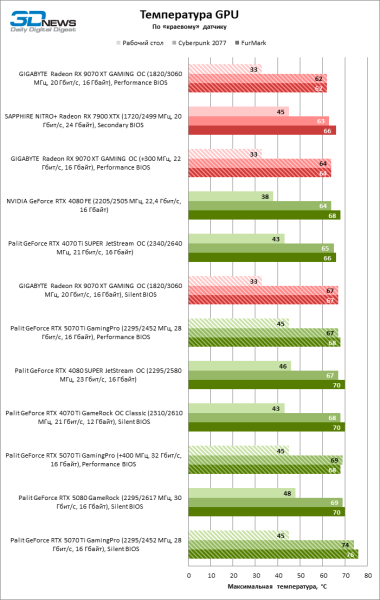
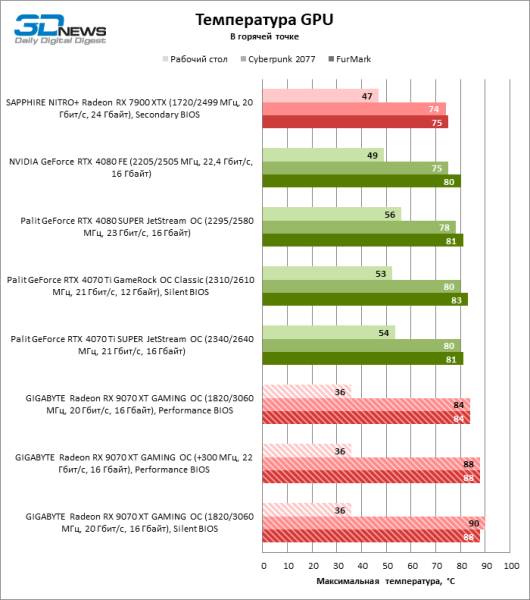
The choice of firmware — 'quiet' or 'performance' — significantly affects the cooling system of the GIGABYTE Radeon RX 9070 XT GAMING OC. In 'performance' mode, the GPU temperature does not exceed 62 °C (and 84 at its hottest point), while the memory chips heat up to 94 °C. In 'quiet' mode, the temperature changes to 67, 90, and 98 °C respectively.
Conversely, the cooling system of the Palit GeForce RTX 5070 Ti GamingPro maintains the temperature of the graphics processor between 68 or 76 °C (again, depending on the active BIOS version), while the VRAM chips reach a much more acceptable level of 70 or 78 °C. The GPU's hotspot temperature is not reported to monitoring utilities by the GeForce 50 graphics card driver.
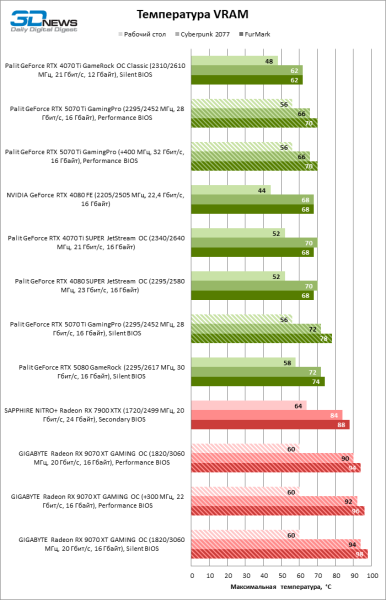
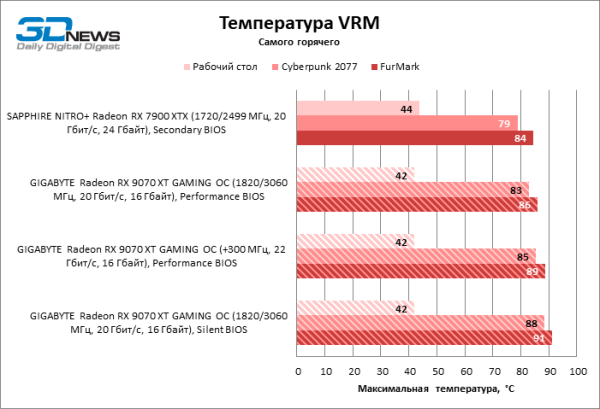
The noise level of the cooling systems of both newcomers varies sharply, depending on the BIOS switch. In 'quiet' mode, the Palit GeForce RTX 5070 Ti GamingPro turns out to be the quietest among the compared devices, while the GIGABYTE Radeon RX 9070 XT GAMING exhibits moderate sound pressure, taking into account its significant power consumption. On the other hand, under 'performance' BIOS management, the GIGABYTE graphics card maintains an acceptable noise level, while the Palit GamingPro reaches 45 dBA — and this is still without overclocking.
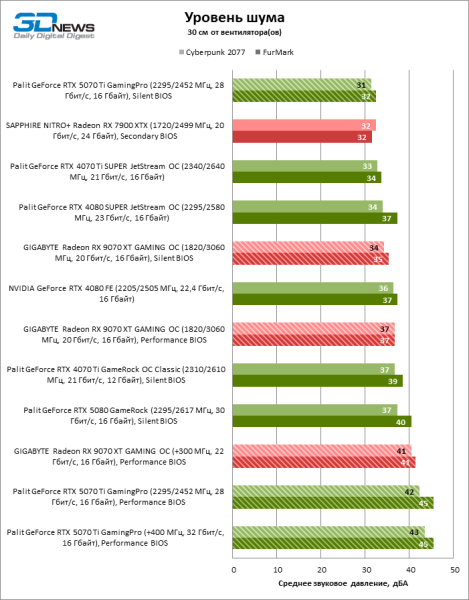
The new AMD graphics processors overclock similarly to NVIDIA chips: now, instead of a maximum clock speed limit, the user specifies the desired increment. The GPU voltage is regulated only downward. Our sample graphics card maintained stability with a target clock frequency increase of 300 MHz, but due to the power reserve only being able to increase by 10%, the actual core frequency rose by a modest 65 MHz. In turn, the video memory achieved a bandwidth of 22 instead of the original 20 Gbps. The power consumption of the GIGABYTE Radeon RX 9070 XT GAMING exceeded 400W during overclocking, resulting in a temperature increase of a couple of degrees, while the noise level reached 41 dBA at a distance of 30 cm from the fans.
Conversely, the GeForce RTX 5070 Ti from Palit, like the GeForce RTX 5080, overclocks excellently. Although the version of the device without the OC label does not allow exceeding the factory TBP, we managed to add 375 MHz to the actual GPU clock frequency in gaming tests and increase the GDDR7 memory bandwidth from 28 to 32 Gbps. Overclocking had little impact on power consumption and component temperatures, and the noise level remained unchanged only because it was quite high initially with the 'performance' firmware.
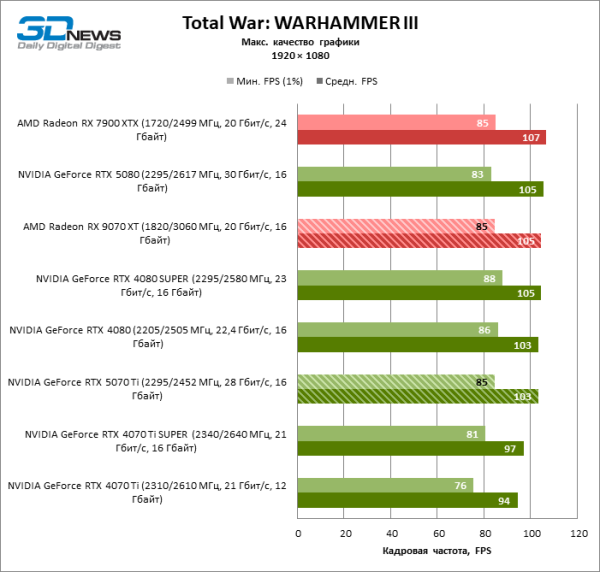
Gaming Tests (1920 × 1080)
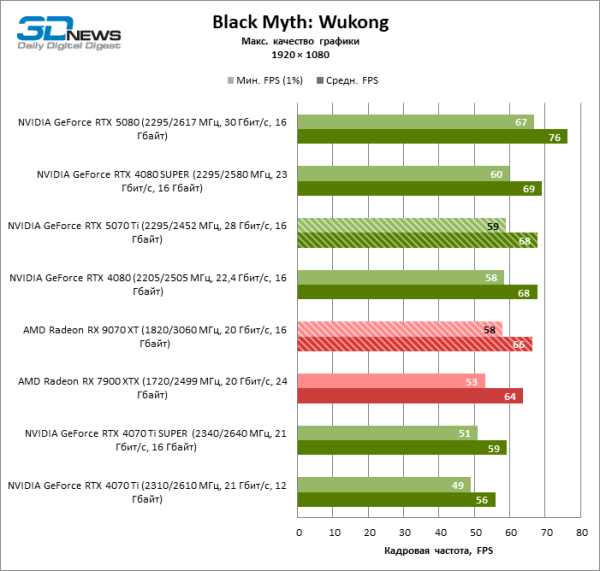
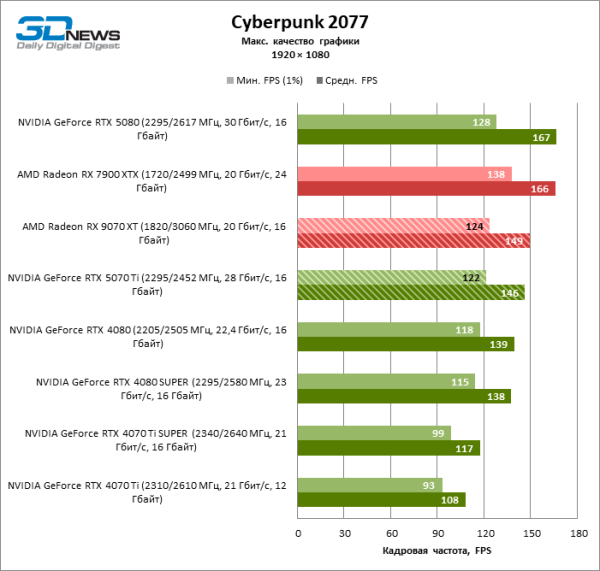
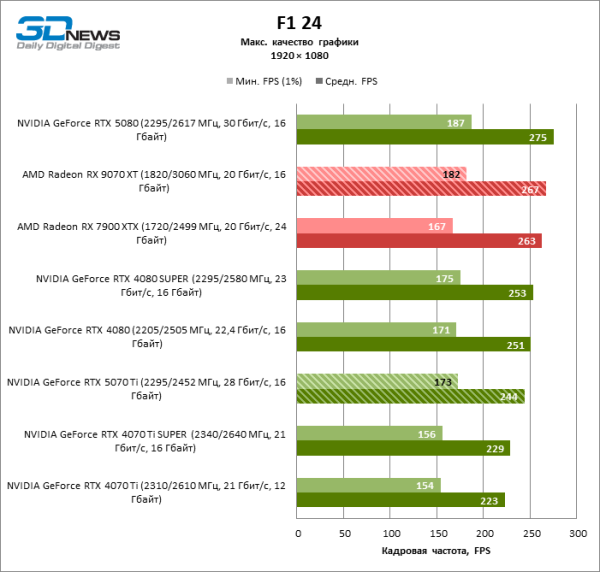
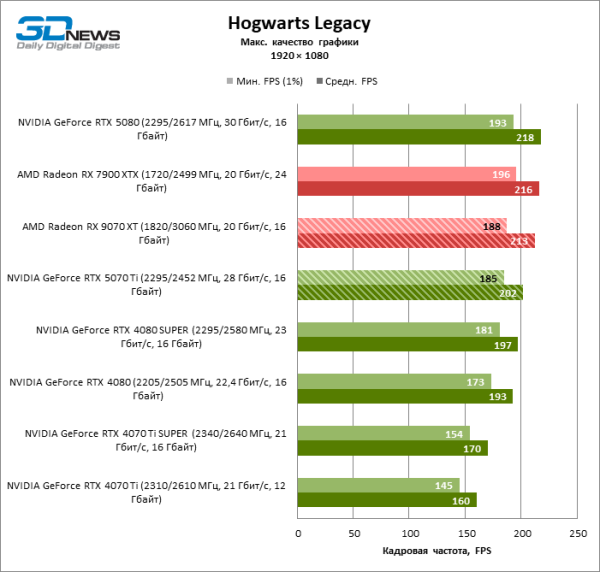
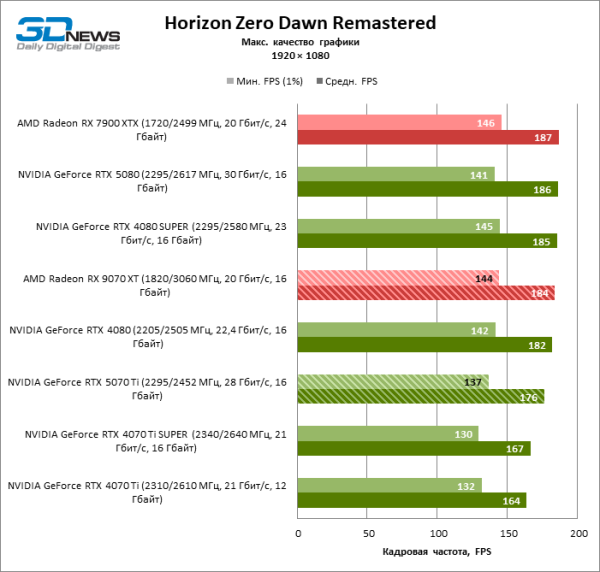
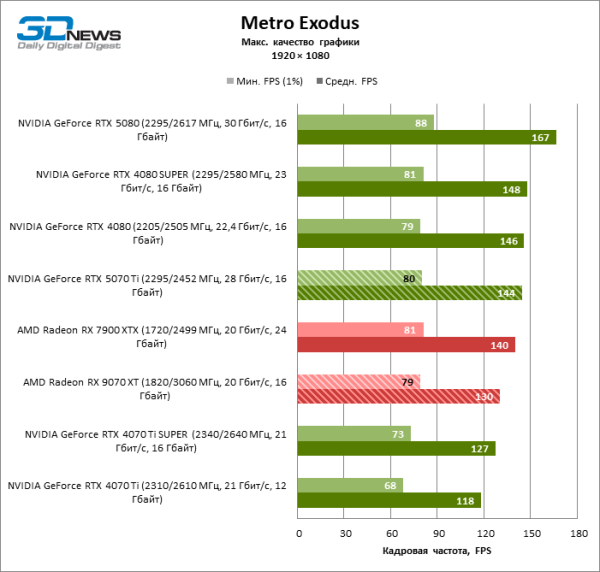
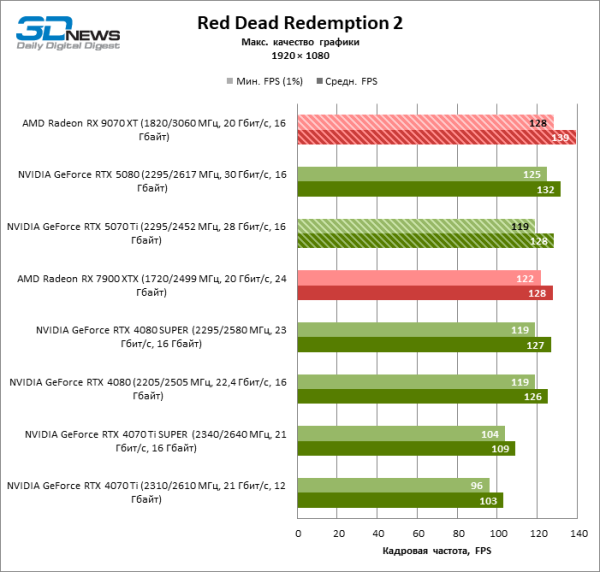
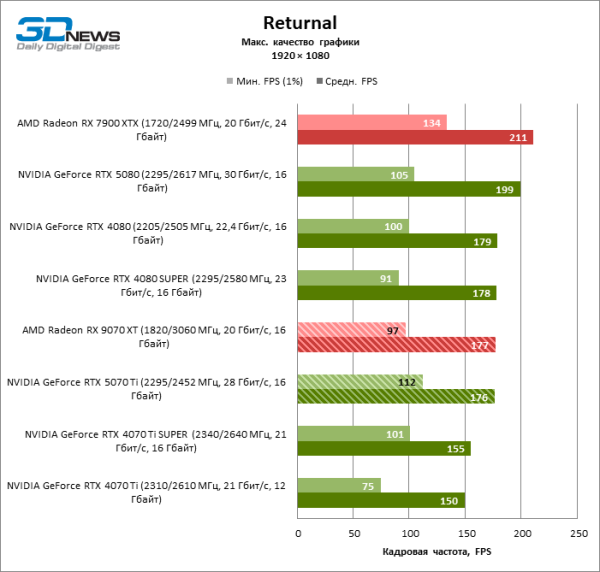
At 1080p resolution, both the GeForce RTX 5070 Ti and the Radeon RX 9070 XT achieve frame rates exceeding 100 FPS in most tested titles and no less than 60 FPS in Black Myth: Wukong.
| 1920 × 1080 | ||||||||
|---|---|---|---|---|---|---|---|---|
| AMD Radeon RX 9070 XT | AMD Radeon RX 7900 XTX | NVIDIA GeForce RTX 4070 Ti | NVIDIA GeForce RTX 4070 Ti SUPER | NVIDIA GeForce RTX 4080 | NVIDIA GeForce RTX 4080 SUPER | NVIDIA GeForce RTX 5070 Ti | NVIDIA GeForce RTX 5080 | |
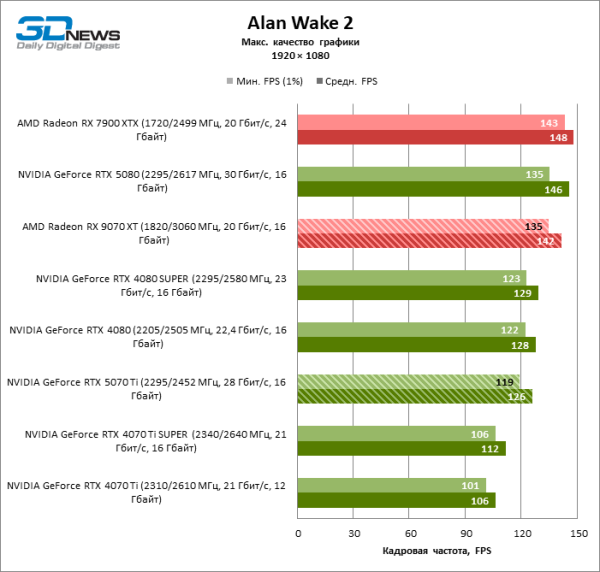
| Alan Wake 2 | 135 / 142 | 143 / 148 | 101 / 106 | 106 / 112 | 122 / 128 | 123 / 129 | 119 / 126 | 135 / 146 |
| Black Myth: Wukong | 58 / 66 | 53 / 64 | 49 / 56 | 51 / 59 | 58 / 68 | 60 / 69 | 59 / 68 | 67 / 76 |
| Cyberpunk 2077 | 124 / 149 | 138 / 166 | 93 / 108 | 99 / 117 | 118 / 139 | 115 / 138 | 122 / 146 | 128 / 167 |
| F1 24 | 182 / 267 | 167 / 263 | 154 / 223 | 156 / 229 | 171 / 251 | 175 / 253 | 173 / 244 | 187 / 275 |
| Hogwarts Legacy | 188 / 213 | 196 / 216 | 145 / 160 | 154 / 170 | 173 / 193 | 181 / 197 | 185 / 202 | 193 / 218 |
| Horizon Zero Dawn Remastered | 144 / 184 | 146 / 187 | 132 / 164 | 130 / 167 | 142 / 182 | 145 / 185 | 137 / 176 | 141 / 186 |
| Metro Exodus | 79 / 130 | 81 / 140 | 68 / 118 | 73 / 127 | 79 / 146 | 81 / 148 | 80 / 144 | 88 / 167 |
| Red Dead Redemption 2 | 128 / 139 | 122 / 128 | 96 / 103 | 104 / 109 | 119 / 126 | 119 / 127 | 119 / 128 | 125 / 132 |
| Returnal | 97 / 177 | 134 / 211 | 75 / 150 | 101 / 155 | 100 / 179 | 91 / 178 | 112 / 176 | 105 / 199 |
| Total War: WARHAMMER III | 85 / 105 | 85 / 107 | 76 / 94 | 81 / 97 | 86 / 103 | 88 / 105 | 85 / 103 | 83 / 105 |
| Max. | +19% | −9% | −2% | +12% | +14% | +11% | +28% | |
| Avg. | +4% | −18% | −14% | −3% | −2% | −3% | +7% | |
| Min. | −8% | −28% | −22% | −10% | −9% | −11% | −5% | |
Although some games prefer either AMD or NVIDIA architecture, practically speaking, the new releases offer equal performance: the GeForce RTX 5070 Ti lags behind the Radeon RX 9070 XT by just 3% in FPS. Compared to previous generation devices, the Radeon RX 9070 XT falls behind the Radeon RX 7900 XTX by 3%. The GeForce RTX 5070 Ti is equivalent to the GeForce RTX 4080 and RTX 4080 SUPER, while the difference between the RTX 4070 Ti SUPER and the RTX 5070 Ti amounts to 13% in frame rate.
Gaming Tests (2560 × 1440)
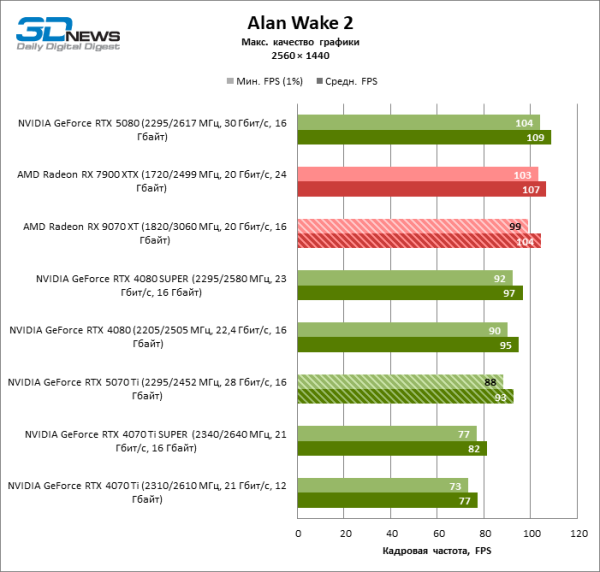
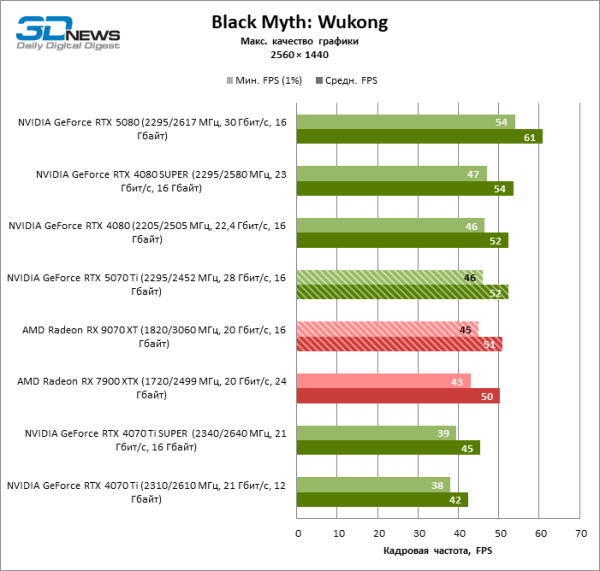
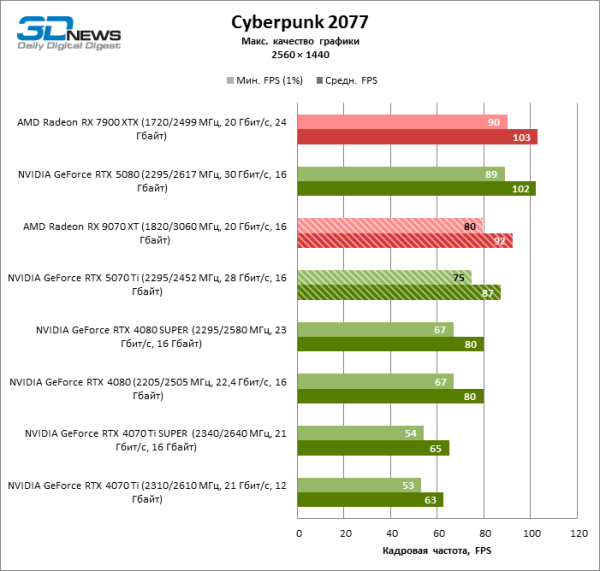
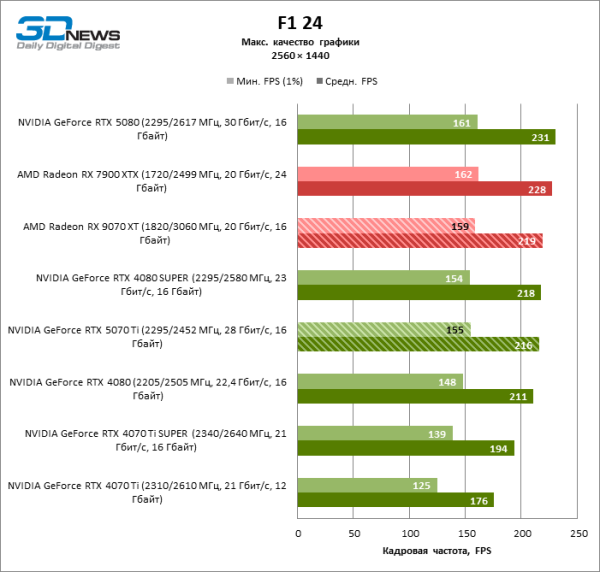
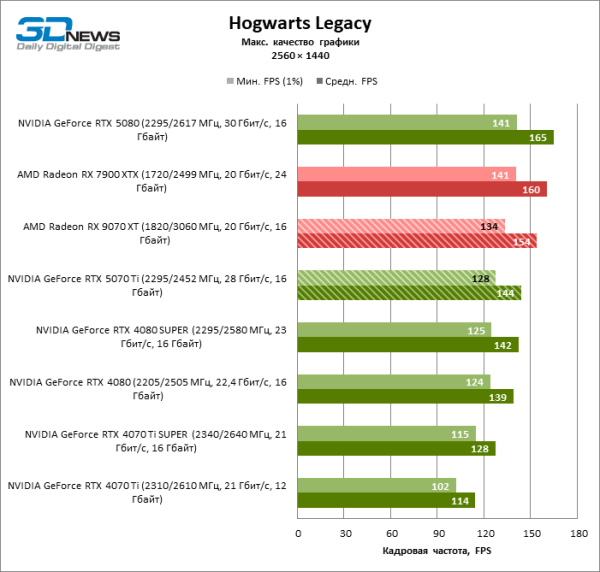
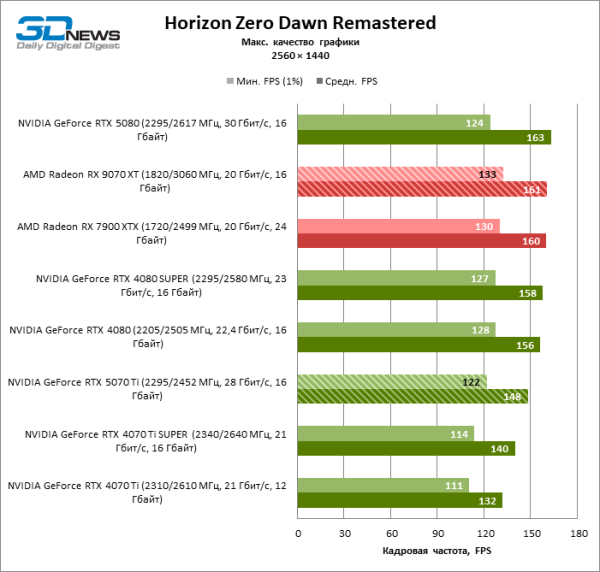
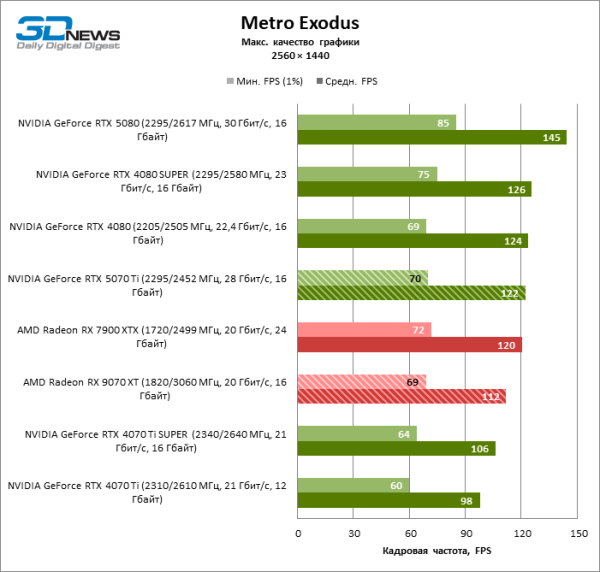
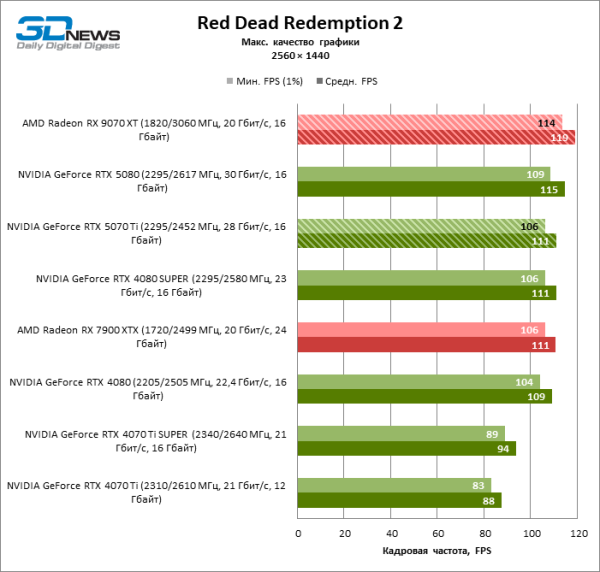
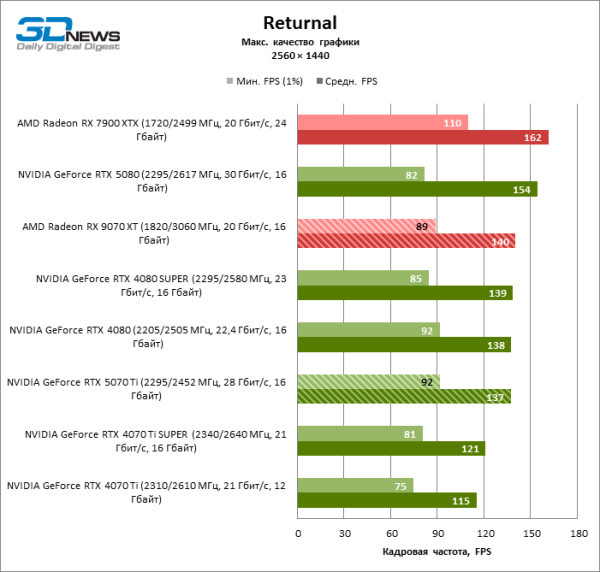
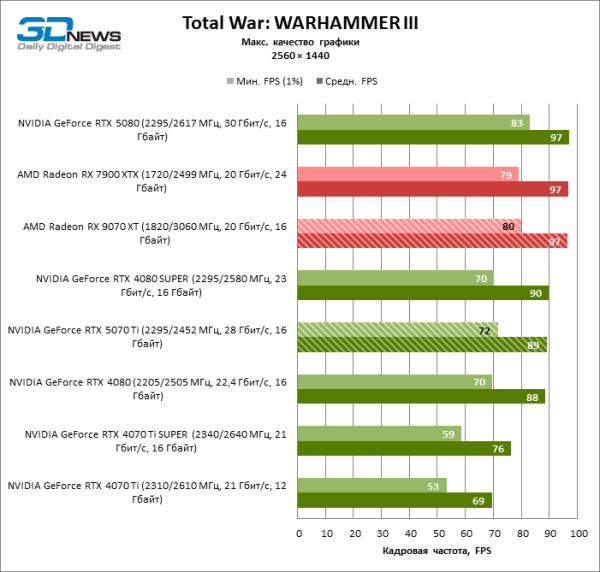
In most benchmarks at 1440p resolution, the new AMD and NVIDIA models achieve frame rates of no less than 80 FPS, although the average frame rate in Black Myth: Wukong drops to around 51-52 FPS.
| 2560 × 1440 | ||||||||
|---|---|---|---|---|---|---|---|---|
| AMD Radeon RX 9070 XT | AMD Radeon RX 7900 XTX | NVIDIA GeForce RTX 4070 Ti | NVIDIA GeForce RTX 4070 Ti SUPER | NVIDIA GeForce RTX 4080 | NVIDIA GeForce RTX 4080 SUPER | NVIDIA GeForce RTX 5070 Ti | NVIDIA GeForce RTX 5080 | |
| Alan Wake 2 | 99 / 104 | 103 / 107 | 73 / 77 | 77 / 82 | 90 / 95 | 92 / 97 | 88 / 93 | 104 / 109 |
| Black Myth: Wukong | 45 / 51 | 43 / 50 | 38 / 42 | 39 / 45 | 46 / 52 | 47 / 54 | 46 / 52 | 54 / 61 |
| Cyberpunk 2077 | 80 / 92 | 90 / 103 | 53 / 63 | 54 / 65 | 67 / 80 | 67 / 80 | 75 / 87 | 89 / 102 |
| F1 24 | 159 / 219 | 162 / 228 | 125 / 176 | 139 / 194 | 148 / 211 | 154 / 218 | 155 / 216 | 161 / 231 |
| Hogwarts Legacy | 134 / 154 | 141 / 160 | 102 / 114 | 115 / 128 | 124 / 139 | 125 / 142 | 128 / 144 | 141 / 165 |
| Horizon Zero Dawn Remastered | 133 / 161 | 130 / 160 | 111 / 132 | 114 / 140 | 128 / 156 | 127 / 158 | 122 / 148 | 124 / 163 |
| Metro Exodus | 69 / 112 | 72 / 120 | 60 / 98 | 64 / 106 | 69 / 124 | 75 / 126 | 70 / 122 | 85 / 145 |
| Red Dead Redemption 2 | 114 / 119 | 106 / 111 | 83 / 88 | 89 / 94 | 104 / 109 | 106 / 111 | 106 / 111 | 109 / 115 |
| Returnal | 89 / 140 | 110 / 162 | 75 / 115 | 81 / 121 | 92 / 138 | 85 / 139 | 92 / 137 | 82 / 154 |
| Total War: WARHAMMER III | 80 / 97 | 79 / 97 | 53 / 69 | 59 / 76 | 70 / 88 | 70 / 90 | 72 / 89 | 83 / 97 |
| Max. | +16% | −13% | −5% | +11% | +13% | +9% | +29% | |
| Avg. | +4% | −22% | −17% | −4% | −3% | −4% | +9% | |
| Min. | −7% | −32% | −29% | −13% | −13% | −11% | −3% | |
The Radeon RX 9070 XT and GeForce RTX 5070 Ti are separated by a nearly negligible distance of 4% in frame rate. The new generation 'Red' graphics card also lags behind the former flagship, the Radeon RX 7900 XTX, by just 4%, while the GeForce RTX 5070 Ti remains a substitute for the 80-series models of the previous generation. In comparison to the GeForce RTX 4070 Ti SUPER, the new NVIDIA model has become 15% faster.
Gaming tests (3840 × 2160)
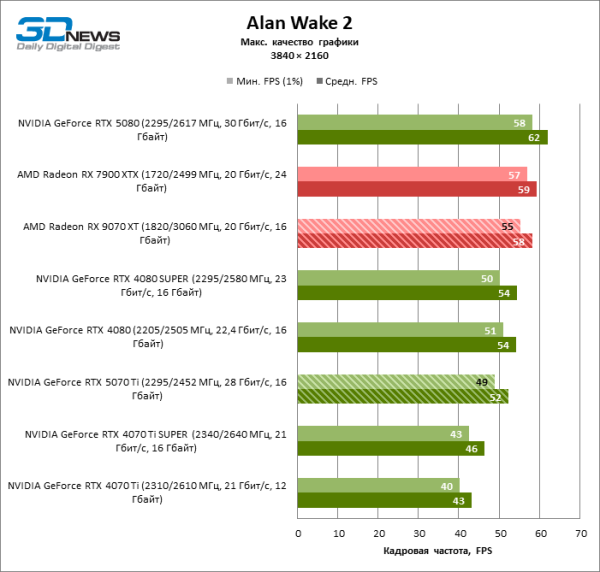
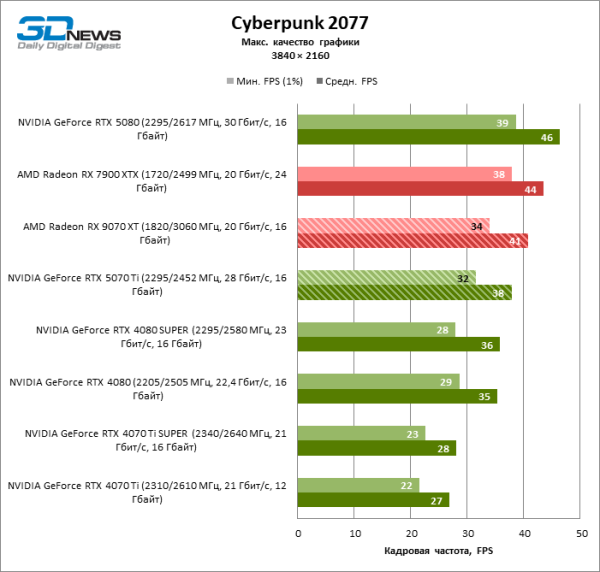
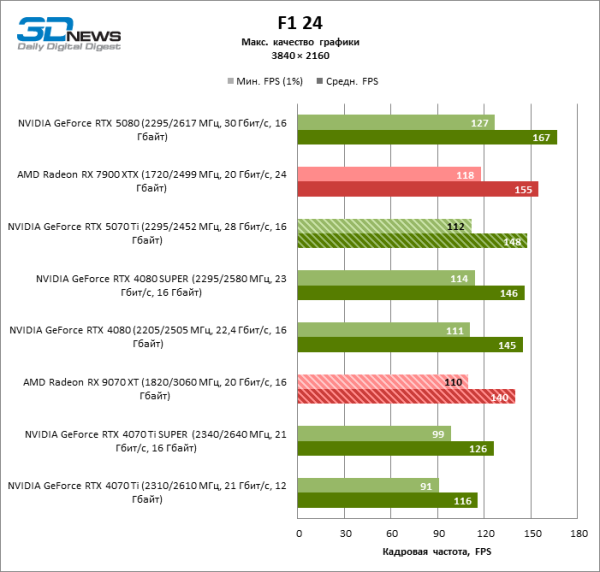
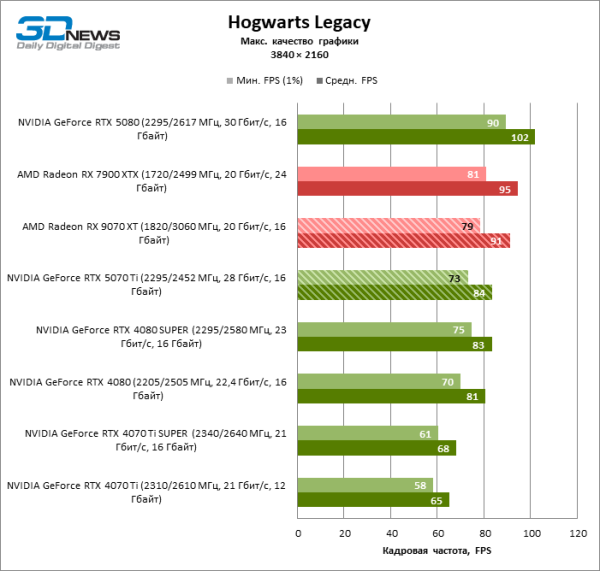
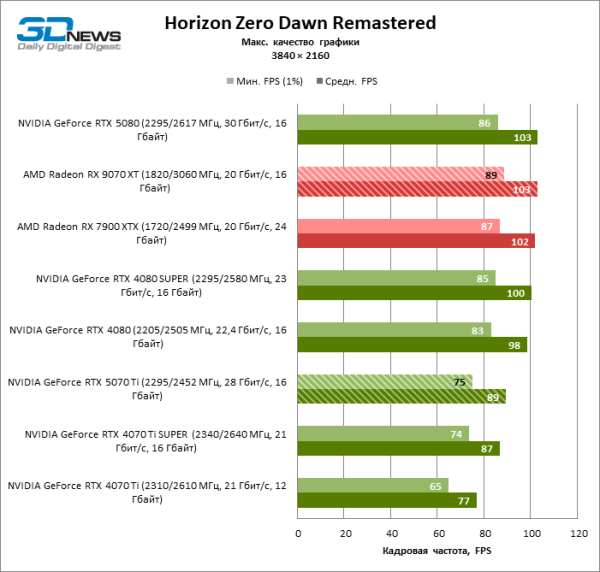
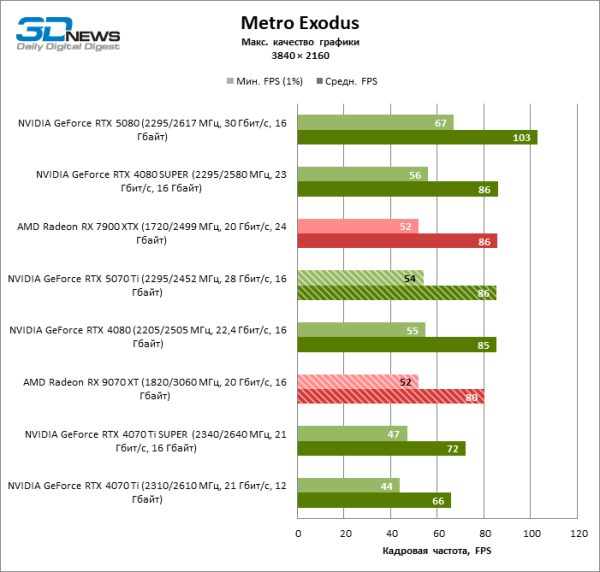
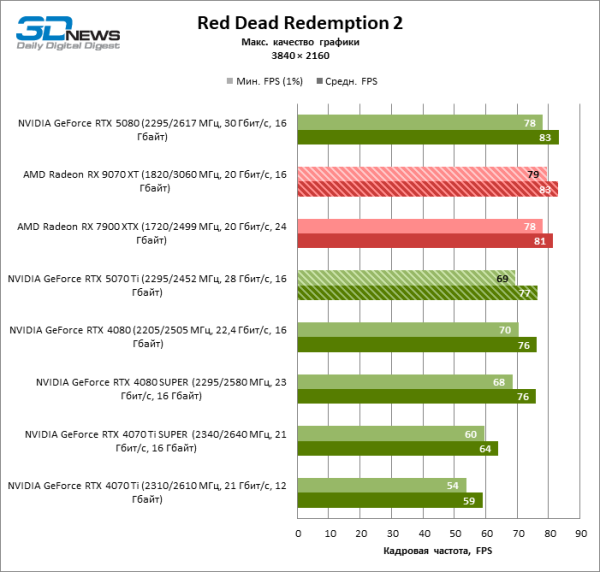
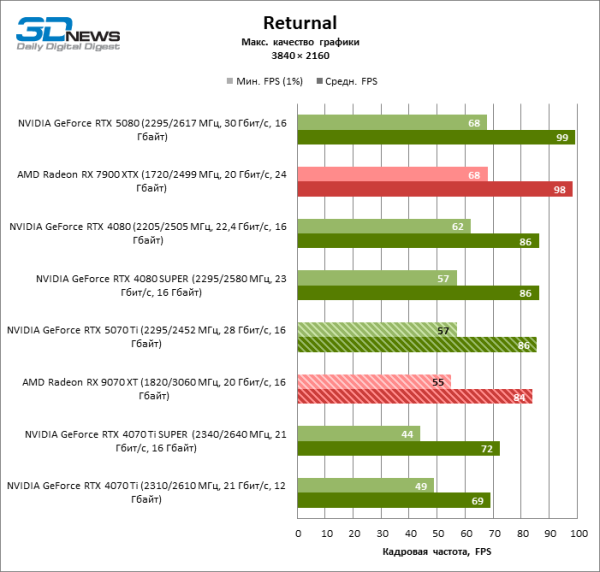
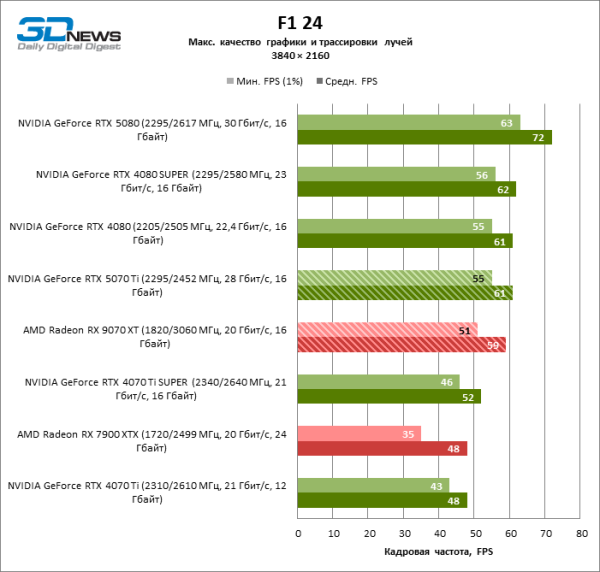
The Radeon RX 9070 XT and GeForce RTX 5070 Ti are generally suitable for gaming on a 4K screen at maximum graphic quality. Only in resource-intensive titles like Black Myth: Wukong and Cyberpunk 2077 will users have to cope with frame rates noticeably below 60 FPS or utilize upscaling.
| 3840 × 2160 | ||||||||
|---|---|---|---|---|---|---|---|---|
| AMD Radeon RX 9070 XT | AMD Radeon RX 7900 XTX | NVIDIA GeForce RTX 4070 Ti | NVIDIA GeForce RTX 4070 Ti SUPER | NVIDIA GeForce RTX 4080 | NVIDIA GeForce RTX 4080 SUPER | NVIDIA GeForce RTX 5070 Ti | NVIDIA GeForce RTX 5080 | |
| Alan Wake 2 | 55 / 58 | 57 / 59 | 40 / 43 | 43 / 46 | 51 / 54 | 50 / 54 | 49 / 52 | 58 / 62 |
| Black Myth: Wukong | 27 / 31 | 27 / 31 | 22 / 25 | 24 / 27 | 28 / 31 | 28 / 32 | 28 / 31 | 33 / 36 |
| Cyberpunk 2077 | 34 / 41 | 38 / 44 | 22 / 27 | 23 / 28 | 29 / 35 | 28 / 36 | 32 / 38 | 39 / 46 |
| F1 24 | 110 / 140 | 118 / 155 | 91 / 116 | 99 / 126 | 111 / 145 | 114 / 146 | 112 / 148 | 127 / 167 |
| Hogwarts Legacy | 79 / 91 | 81 / 95 | 58 / 65 | 61 / 68 | 70 / 81 | 75 / 83 | 73 / 84 | 90 / 102 |
| Horizon Zero Dawn Remastered | 89 / 103 | 87 / 102 | 65 / 77 | 74 / 87 | 83 / 98 | 85 / 100 | 75 / 89 | 86 / 103 |
| Metro Exodus | 52 / 80 | 52 / 86 | 44 / 66 | 47 / 72 | 55 / 85 | 56 / 86 | 54 / 86 | 67 / 103 |
| Red Dead Redemption 2 | 79 / 83 | 78 / 81 | 54 / 59 | 60 / 64 | 70 / 76 | 68 / 76 | 69 / 77 | 78 / 83 |
| Returnal | 55 / 84 | 68 / 98 | 49 / 69 | 44 / 72 | 62 / 86 | 57 / 86 | 57 / 86 | 68 / 99 |
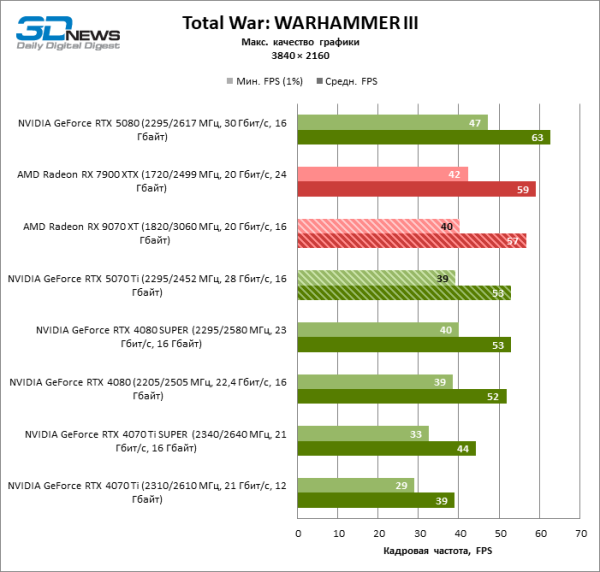
| Total War: WARHAMMER III | 40 / 57 | 42 / 59 | 29 / 39 | 33 / 44 | 39 / 52 | 40 / 53 | 39 / 53 | 47 / 63 |
| Max. | +17% | −17% | −10% | +6% | +8% | +8% | +29% | |
| Avg. | +5% | −25% | −19% | −4% | −3% | −4% | +12% | |
| Min. | −2% | −34% | −32% | −15% | −12% | −14% | 0% | |
High resolution has not changed the positions of the main competitors: the Radeon RX 9070 XT still outperforms the GeForce RTX 5070 Ti by 4% in average frame rate, but at the same time lags 5% behind the Radeon RX 7900 XTX. The GeForce RTX 5070 Ti still replaces the GeForce RTX 4080 and RTX 4080 SUPER, and the advantage over the RTX 4070 Ti SUPER has increased to 18% FPS.
Gaming tests with ray tracing
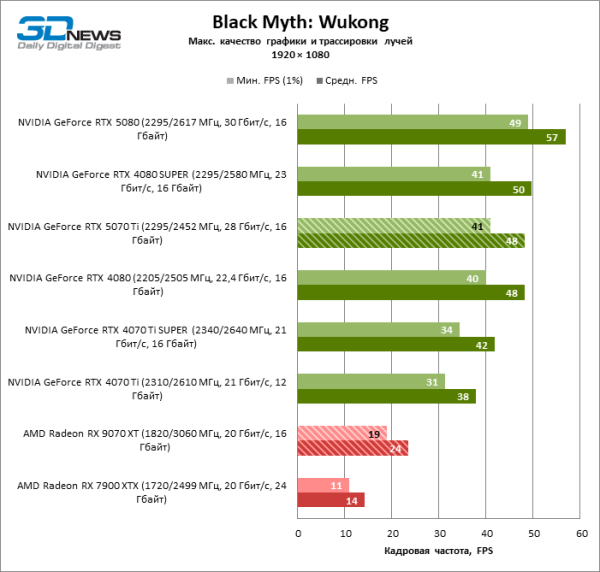
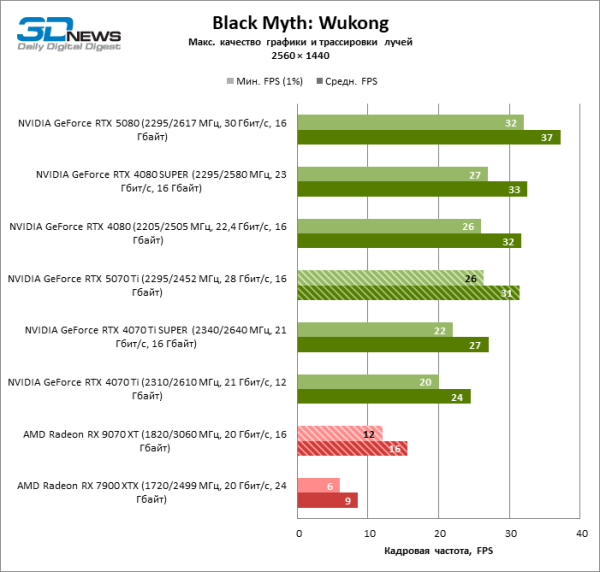
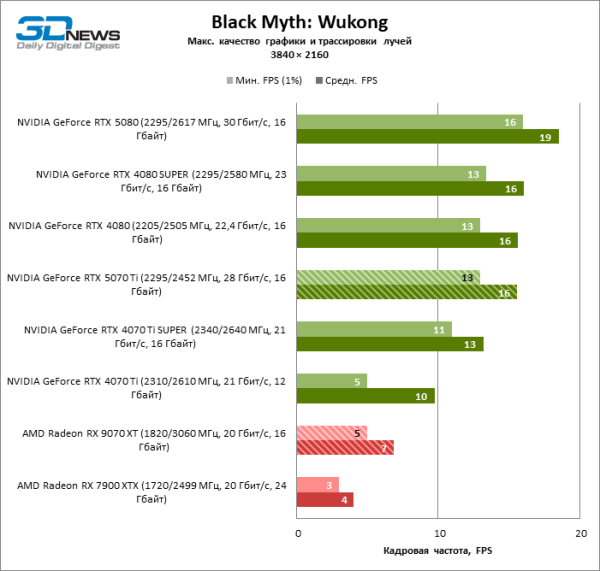
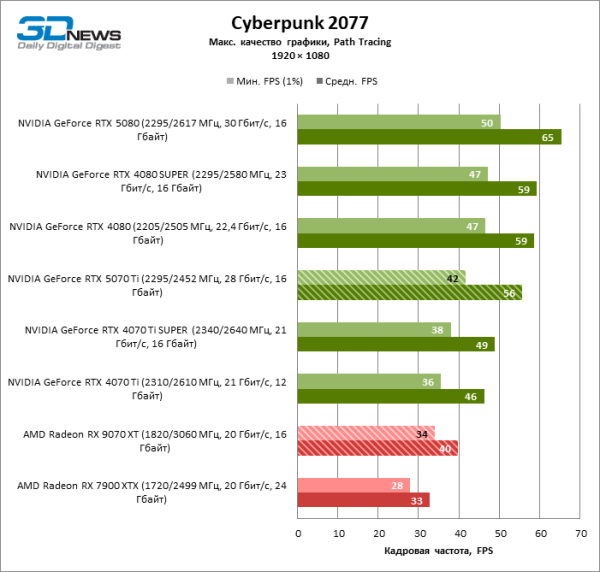
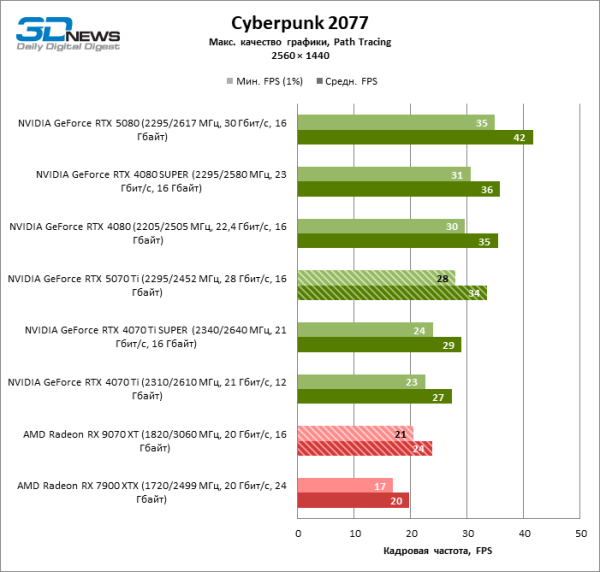
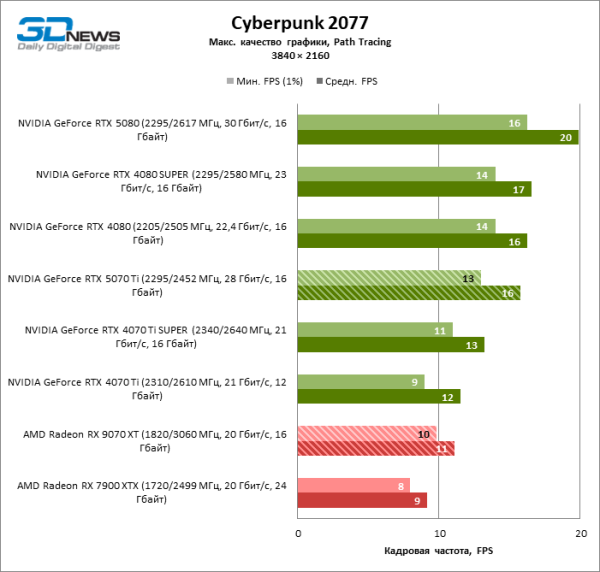
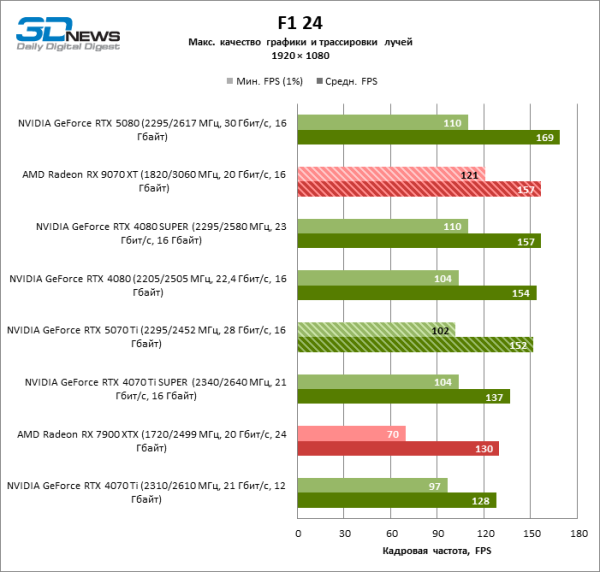
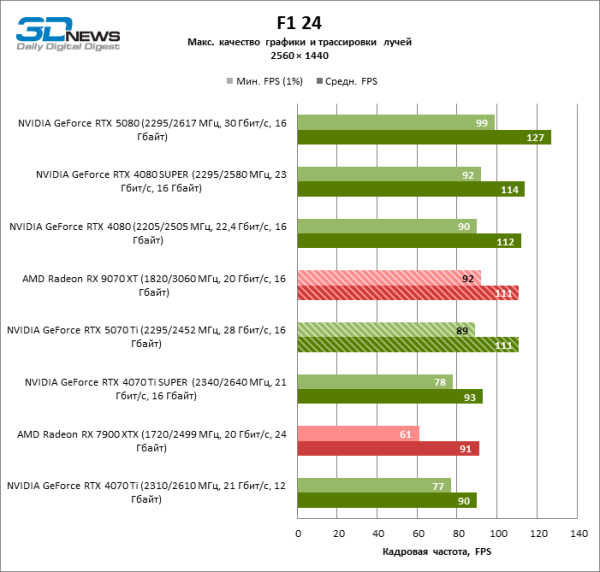
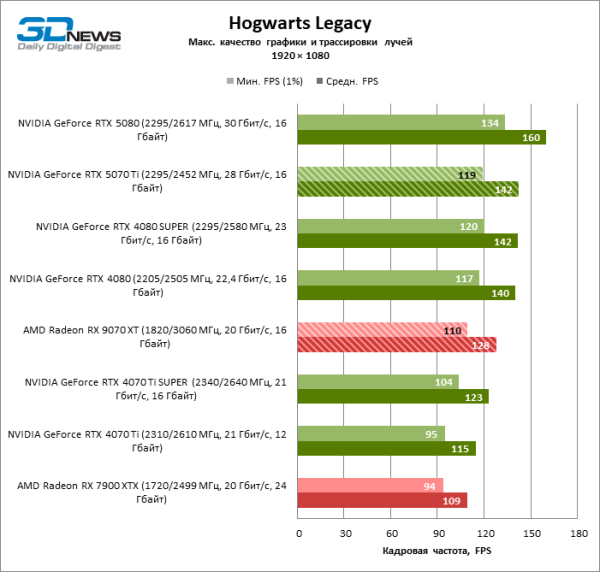
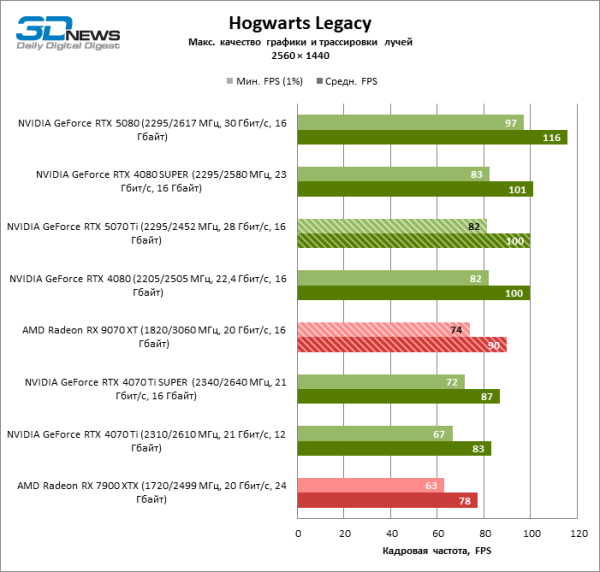
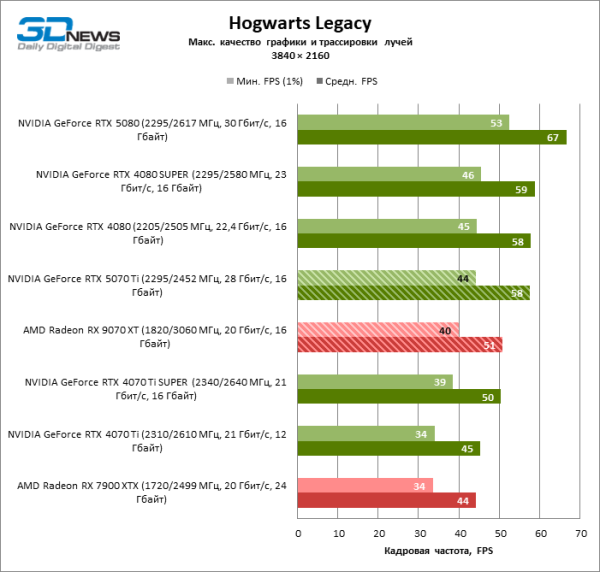
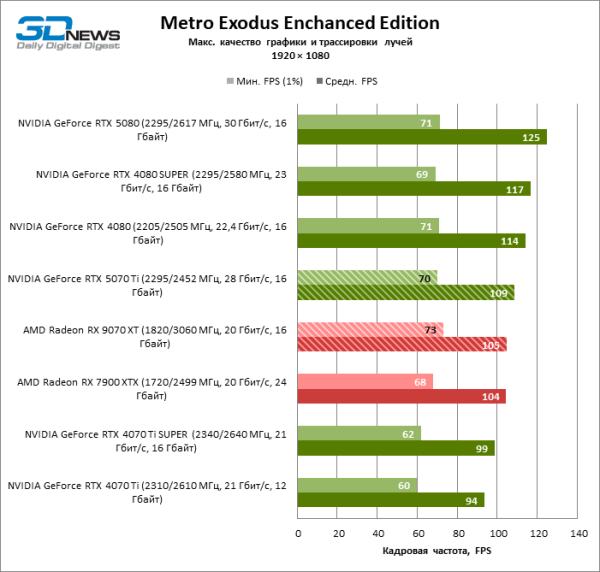
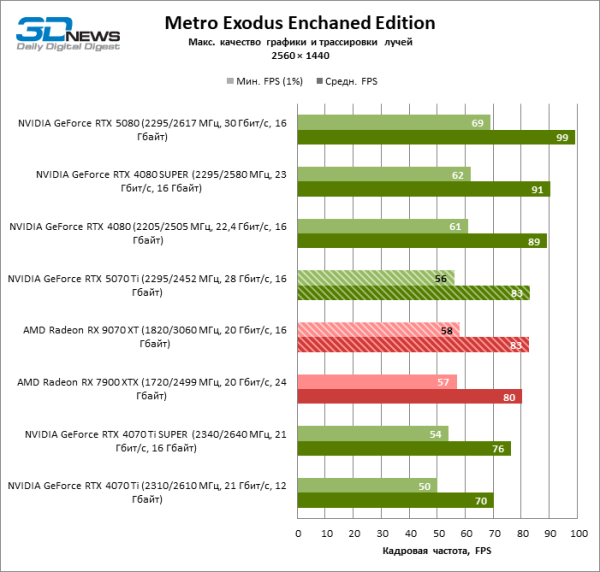
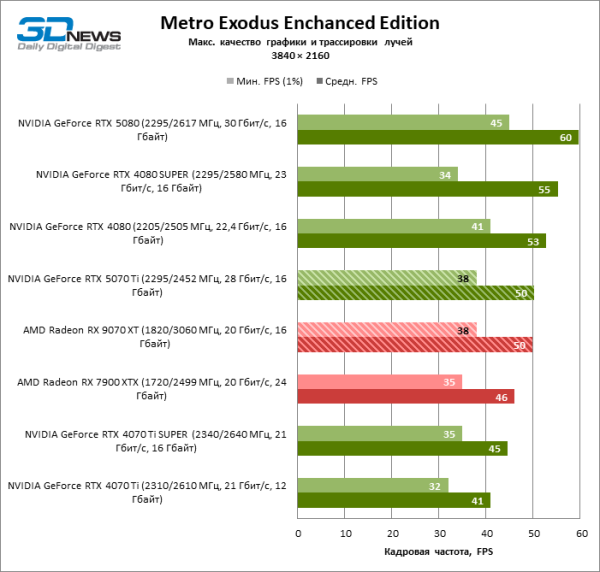
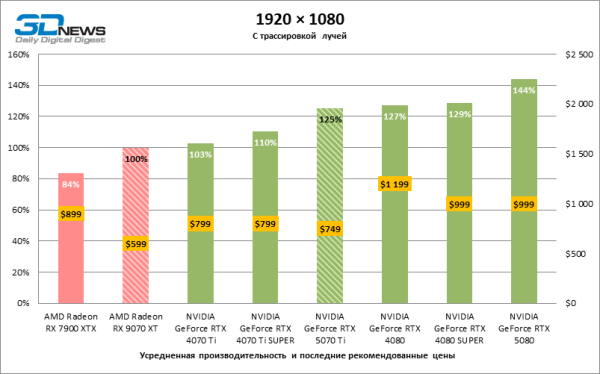
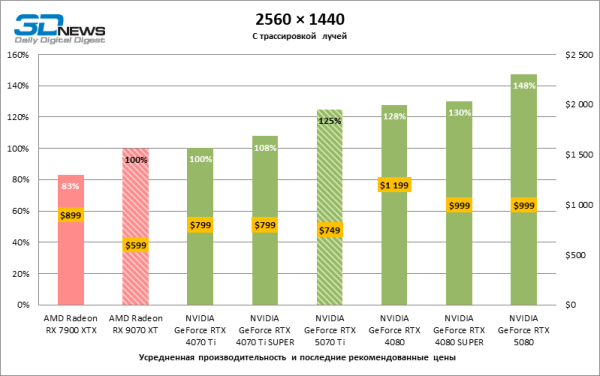
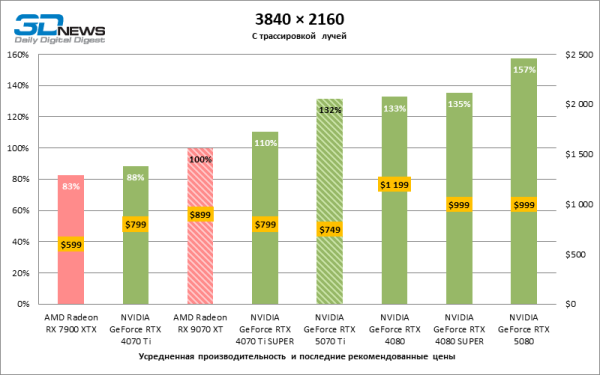
Ray-tracing games are the most demanding test that the new AMD accelerators will face after years of lagging behind NVIDIA's solutions in this area. Fortunately, there have been significant improvements. Although in rasterized games, the Radeon RX 9070 XT is comparable to the Radeon RX 7900 XTX and even falls short of the former flagship on average, in ray tracing, the Radeon RX 9070 XT is ahead by 20–21% FPS.
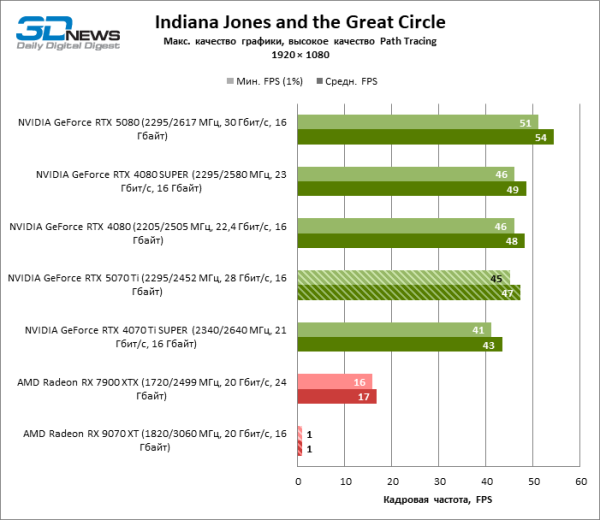
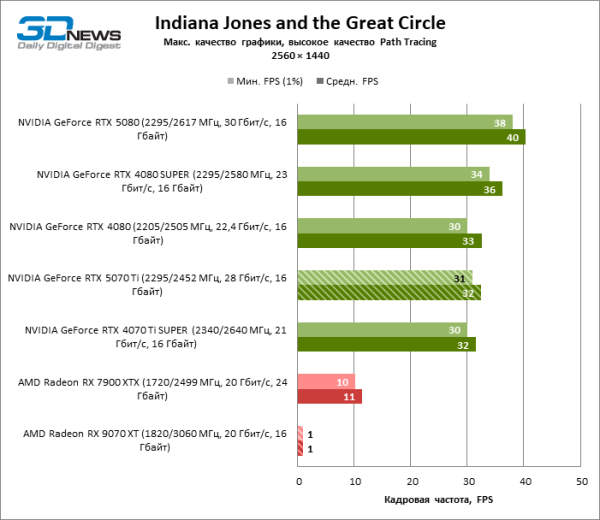
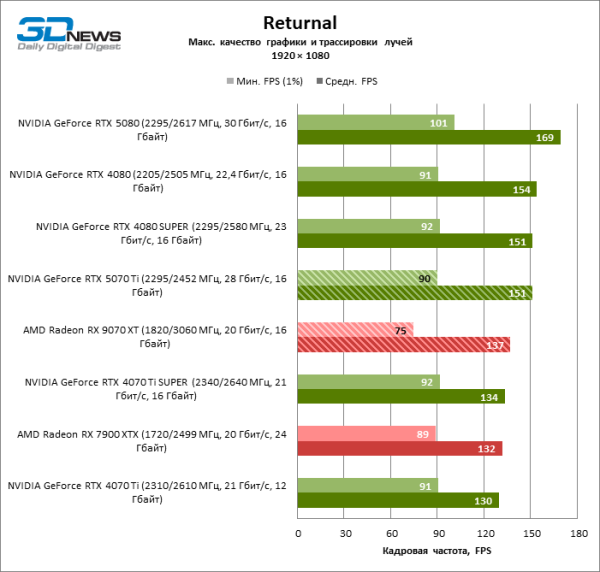
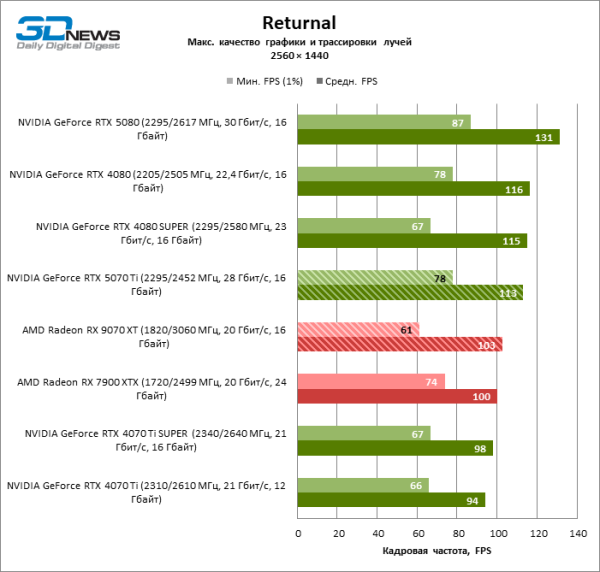
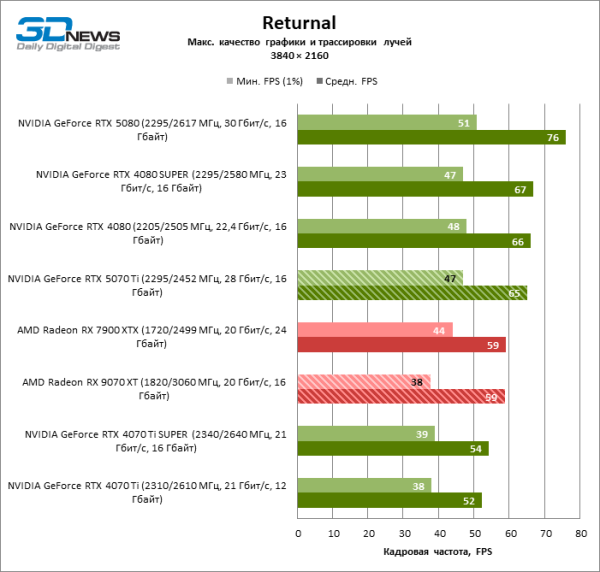
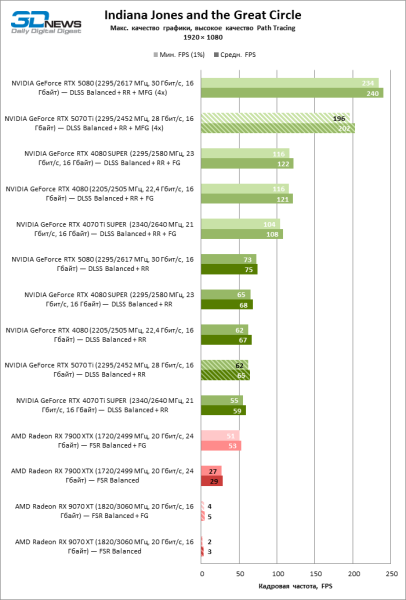
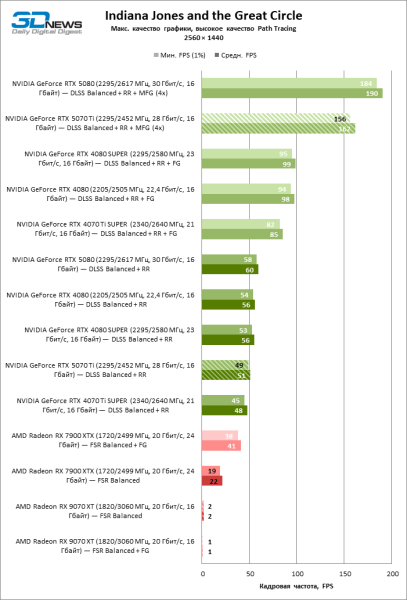
However, there are games where the difference is small (Metro Exodus and Returnal), and in Indiana Jones and the Great Circle, the frame rate on the Radeon RX 9070 XT dropped to 1 FPS even with FSR enabled, apparently due to insufficient VRAM. This game only enabled ray tracing for 'red' GPU owners in its latest expansion. Necessary driver optimizations are likely lacking, so we did not take the results from Indiana Jones and the Great Circle into account when calculating percentage ratios among the test participants. By the way, among all test participants, only the Radeon RX 7900 XTX has the required video memory to run Indiana Jones and the Great Circle at 4K resolution with maximum graphic quality. The other devices cannot manage even with the most aggressive scaling settings.
| 1920 × 1080 | ||||||||
|---|---|---|---|---|---|---|---|---|
| AMD Radeon RX 9070 XT | AMD Radeon RX 7900 XTX | NVIDIA GeForce RTX 4070 Ti | NVIDIA GeForce RTX 4070 Ti SUPER | NVIDIA GeForce RTX 4080 | NVIDIA GeForce RTX 4080 SUPER | NVIDIA GeForce RTX 5070 Ti | NVIDIA GeForce RTX 5080 | |
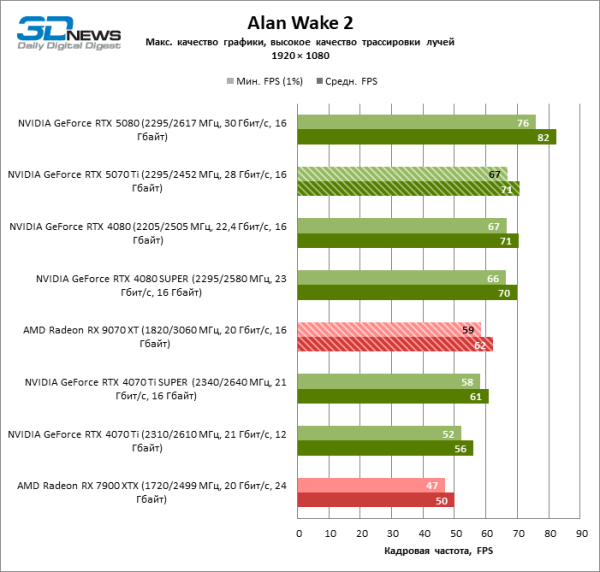
| Alan Wake 2 | 59 / 62 | 47 / 50 | 52 / 56 | 58 / 61 | 67 / 71 | 66 / 70 | 67 / 71 | 76 / 82 |
| Black Myth: Wukong | 19 / 24 | 11 / 14 | 31 / 38 | 34 / 42 | 40 / 48 | 41 / 50 | 41 / 48 | 49 / 57 |
| Cyberpunk 2077 | 34 / 40 | 28 / 33 | 36 / 46 | 38 / 49 | 47 / 59 | 47 / 59 | 42 / 56 | 50 / 65 |
| F1 24 | 121 / 157 | 70 / 130 | 97 / 128 | 104 / 137 | 104 / 154 | 110 / 157 | 102 / 152 | 110 / 169 |
| Hogwarts Legacy | 110 / 128 | 94 / 109 | 95 / 115 | 104 / 123 | 117 / 140 | 120 / 142 | 119 / 142 | 134 / 160 |
| Indiana Jones and the Great Circle | N/A | 16 / 17 | N/A | 41 / 43 | 46 / 48 | 46 / 49 | 45 / 47 | 51 / 54 |
| Metro Exodus Enhanced Edition | 73 / 105 | 68 / 104 | 60 / 94 | 62 / 99 | 71 / 114 | 69 / 117 | 70 / 109 | 71 / 125 |
| Returnal | 75 / 137 | 89 / 132 | 91 / 130 | 92 / 134 | 91 / 154 | 92 / 151 | 90 / 151 | 101 / 169 |
| Max. | −1% | +58% | +75% | +100% | +108% | +100% | +138% | |
| Avg. | −16% | +3% | +10% | +27% | +29% | +25% | +44% | |
| Min. | −42% | −18% | −13% | −2% | 0% | −3% | +8% | |
| 2560 × 1440 | ||||||||
|---|---|---|---|---|---|---|---|---|
| AMD Radeon RX 9070 XT | AMD Radeon RX 7900 XTX | NVIDIA GeForce RTX 4070 Ti | NVIDIA GeForce RTX 4070 Ti SUPER | NVIDIA GeForce RTX 4080 | NVIDIA GeForce RTX 4080 SUPER | NVIDIA GeForce RTX 5070 Ti | NVIDIA GeForce RTX 5080 | |
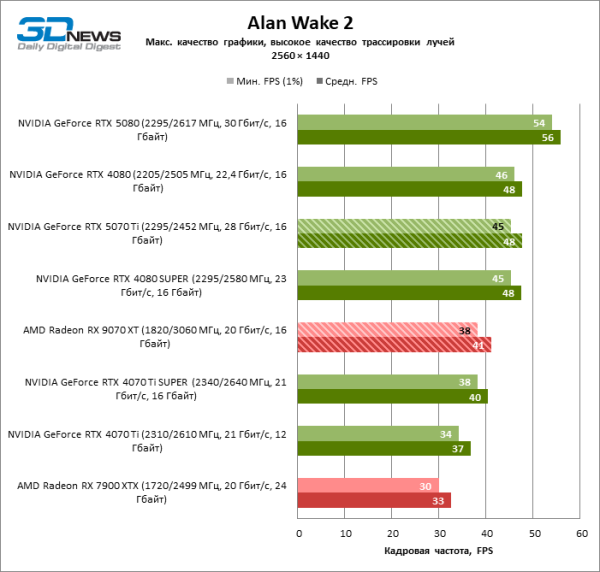
| Alan Wake 2 | 38 / 41 | 30 / 33 | 34 / 37 | 38 / 40 | 46 / 48 | 45 / 48 | 45 / 48 | 54 / 56 |
| Black Myth: Wukong | 12 / 16 | 6 / 9 | 20 / 24 | 22 / 27 | 26 / 32 | 27 / 33 | 26 / 31 | 32 / 37 |
| Cyberpunk 2077 | 21 / 24 | 17 / 20 | 23 / 27 | 24 / 29 | 30 / 35 | 31 / 36 | 28 / 34 | 35 / 42 |
| F1 24 | 92 / 111 | 61 / 91 | 77 / 90 | 78 / 93 | 90 / 112 | 92 / 114 | 89 / 111 | 99 / 127 |
| Hogwarts Legacy | 74 / 90 | 63 / 78 | 67 / 83 | 72 / 87 | 82 / 100 | 83 / 101 | 82 / 100 | 97 / 116 |
| Indiana Jones and the Great Circle | N/A | 10 / 11 | N/A | 30 / 32 | 30 / 33 | 34 / 36 | 31 / 32 | 38 / 40 |
| Metro Exodus Enhanced Edition | 58 / 83 | 57 / 80 | 50 / 70 | 54 / 76 | 61 / 89 | 62 / 91 | 56 / 83 | 69 / 99 |
| Returnal | 61 / 103 | 74 / 100 | 66 / 94 | 67 / 98 | 78 / 116 | 67 / 115 | 78 / 113 | 87 / 131 |
| Max. | −3% | +50% | +69% | +100% | +106% | +94% | +131% | |
| Avg. | −17% | 0% | +8% | +28% | +30% | +25% | +48% | |
| Min. | −44% | −19% | −16% | +1% | +3% | 0% | +14% | |
| 3840 × 2160 | ||||||||
|---|---|---|---|---|---|---|---|---|
| AMD Radeon RX 9070 XT | AMD Radeon RX 7900 XTX | NVIDIA GeForce RTX 4070 Ti | NVIDIA GeForce RTX 4070 Ti SUPER | NVIDIA GeForce RTX 4080 | NVIDIA GeForce RTX 4080 SUPER | NVIDIA GeForce RTX 5070 Ti | NVIDIA GeForce RTX 5080 | |
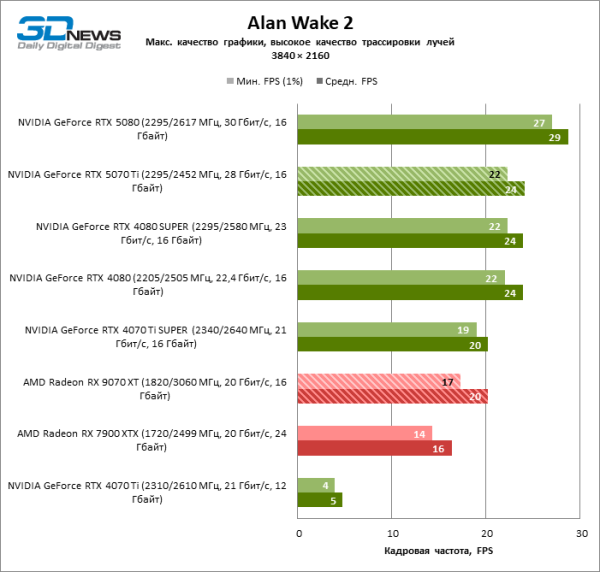
| Alan Wake 2 | 17 / 20 | 14 / 16 | 4 / 5 | 19 / 20 | 22 / 24 | 22 / 24 | 22 / 24 | 27 / 29 |
| Black Myth: Wukong | 5 / 7 | 3 / 4 | 5 / 10 | 11 / 13 | 13 / 16 | 13 / 16 | 13 / 16 | 16 / 19 |
| Cyberpunk 2077 | 10 / 11 | 8 / 9 | 9 / 12 | 11 / 13 | 14 / 16 | 14 / 17 | 13 / 16 | 16 / 20 |
| F1 24 | 51 / 59 | 35 / 48 | 43 / 48 | 46 / 52 | 55 / 61 | 56 / 62 | 55 / 61 | 63 / 72 |
| Hogwarts Legacy | 40 / 51 | 34 / 44 | 34 / 45 | 39 / 50 | 45 / 58 | 46 / 59 | 44 / 58 | 53 / 67 |
| Indiana Jones and the Great Circle | N/A | 5 / 6 | N/A | N/A | N/A | N/A | N/A | N/A |
| Metro Exodus Enhanced Edition | 38 / 50 | 35 / 46 | 32 / 41 | 35 / 45 | 41 / 53 | 34 / 55 | 38 / 50 | 45 / 60 |
| Returnal | 38 / 59 | 44 / 59 | 38 / 52 | 39 / 54 | 48 / 66 | 47 / 67 | 47 / 65 | 51 / 76 |
| Max. | 0% | +43% | +86% | +129% | +129% | +129% | +171% | |
| Avg. | −17% | −12% | +10% | +33% | +35% | +32% | +57% | |
| Min. | −43% | −75% | −12% | +3% | +5% | 0% | +20% | |
In absolute terms, the Radeon RX 9070 XT offers the required performance for titles with hybrid rendering at resolutions up to 1440p and, with some effort, 4K.
The same applies to the GeForce RTX 5070 Ti, yet on average, the NVIDIA device leads with an advantage of 25–32% — mainly due to fully ray-traced games. Within its own camp, the GeForce RTX 5070 Ti has confirmed its status as the successor to the GeForce RTX 4080 and RTX 4080 SUPER: the advantage of the latter lies in the range of 1 to 5% in frame rates. Compared to the GeForce RTX 4070 Ti SUPER, performance increased by 13 to 19%.
Gaming tests with ray tracing and frame scaling
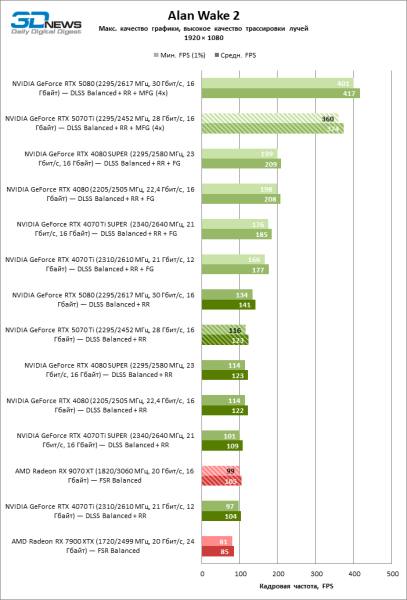
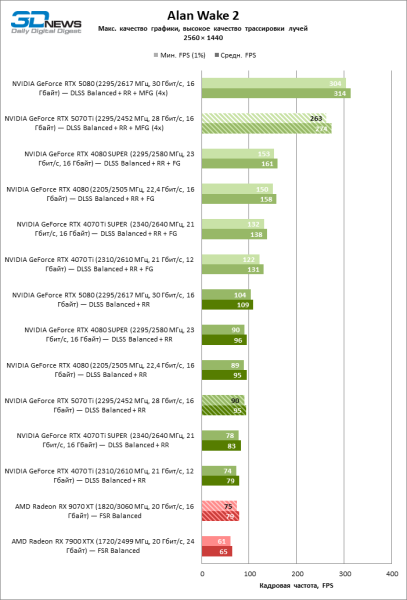
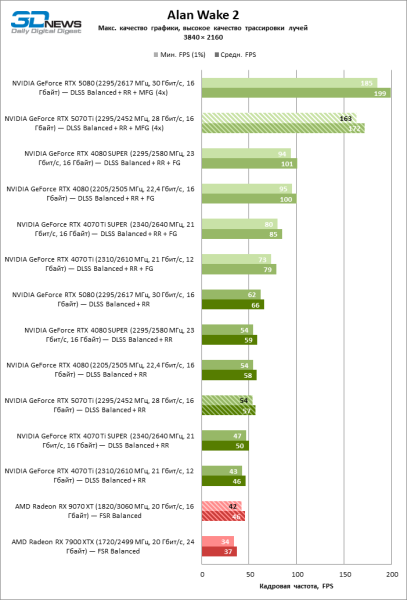
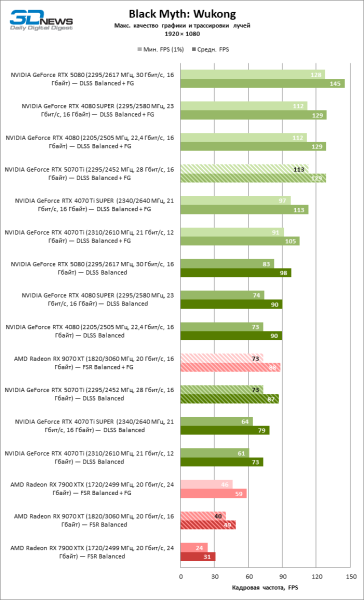
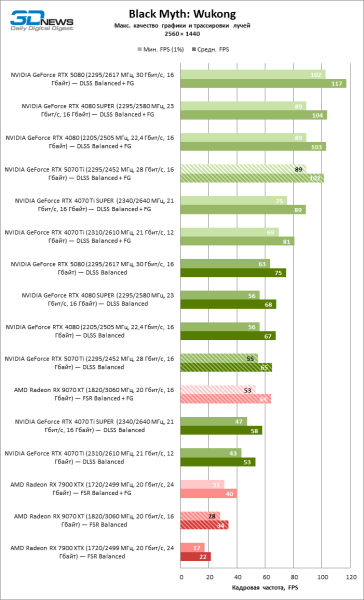
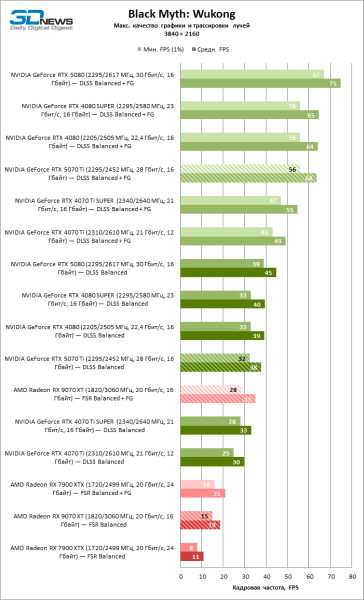
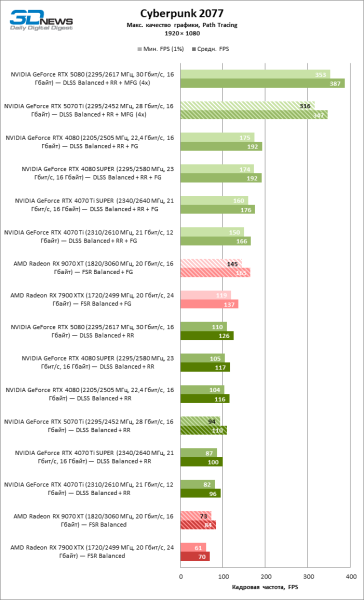
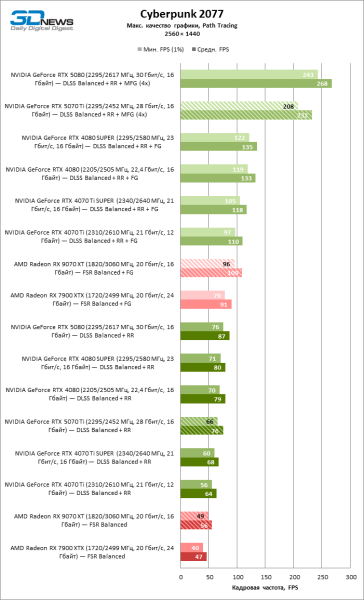
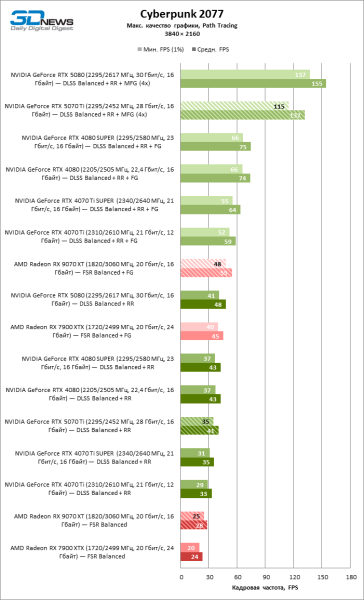
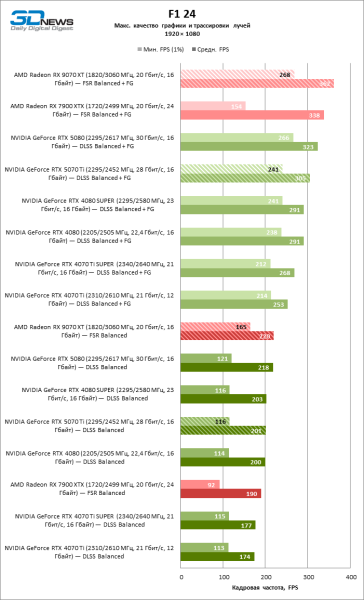
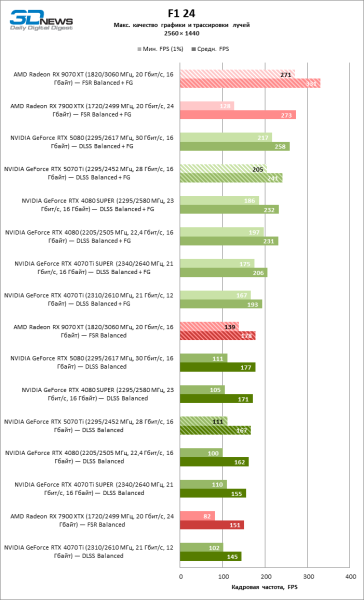
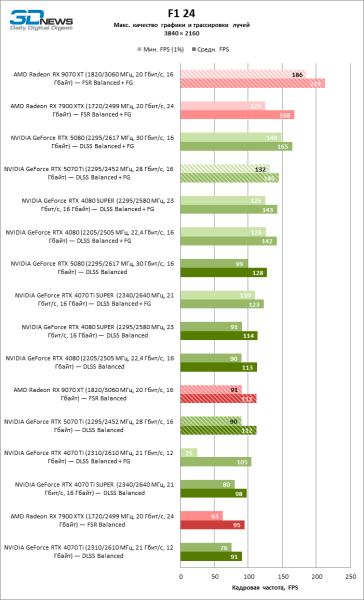
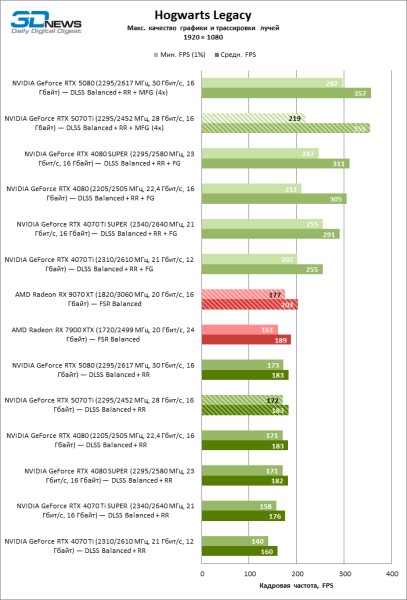
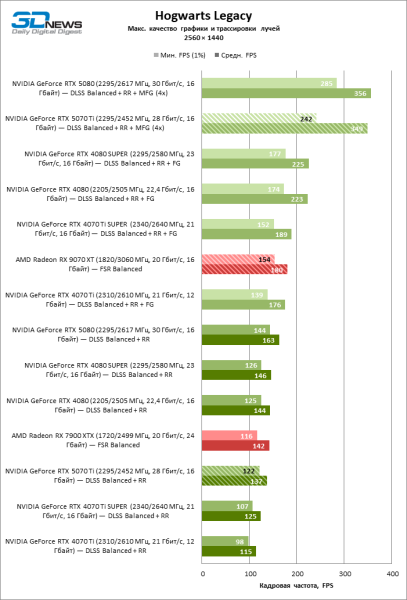
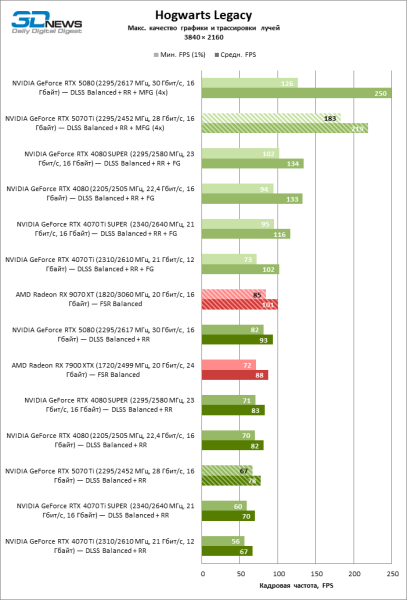
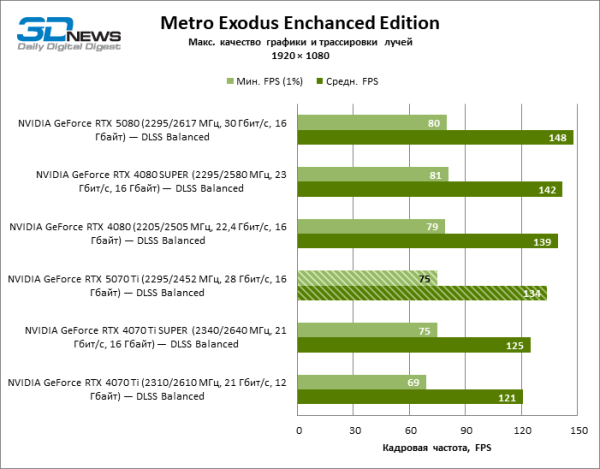
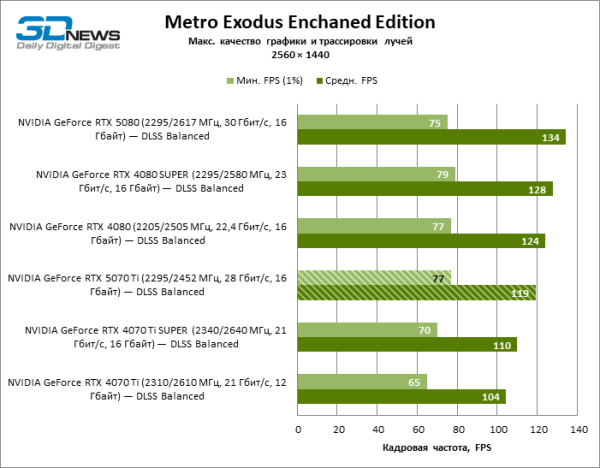
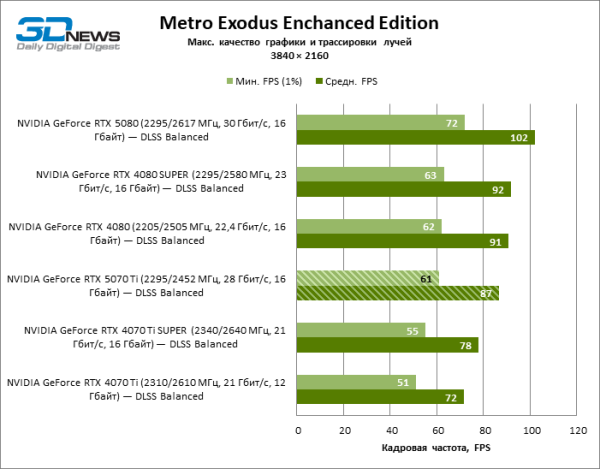
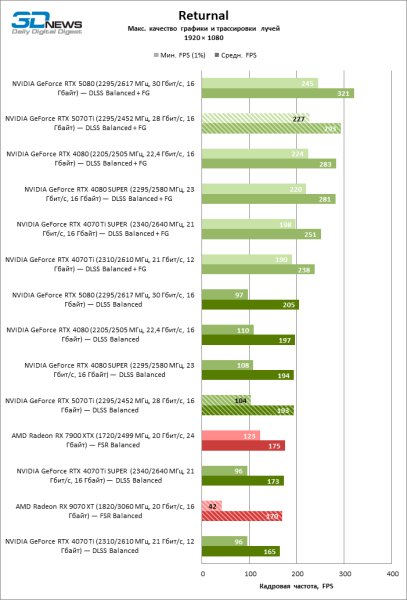
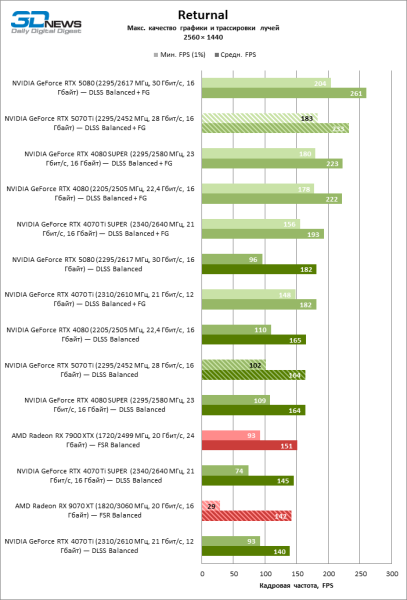
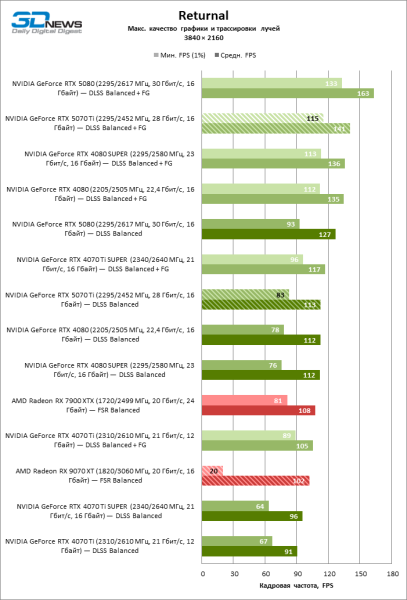
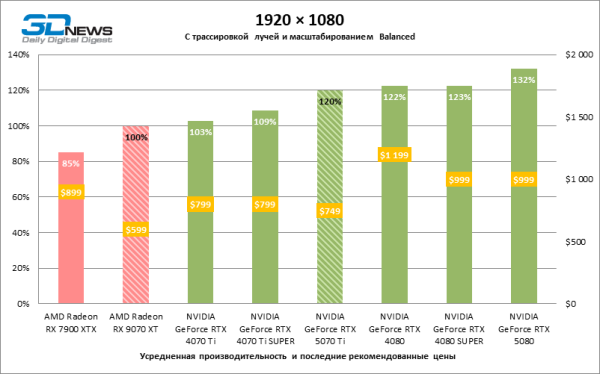
Thanks to balanced upscale scaling, next-generation devices from AMD and NVIDIA ensure a comfortable frame rate in 'hybrid' games at resolutions up to 4K. However, due to a 20–26% advantage, the GeForce RTX 5070 Ti handles fully ray-traced titles much better.
| 1920 × 1080 | ||||||||
|---|---|---|---|---|---|---|---|---|
| AMD Radeon RX 9070 XT | AMD Radeon RX 7900 XTX | NVIDIA GeForce RTX 4070 Ti | NVIDIA GeForce RTX 4070 Ti SUPER | NVIDIA GeForce RTX 4080 | NVIDIA GeForce RTX 4080 SUPER | NVIDIA GeForce RTX 5070 Ti | NVIDIA GeForce RTX 5080 | |
| Alan Wake 2 | 99 / 105 | 81 / 85 | 97 / 104 | 101 / 109 | 114 / 122 | 114 / 123 | 116 / 123 | 134 / 141 |
| Black Myth: Wukong | 40 / 49 | 24 / 31 | 61 / 73 | 64 / 79 | 73 / 90 | 74 / 90 | 73 / 87 | 83 / 98 |
| Cyberpunk 2077 | 73 / 84 | 61 / 70 | 82 / 96 | 87 / 100 | 104 / 116 | 105 / 117 | 94 / 110 | 110 / 126 |
| F1 24 | 165 / 220 | 92 / 190 | 113 / 174 | 115 / 177 | 114 / 200 | 116 / 203 | 116 / 201 | 121 / 218 |
| Hogwarts Legacy | 177 / 203 | 161 / 189 | 140 / 160 | 158 / 176 | 171 / 183 | 171 / 182 | 172 / 183 | 173 / 183 |
| Indiana Jones and the Great Circle | N/A | 27 / 29 | N/A | 55 / 59 | 62 / 67 | 65 / 68 | 62 / 65 | 73 / 75 |
| Metro Exodus Enhanced Edition | N/A | N/A | 69 / 121 | 75 / 125 | 79 / 139 | 81 / 142 | 75 / 134 | 80 / 148 |
| Returnal | 42 / 170 | 123 / 175 | 96 / 165 | 96 / 173 | 110 / 197 | 108 / 194 | 104 / 193 | 97 / 205 |
| Max. | +3% | +49% | +61% | +84% | +84% | +78% | +100% | |
| Avg. | −15% | +3% | +9% | +22% | +23% | +20% | +32% | |
| Min. | −37% | −21% | −20% | −10% | −10% | −10% | −10% | |
| 2560 × 1440 | ||||||||
|---|---|---|---|---|---|---|---|---|
| AMD Radeon RX 9070 XT | AMD Radeon RX 7900 XTX | NVIDIA GeForce RTX 4070 Ti | NVIDIA GeForce RTX 4070 Ti SUPER | NVIDIA GeForce RTX 4080 | NVIDIA GeForce RTX 4080 SUPER | NVIDIA GeForce RTX 5070 Ti | NVIDIA GeForce RTX 5080 | |
| Alan Wake 2 | 75 / 79 | 61 / 65 | 74 / 79 | 78 / 83 | 89 / 95 | 90 / 96 | 90 / 95 | 104 / 109 |
| Black Myth: Wukong | 28 / 34 | 17 / 22 | 43 / 53 | 47 / 58 | 56 / 67 | 56 / 68 | 55 / 65 | 63 / 75 |
| Cyberpunk 2077 | 49 / 56 | 40 / 47 | 56 / 64 | 60 / 68 | 70 / 79 | 71 / 80 | 66 / 76 | 76 / 87 |
| F1 24 | 139 / 178 | 82 / 151 | 102 / 145 | 110 / 155 | 100 / 162 | 105 / 171 | 111 / 167 | 111 / 177 |
| Hogwarts Legacy | 154 / 180 | 116 / 142 | 98 / 115 | 107 / 125 | 125 / 144 | 126 / 146 | 122 / 137 | 144 / 163 |
| Indiana Jones and the Great Circle | N/A | 19 / 22 | N/A | 45 / 48 | 54 / 56 | 53 / 56 | 49 / 51 | 58 / 60 |
| Metro Exodus Enhanced Edition | N/A | N/A | 65 / 104 | 70 / 110 | 77 / 124 | 79 / 128 | 77 / 119 | 75 / 134 |
| Returnal | 29 / 142 | 93 / 151 | 93 / 140 | 74 / 145 | 110 / 165 | 109 / 164 | 102 / 164 | 96 / 182 |
| Max. | +6% | +56% | +71% | +97% | +100% | +91% | +121% | |
| Avg. | −17% | +2% | +9% | +24% | +26% | +22% | +39% | |
| Min. | −35% | −36% | −31% | −20% | −19% | −24% | −9% | |
| 3840 × 2160 | ||||||||
|---|---|---|---|---|---|---|---|---|
| AMD Radeon RX 9070 XT | AMD Radeon RX 7900 XTX | NVIDIA GeForce RTX 4070 Ti | NVIDIA GeForce RTX 4070 Ti SUPER | NVIDIA GeForce RTX 4080 | NVIDIA GeForce RTX 4080 SUPER | NVIDIA GeForce RTX 5070 Ti | NVIDIA GeForce RTX 5080 | |
| Alan Wake 2 | 42 / 46 | 34 / 37 | 43 / 46 | 47 / 50 | 54 / 58 | 54 / 59 | 54 / 57 | 62 / 66 |
| Black Myth: Wukong | 15 / 19 | 8 / 11 | 25 / 30 | 28 / 33 | 33 / 39 | 33 / 40 | 32 / 38 | 39 / 45 |
| Cyberpunk 2077 | 25 / 28 | 20 / 24 | 29 / 33 | 31 / 35 | 37 / 43 | 37 / 43 | 35 / 41 | 41 / 48 |
| F1 24 | 91 / 112 | 63 / 95 | 76 / 91 | 80 / 98 | 90 / 113 | 91 / 114 | 90 / 112 | 99 / 128 |
| Hogwarts Legacy | 85 / 101 | 72 / 88 | 56 / 67 | 60 / 70 | 70 / 82 | 71 / 83 | 67 / 78 | 82 / 93 |
| Indiana Jones and the Great Circle | N/A | 12 / 13 | N/A | N/A | N/A | N/A | N/A | N/A |
| Metro Exodus Enhanced Edition | N/A | N/A | 51 / 72 | 55 / 78 | 62 / 91 | 63 / 92 | 61 / 87 | 72 / 102 |
| Returnal | 20 / 102 | 81 / 108 | 67 / 91 | 64 / 96 | 78 / 112 | 76 / 112 | 83 / 113 | 93 / 127 |
| Max. | +6% | +58% | +74% | +105% | +111% | +100% | +137% | |
| Avg. | −16% | +2% | +10% | +29% | +31% | +26% | +47% | |
| Min. | −42% | −34% | −31% | −19% | −18% | −23% | −8% | |
Compared to the Radeon RX 7900 XTX, the upgraded architecture of AMD's chips has provided the Radeon RX 9070 XT with a performance increase of 18–20% FPS. The GeForce RTX 5070 Ti, on the other hand, lags behind the GeForce RTX 4080 and RTX 4080 SUPER by up to 4% FPS but surpasses the GeForce RTX 4070 Ti SUPER by 10–14%.
Gaming tests on overclocking
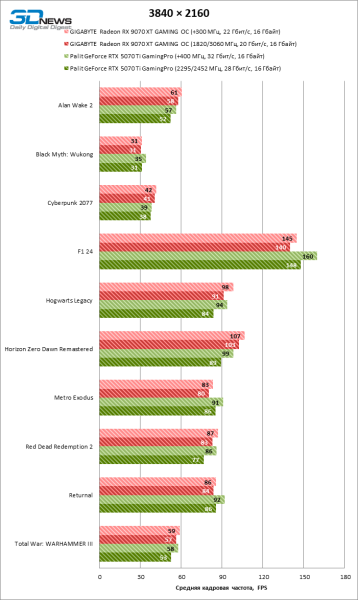
As expected, given the minimal increase in GPU clock speeds, overclocking the Radeon RX 9070 TX (at least in the GIGABYTE GAMING OC version) is practically a futile endeavor, yielding just a 4% frame rate boost. The Palit GeForce RTX 5070 Ti GamingPro, in contrast, became 9% faster as a result of overclocking.
Tests in productivity applications
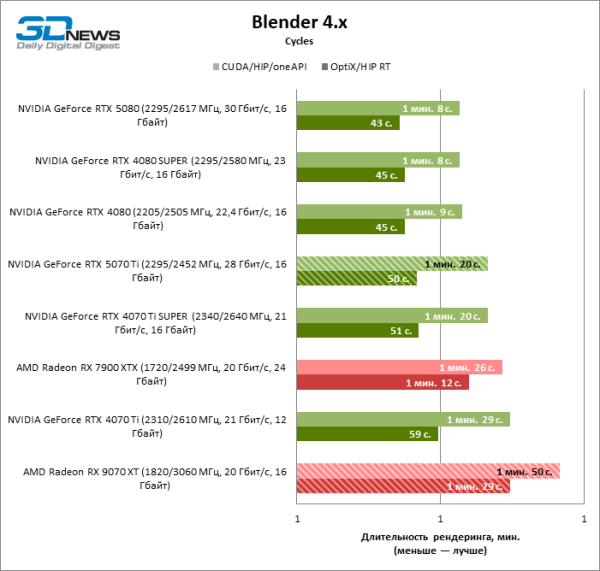
In the Blender benchmark, the new AMD graphics card managed to gain significantly more advantage from hardware-accelerated ray tracing than the Radeon RX 7900 XT. Nevertheless, the old flagship completed rendering faster due to an edge in raw performance. Consequently, there's no question of equal competition between the Radeon RX 9070 XT and the GeForce RTX 5070 Ti. The GeForce RTX 5070 Ti itself took an intermediate position between the RTX 4070 Ti SUPER and the RTX 4080.
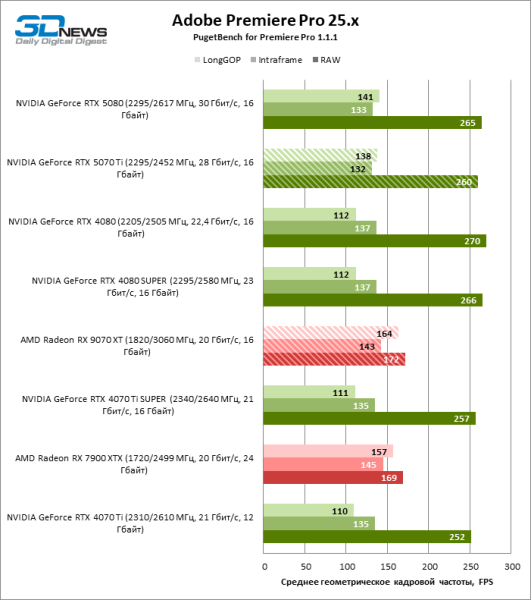
In transcoding tasks using Premiere Pro, the 'red' next-generation accelerator is on par with the Radeon RX 7900 XTX, but lags behind the 'green' competitors in overall assessment due to comparatively lower performance with RAW files. The GeForce RTX 5070 Ti, like the RTX 5080, features an updated H.264 and HEVC decoder and thus confidently outperforms 40-series graphics cards.
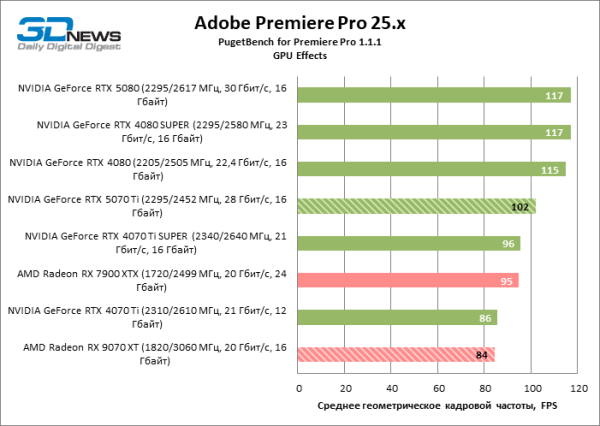
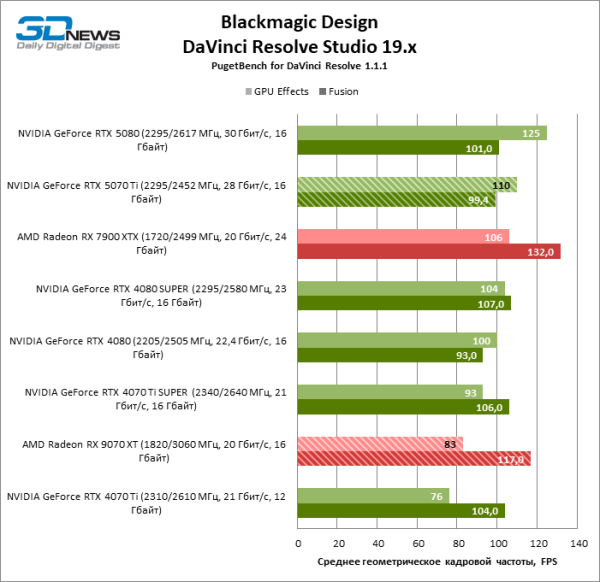
The Radeon RX 9070 XT came in last place on the GPU effects rendering speed chart, while the GeForce RTX 5070 Ti follows behind the RTX 5080 and two versions of the RTX 4080 in this test.
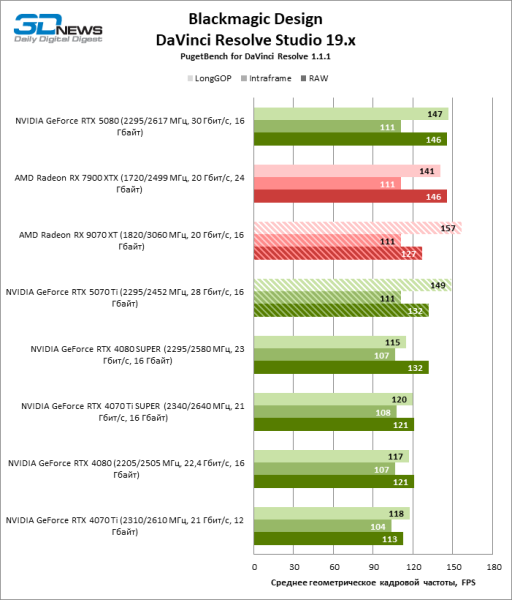
Transcoding tests in DaVinci Resolve placed the Radeon RX 9070 XT on the same level as the Radeon RX 7900 XTX, just behind the GeForce RTX 5080. The GeForce RTX 5070 Ti surpasses all previous NVIDIA solutions and follows the Radeon RX 9070 XT.
In the benchmark for GPU effects rendering, the Radeon RX 9070 XT again sank to the bottom of the chart. The GeForce RTX 5070 Ti, on the other hand, outperforms even the Radeon RX 7900 XTX and only falls short of the GeForce RTX 5080.
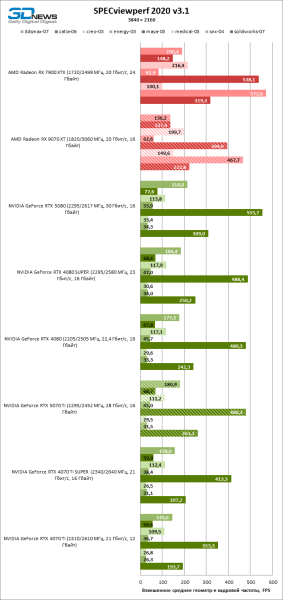
The GeForce RTX 5070 Ti is poorly suited for use in a number of CAD applications due to the lack of necessary driver optimizations. Here, the Radeon RX 9070 XT takes the advantage.
Video encoding/decoding
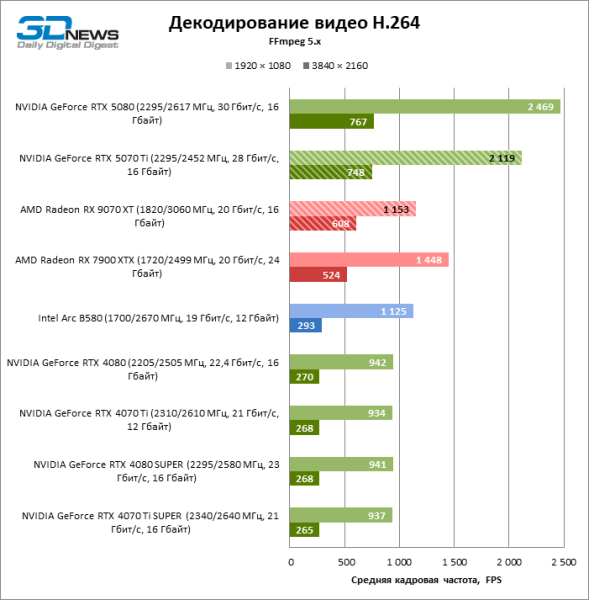
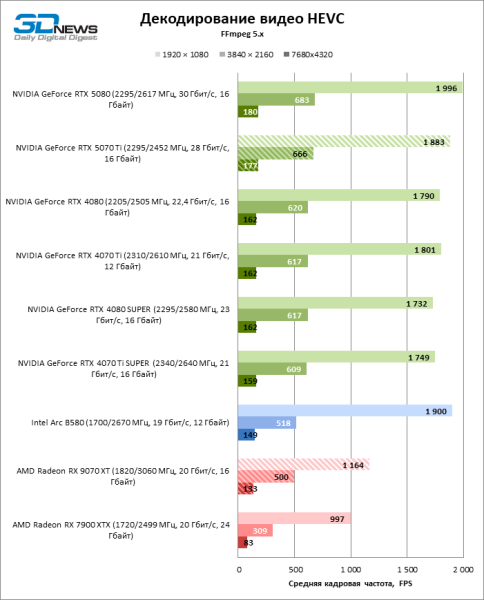
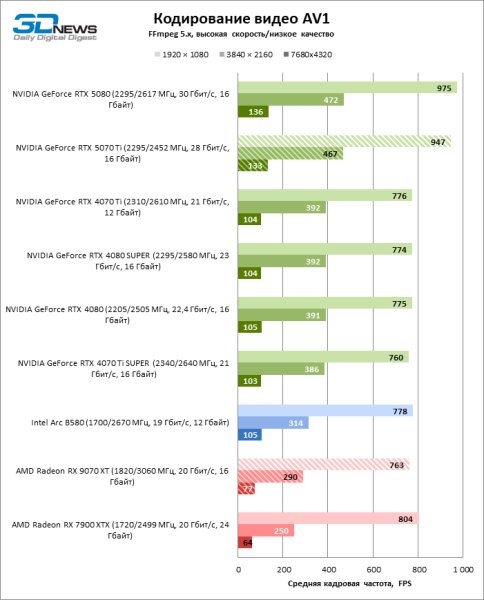
The hardware decoder on the Navi 48 chip has seen a notable increase in performance with AV1, while 'green' GPUs still handle other video formats significantly faster.
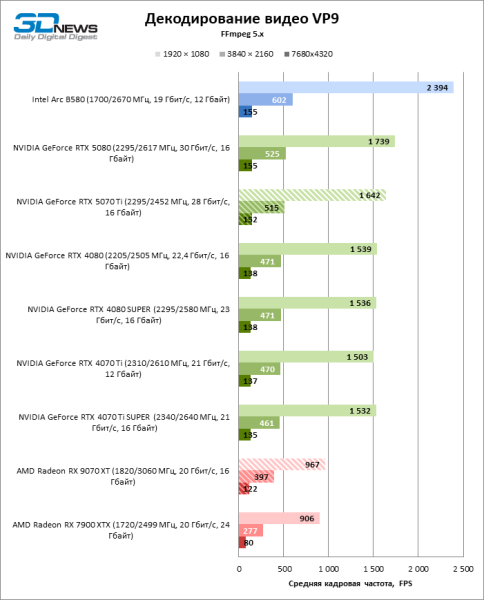
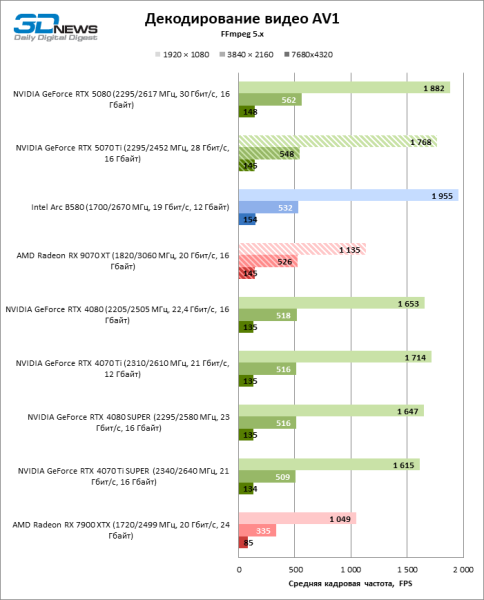
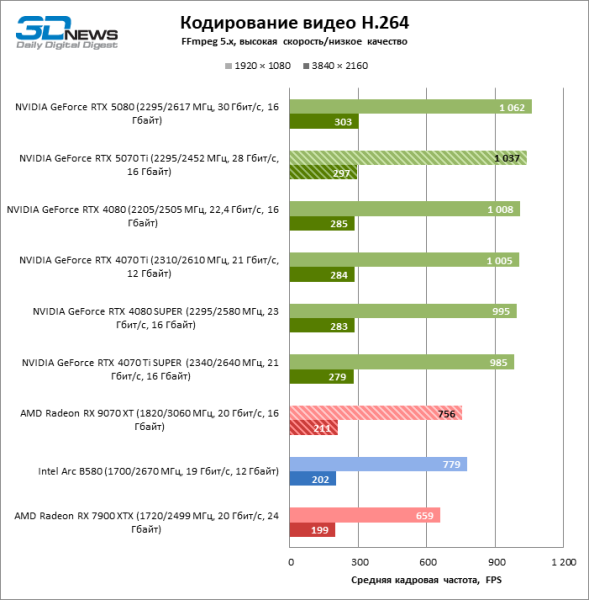
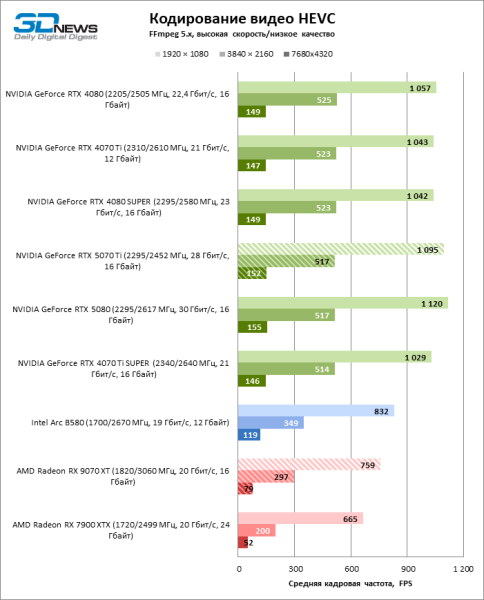
Coincidentally, the video encoder has also gained speed and can now compete with Intel's QuickSync, although it still lags behind the 'green' NVENC.
Performance per watt
Since our samples of the Radeon RX 9070 XT and Radeon RX 7900 XTX have nearly identical power reserves, the difference in energy efficiency between them is entirely determined by gaming performance. The older flagship leads with a 5% FPS advantage in rasterization, but in ray traced games, the Radeon RX 9070 XT made a 20% jump.
| Manufacturer | AMD | NVIDIA | ||||||
|---|---|---|---|---|---|---|---|---|
| Model | Radeon RX 9070 XT | Radeon RX 7900 XTX | GeForce RTX 4070 Ti | GeForce RTX 4070 Ti SUPER | GeForce RTX 4080 | GeForce RTX 4080 SUPER | GeForce RTX 5070 Ti | GeForce RTX 5080 |
| Graphics Processor | Navi 48 XTX | Navi 31 XTX | AD104 | AD103 | AD103 | AD103 | GB203 | GB203 |
| Microarchitecture | RDNA 4 | RDNA 3 | Ada Lovelace | Ada Lovelace | Ada Lovelace | Ada Lovelace | Blackwell | Blackwell |
| Process Technology, nm | TSMC N4C | TSMC N5/N6 | TSMC 4N | TSMC 4N | TSMC 4N | TSMC 4N | TSMC 4NP | TSMC 4NP |
| Average power consumption (FurMark), W | 373 | 372 | 285 | 285 | 332 | 317 | 318 | 397 |
| Performance/Watt (without ray tracing) | 100% | +5% | −2% | +6% | +8% | +14% | +13% | +5% |
| Performance/Watt (with ray tracing) | 100% | −17% | +15% | +44% | +50% | +59% | +55% | +48% |
In turn, the GeForce RTX 5070 Ti is comparable to the GeForce RTX 4080 SUPER here, but this graphics card has a lower TBP compared to the Radeon RX 9070 XT and outperforms the 'red' competitor in ray tracing. As a result, the energy efficiency of the GeForce RTX 5070 Ti is higher by 13 or 55% depending on the rendering method.
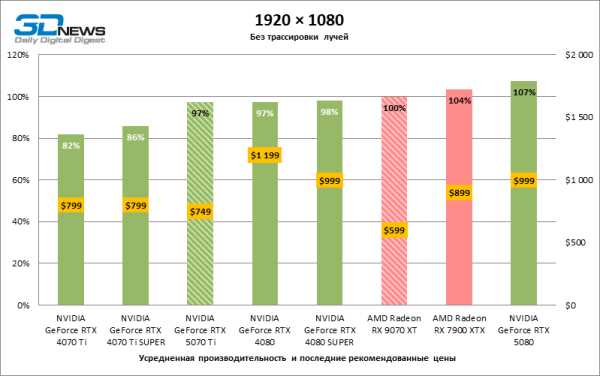
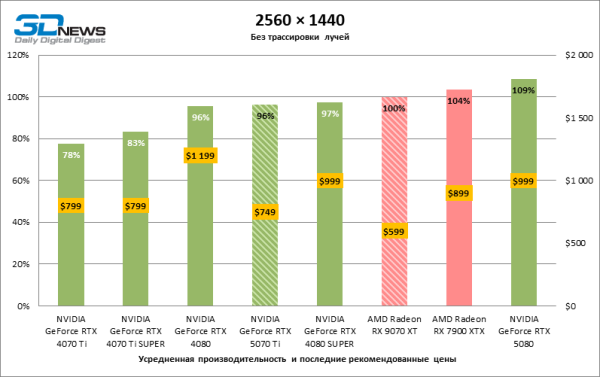
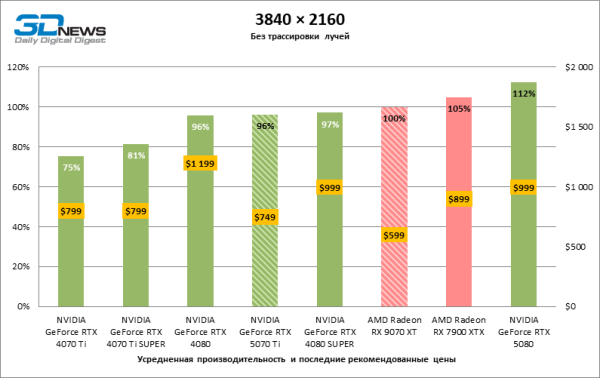
Summary results of gaming tests without ray tracing
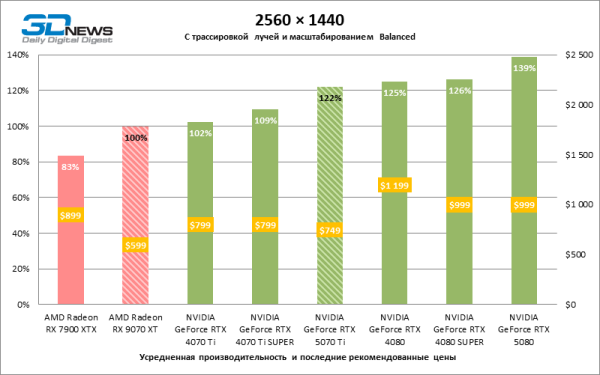
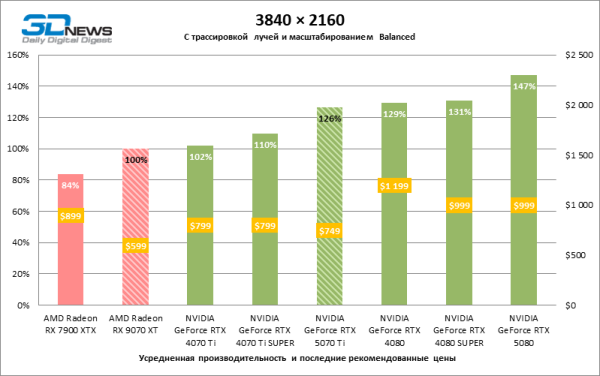
Summary of gaming benchmark results with ray tracing
Summary of gaming benchmark results with ray tracing and frame scaling
Conclusions
Among the two competing devices — the Radeon RX 9070 XT and the GeForce RTX 5070 Ti — it's easiest to describe the latter. The graphics card is a variant of the GeForce RTX 5080, cut down just enough to create an equivalent of the GeForce RTX 4080 or RTX 4080 SUPER, but with a lower suggested retail price. This would be forgivable in itself, were it not for the fact that the GeForce RTX 5070 Ti barely surpasses the RTX 4070 Ti SUPER by 19% FPS under the most favorable conditions, while officially costing only $50 less, not to mention actual prices.
The Radeon RX 9070 XT takes the place of the Radeon RX 7900 XTX in rasterized games, despite a significant lag in raw computing power, primarily due to improved architecture that has pushed it ahead by 21% FPS in ray tracing. It's nice to see that at least AMD's mid-range GPU has caught up and surpassed the old high-end GPU. However, even this improvement was not enough to end the long-standing lag behind NVIDIA. The Radeon RX 9070 XT achieved a symbolic victory over the GeForce RTX 5070 Ti in rasterization, but in ray tracing games, the average advantage of the GeForce RTX 5070 Ti reaches 32%, and even more in fully ray-traced scenarios. The suggested retail price of the Radeon RX 9070 XT is proportionally lower than that of the RTX 5070 Ti, which balances out the weaknesses of the RDNA 4 logic. However, in Russia, the minimum prices of the competitors are nearly equal, so despite NVIDIA's stagnation and AMD's progress, the choice between the Radeon RX 9070 XT and the GeForce RTX 5070 Ti is simple — at least for now.
Among the gaming features of the new GPUs, upscaling stands out first — DLSS or FSR version four. NVIDIA chips have gained the capability of generating multiple frames and transformer models, while AMD has started to use neural networks for this purpose. However, the FSR 4 technology, like DLSS, is tied to the 'native' hardware, so the frame scaling methods available to the owners of 'green' and 'red' accelerators have diverged, and it can no longer be said that GeForce graphics cards support both DLSS and FSR, while Radeon supports only FSR. We will address the topic of upscaling quality and its associated latency separately in an upcoming study.
The Radeon RX 9070 XT, like the GeForce RTX 5070 Ti, comes with 16 GB of video memory. This means that in the current generation, only the GeForce RTX 5090 offers more; other models risk facing situations where the GPU could handle the maximum graphics quality in a game (even through upscaling), but its VRAM capacity limits it. Currently, there is only one such game—Indiana Jones and the Great Circle—but this is just the first warning.
The Radeon RX 9070 XT is purely a gaming product, poorly suited for most work applications we tested (excluding CAD). The GeForce RTX 5070 Ti, on the other hand, performed excellently in video processing tasks thanks to the updated hardware codec, but is unlikely to attract professionals due to its local memory shortage.
Finally, let's say a few words about the graphics cards representing the Radeon RX 9070 XT and GeForce RTX 5070 Ti in this review—these are currently the most affordable versions of both models on the Russian market. The 'red' accelerator from GIGABYTE and the 'green' one from Palit have higher power consumption than stated by reference specifications (the Radeon even exceeds 360 W) and operate quite quietly if the corresponding BIOS is active. Palit GeForce RTX 5070 Ti GamingPro overclocks much better, although it does not allow an increase in TBP, while GIGABYTE Radeon RX 9070 XT GAMING OC surprisingly disappointed with VRAM temperatures exceeding 90 °C and liquid thermal pads that complicate the maintenance of the graphics card.
Source: 3dnews.ru
