

A new release of the Python library plotly.py 5.0 is now available, providing tools for data visualization and various types of statistics. It uses the plotly.js library for rendering, which supports over 30 types of 2D and 3D graphs, charts, and maps (output can be saved as an image or HTML file for interactive display in a browser). The plotly.py code is distributed under the MIT license.
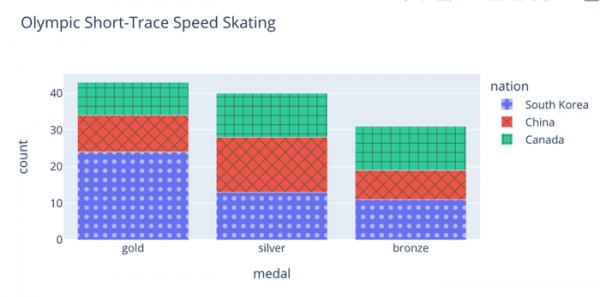
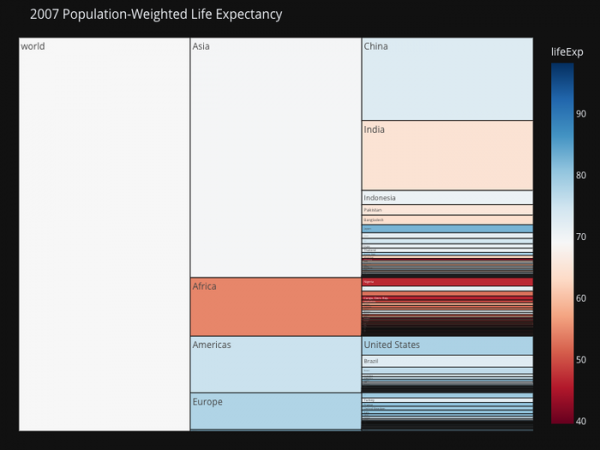
In this new release, support for Python 2.7 and Python 3.5 has been discontinued; a minimum of Python 3.6 is now required. There are breaking compatibility changes, including the removal of a large portion of deprecated features, changes in default values, and the discontinuation of support for Internet Explorer 9/10 browsers. The Plotly.js library has been updated from version 1.58.4 to 2.1. A new plugin for integration with JupyterLab has been implemented. Performance has increased 5-10 times when serializing data in JSON format. The ability to fill bar charts with textures has been added, along with a new chart type — 'icicle', a rectangular analog to pie charts for visually assessing size differences.
Source: opennet.ru
