

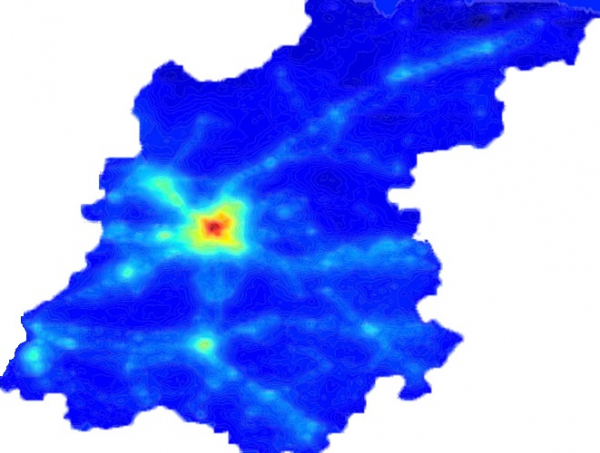
In the first publication () we discussed how heat potentials can be utilized for area analysis in general. In the following publications, we planned to describe how spatial object information is stored in databases, how models are built from principal components, and what area analysis tasks may arise. But, we will cover everything in order.
The use of the heat potential method primarily provides an overall view of the area of interest. For example, taking initial data from OSM for the city of Barcelona (Catalonia), and conducting an integral analysis without selecting parameters, we can obtain 'thermal' images of the first principal components. We also mentioned 'thermal' maps in the first article, but it’s worth reminding that the term 'thermal' map originated from the physical sense of potentials used for integral analysis. That is, in physics problems, potential represents temperature, while in area analysis problems, potential represents the combined influence of all factors on a specific point in the area.
Below is an example of a 'thermal' map of Barcelona obtained as a result of integral analysis.
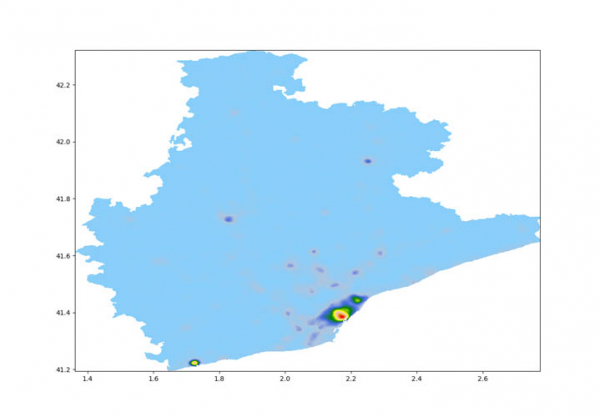
'Thermal' map of the first principal component, without parameter selection, Barcelona
And by setting a specific parameter (in this case, we chose industry), it is possible to obtain a 'thermal' map directly based on it.
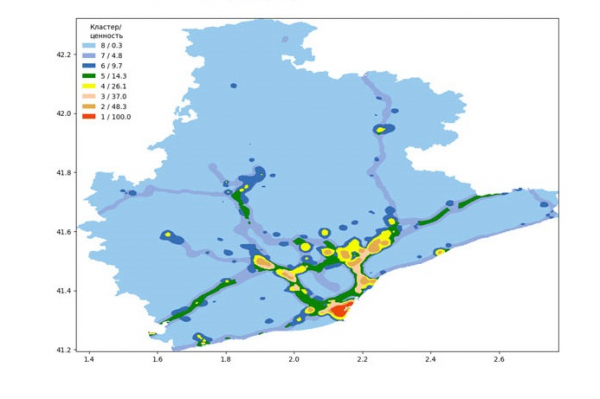
'Thermal' map of the first principal component, industry, Barcelona
Of course, the tasks of analysis are much broader and more diverse than just obtaining an overall assessment of the chosen area, so as an example, in this article we will consider the task of finding the best location for establishing a new object and the technical implementation of the heat potential method to solve it, while in subsequent publications we will look at others.
Solving the problem of finding the best location for placing a new object will help determine how ready the area is to receive this new object, how it will correlate with other existing objects in the area, how valuable this new object will be for the area, and what value it will add.
Stages of Technical Implementation
Technical implementation can be represented as a sequence of procedures outlined below:
- Preparation of the Information Environment.
- Searching, gathering, and processing initial information.
- Building a network of nodes in the analyzed area.
- Fragmenting the territory factors.
- Calculating potentials from the factors.
- Selecting factors to create thematic integral characteristics of the territory.
- Applying the principal component method to obtain integral indicators of the territory.
- Creating models for selecting a site for the construction of the new object.
Stage 1. Preparation of the Information Environment
At this stage, it is necessary to choose a Database Management System (DBMS), define information sources, methods of information collection, and the volume of information to be gathered.
For our work, we used the PostgreSQL database, but it's worth noting that any other database capable of handling SQL queries would suffice.
The database will store the initial information – spatial data about the objects: data types (points, lines, polygons), their coordinates, and other characteristics (length, area, quantity), as well as all calculated values obtained from the work performed and the results themselves.
Statistical information is also presented as spatial data (for example, regions of the area with statistical data assigned to these regions).
As a result of transforming and processing the collected initial information, tables are formed that contain information about linear, point, and area factors, their identifiers, and coordinates.
Stage 2. Searching, Gathering, and Processing Initial Information
For this task, we will use information from open cartographic sources that contain data about the territory. In our opinion, OSM information, updated daily worldwide, is the leader. However, if it's possible to gather information from other sources, it wouldn't hurt.
Information processing involves standardizing it, excluding unreliable data, and preparing it for loading into the database.
Step 3. Building a node grid for the analyzed territory
To ensure continuity in the analyzed territory, a grid must be constructed that has nodes with coordinates in the specified coordinate system. The potential value will subsequently be determined at each node of the grid. This will allow for visualizing homogeneous areas, clusters, and the final analysis results.
Depending on the tasks to be solved, there are two options for building the grid:
— Regular step grid (S1) – provides an overview of the entire territory. Potential calculations from factors are made on it, integral characteristics of the territory are determined (principal components and clusters), and modeling results are output.
When choosing this grid, it is necessary to specify:
- grid step – the interval at which nodes will be placed;
- the boundary of the analyzed territory, which may correspond to administrative-territorial divisions, or it may be an area on the map that limits the calculation territory in the form of a polygon.
— Irregular step grid (S2) describes specific points of the territory (e.g., centroids). Potential calculations from factors are also made on it, integral characteristics of the territory are determined (principal components and clusters). Modeling with calculated principal components is performed specifically on the irregular step grid, and for visualizing modeling results, cluster numbers from the irregular step grid nodes are transferred to the regular step grid nodes based on coordinate proximity.
In the database, information about the coordinates of the grid nodes is stored in a table, containing the following information for each node:
- node identifier;
- node coordinates (x, y).
Examples of grids with regular steps across different areas with varying increments are shown in the figures below.

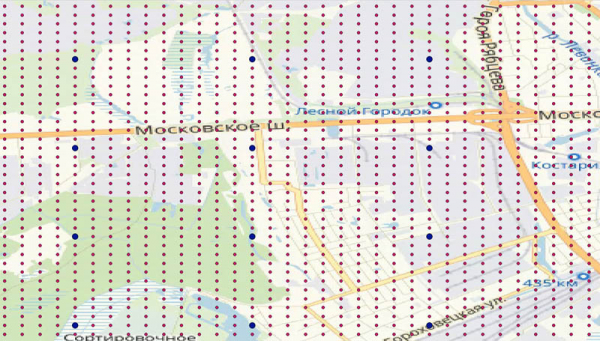
Coverage grid for Nizhny Novgorod (red dots). Coverage grid for the Nizhny Novgorod region (blue dots).
Step 4. Fragmentation of area factors
For further analysis, extensive area factors need to be converted into an array of discrete factors so that each node of the grid contains information about each factor present in it. Linear factors are divided into segments, while area factors are divided into fragments.
The fragmentation step is selected based on the area of the territory and the specificity of the factor. For larger areas (regions), the fragmentation step may be 100-150 meters; for smaller territories (cities), the fragmentation step may be 25-50 meters.
In the database, information about fragmentation results is stored in a table that contains the following information for each fragment:
- factor identifier;
- coordinates of the centroids of the obtained fragmentation segments (x, y);
- length/area of the fragmentation segments.
Step 5. Calculation of potentials from factors
One of the possible and straightforward approaches to analyzing the initial information is to consider factors as potentials from influencing objects.
We will use the fundamental solution of the Laplace equation for the two-dimensional case—the logarithm of the distance from a point.
Considering the requirement for a finite potential value at zero and the limitation of the potential value at large distances, the potential is defined as follows:
 for r<r1 (1)
 for r2>r>=r1
 for r>=r2
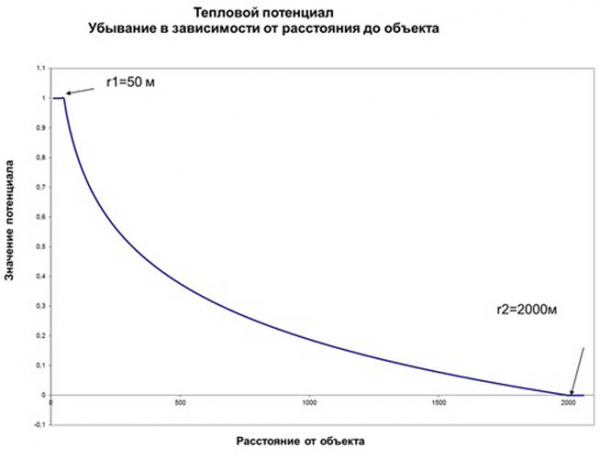
The form of potential influence from a point object
The logarithmic function must be limited at zero and reasonably constrained at some distance from the factors. If we do not impose limitations on potential at large distances from the factor, we would have to consider an enormous amount of information far from the analyzed point, which has virtually no impact on the analysis. Therefore, we introduce a factor's radius of influence beyond which the contribution to the potential from the factor is zero.
For the city, the factor's radius of influence is taken to be equal to a half-hour walking accessibility—2,000 meters. For the region, we should refer to a half-hour transport accessibility—20,000 meters.
Thus, as a result of calculating potential values, we have the cumulative potential from each factor at each node of the regular grid.
Stage 6. Selection of factors for creating thematic integral characteristics of the territory
At this stage, the most significant and informative factors are selected for creating thematic integral characteristics of the territory.
Factor selection can be conducted automatically by setting certain boundaries for parameters (correlation, percentage influence, etc.), or it can be done through expert judgment, knowing the thematic context of the task and having some understanding of the territory.
After the most significant and informative factors are selected, we can move on to the next stages — interpreting the principal components.
Stage 7. Applying the principal component method to obtain integral indicators of the territory. Clustering
The initial information about the territory factors, transformed in the previous stage into potentials calculated for each node of the grid, is combined into new integral indicators — principal components.
The principal component method analyzes the variability of factors in the studied territory and finds the most variable linear combination of them based on this analysis, allowing us to calculate the measure of their change — dispersion across the territory.
Let’s take the general task of approximating a linear model function to given values.
 (2)
(2)
Where i is the component number,
n is the number of components involved in the calculation
j is the index of the territory point node, j=1..k
k is the total number of nodes in the territory grid for which the principal component calculations were performed
 — the coefficient for the i-th principal component of the model
 – the value of the i-th principal component at the j-th point
B is the free term of the model
 — the potential at the j-th point of the factor for which we are constructing the model
Let’s determine the unknowns in the equation (2) using the least squares method, utilizing the properties of principal components:
 (3)
(3)
Where i and i2 are component numbers, ii2
j is the index of the territory node
k is the total number of nodes in the territory
 (4)
(4)
(3) indicates no correlation between components
(4) — the total value of any component equals zero.
We obtain:

 (5)
(5)
Here, the designations are the same as in the equation (2),  indicates the average value of the potential
This result can be interpreted as follows:
The model represents a simple expression consisting of the average value of the modeled quantity and simple adjustments to it for each of the components. At a minimum, the result should include a constant term B and the first main component. Below are examples of heat maps for the first main components in the Nizhny Novgorod region.
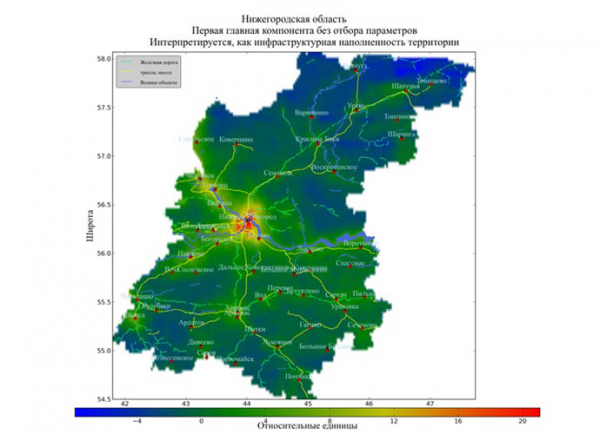
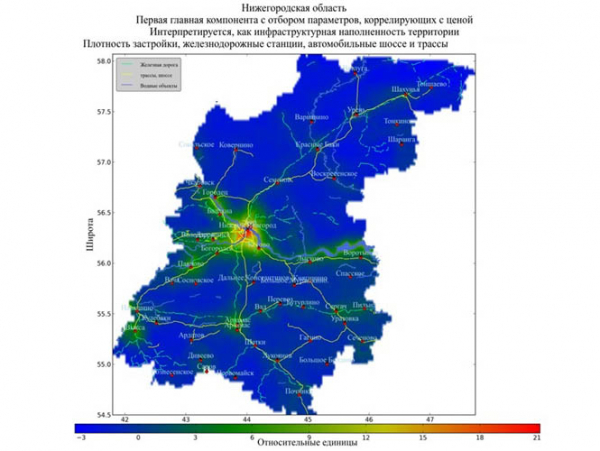
Based on the calculated main components, homogeneous areas can be constructed. This can be done for all parameters or, for example, only for pricing factors—i.e., clustering can be conducted. For this, one can use For each homogeneous area, the average value of the first main component, characterizing the development level of the territory, is calculated.
An example of clustering based on pricing parameters for the Nizhny Novgorod region is provided below.
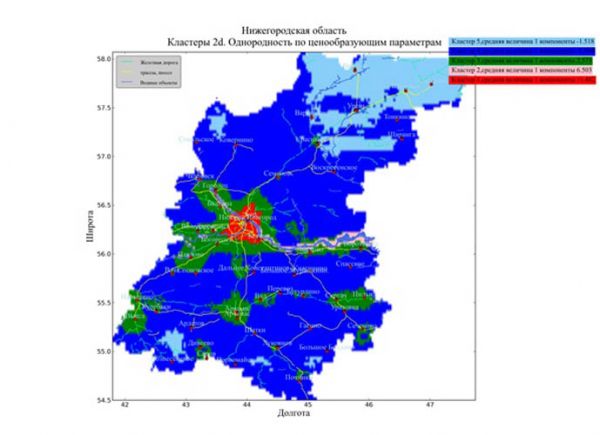
Also, by using the obtained main components as parameters for the cost model, we can derive the price surface of the territory.
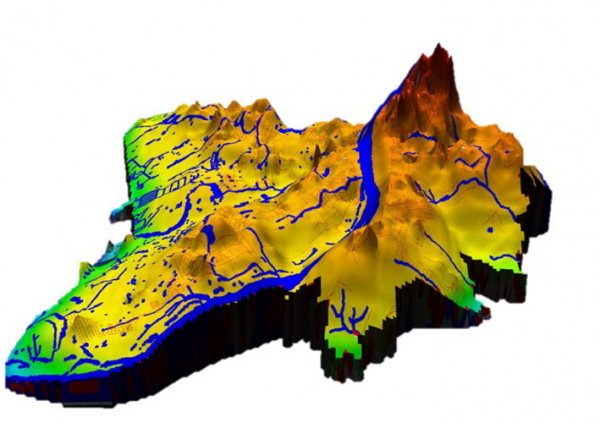
Price surface of Nizhny Novgorod
Stage 8: Creating models for selecting the location for the new facility
To choose the most attractive location for the new facility (hereinafter referred to as the 'facility'), one must compare the location of the 'facility' with the surrounding infrastructure. There must be sufficient resources for the operation of the 'facility,' and a wide range of factors, both positive and negative, affecting the 'facility' must be taken into account. All these factors can be defined as the 'nutritional' environment for the operation of the 'facility.' The correspondence between the number of facilities and the resources available in the area is the basis for the stable functioning of the 'facility.'
The result of this comparison is the potential calculated for each point in the territory, allowing for a visual and analytical analysis of the site selection for the placement of the new 'facility.'
For commerce, among other things, a steady flow of customers is essential. Therefore, the list of factors to consider for commercial establishments should include those that ensure this flow (such as social infrastructure establishments, workplaces, residential areas, transportation routes, etc.).
On the other hand, when fulfilling all conditions for the functioning of commercial establishments, the density of these establishments must be taken into account, as the "consumption" of the environment leads to a decrease in purchasing opportunities. The flow of people is not limitless, and the same applies to their financial resources and physical capabilities.
The algorithm for solving the problem of choosing the best location for a facility boils down to maximizing the potential obtained as a function of the main components, which closely approaches the potential of the aggregate of objects of type "object"; then the difference between the model's potential and the potential of objects of type "object" is calculated; from the resulting difference, the potential contribution of one "object" is subtracted; any negative values obtained are replaced with zero, thus filtering out those locations where resources are insufficient for the operation of a new "object."
As a result of the actions taken, we obtain territory points with a positive potential value, i.e., favorable locations for our "object."
In other words, we have the calculated potentials of all available factors and the factor by which we want to build a model and analyze the selected thematic area (commerce, industry, culture, social sphere, etc.).
For this, it is necessary to select factors for constructing environmental variables – the main components – and subsequently calculate models based on them.
Factors should be selected through correlation analysis of all factors with the reference factor of the thematic area. For example, for culture, this might include theaters, for education systems, schools, etc.
We calculate the correlation of the reference potential with the potentials of all factors. We select those factors whose correlation coefficients in absolute value exceed a certain magnitude (often the minimum correlation coefficient value = 0.3 is taken).
 (6)
(6)
where  The absolute value of the correlation coefficient of the i-th factor with the standard.
Correlation is calculated across all nodes of the grid covering the area.
The potential difference between the model and the potential of objects of the same type as the new object in the equation (2) shows the potential of the area that can be utilized for the placement of new objects.
As a result, we obtain a potential value that characterizes the degree of benefit of placing the 'object' in the studied area.
An example of how to graphically represent the recommended areas for the placement of the new 'object' is shown below.
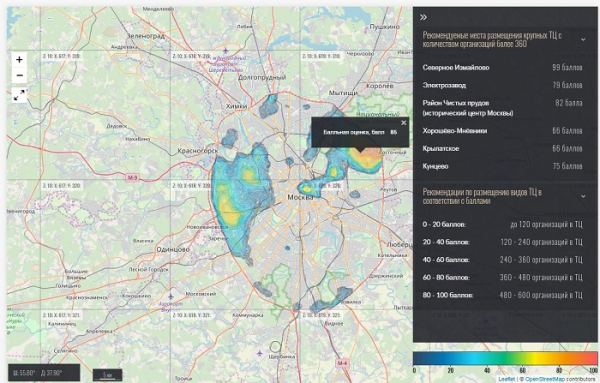
Thus, the result of solving the task of selecting the best location for the new object can be represented as a score for each point of the area, providing an understanding of the potential for placing the investment object; i.e., the higher the score, the more advantageous it is to place the object.
In conclusion, it is worth noting that in this article we examined only one task that can be solved through territory analysis, having data from open sources. In fact, the number of tasks that can be addressed with this is numerous; it is only limited by your imagination.
Source: habr.com
