

This adds to the topic of "Golden Ratio" in economics — what is it? raised in . Let's approach the problem of optimal resource allocation from an angle that hasn't been covered yet.
Let's take the simplest model of event generation: tossing a coin and the probability of getting "heads" or "tails". It postulates that:
Getting "heads" or "tails" on each individual toss is equally likely – 50/50%
In a large series of tosses, the number of occurrences of each side of the coin approaches the other’s count.
This means that by recording the results of previous heads and orienting towards the equilibrium of the series, one might expect the next outcome to be "heads" (and not "tails") with a greater or lesser probability, depending on the results of previous tosses. This aligns with the experience of anyone who has conducted such a series.
As statistics show (to avoid repetition, see the graph examples in ), in various economic systems — just like in coin tests — there is a certain law-like probabilistic distribution of expenditures. This empirical distribution of expenditures is extremely interesting to represent as a Lorenz curve (see the illustration below in "Company Expenditures"). With some minor approximation errors, this curve turns into a segment of a circle (the lower right quarter). Extensive statistical analysis of resource distribution indicates a high reproducibility of the circular arc across various fields of economics (again, see the previous publication). And the degree of closeness of the existing expenditure distribution to this benchmark allows us to assess the "health" of the economic system under review. Here, "health" refers to the system's survivability and its capacity for development.
Let's consider two segments of economic activity that are fundamentally similar, yet each has its specific characteristics.
Company Expenditures
The Russian program Leonarus v.1.02 implements the aforementioned approach (see assesses expenditures in terms of the sustainability of the economic entity as a whole system. It does this by evaluating the distribution of costs and ensures the best use of available resources, warning against sharp deviations from the system's optimum.
Expenditures that align with this pattern ensure maximum freedom for the existing system and its greatest resilience.
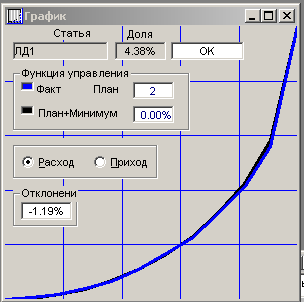
The program is quite accessible to users familiar with Excel and who have some experience in planning and business activities. It allows for evaluating the economic condition of an enterprise and making adjustments to the planned budget based on the current situation.
The relevance of assessing the current economic situation is increasing today, as the bankruptcy of legal entities is becoming more frequent.
In 2017, over 9,000 entrepreneurs ceased to exist. Statistics on small business bankruptcies indicate that approximately 30% closed due to insolvency.
Bankruptcy statistics for enterprises in 2017 also increased. In Russia, more than 13.5 thousand companies went bankrupt, with a growth of 7.7%. In the first quarter of 2018, 3.17 thousand enterprises were recognized as insolvent, with a growth of 5%.
The Leonarus v.1.02 program is beneficial because it allows for adjusting projected expenses, justifying the reduction/increase of costs based on the desired outcome: achieving planned profitability. Enterprises whose expense structures approach the preferred Lorenz curve with a degree indicator of two have the highest profitability (Bueva, T. M. (2002). Application of modified Lorenz curves in resource allocation tasks).
As a note: the program could be quite useful not only for businesses but also for households. For example, when stocking up a home, a few special delicacies may be purchased, simple cooking ingredients are acquired, grains, spices, and some household chemicals are picked up… This creates a picture that is likely to arise in most cases.
If your expenses are described by the preferred Lorenz curve, then your household's financial life is secure. Any expenses that fall within this curve—no matter how extravagant—will not blow your budget.
The program could help even an experienced homemaker in the event of a sudden budget cut. In normal operation, it is needed to check already planned expenses. It serves as insurance to avoid serious mistakes and accidental lapses in attention when allocating money.
Unfortunately, it must be acknowledged that in its current form the program is a prototype and practically inaccessible to unskilled users. A useful tool for household use is not yet adapted... Any advice and suggestions on 'landing' Leonarus v.1.02 are welcome.
Investment Project Analysis
This is a case of expert evaluation when it concerns not changing expenses, but clarifying project risks. This is done when, in addition to already used methods for evaluating the proposed investment, the expense structure is analyzed for its proximity to the benchmark Lorenz curve.
The existing experience is insufficient for definitive conclusions on this matter. However, based on theoretical premises and the site’s operational experience , one can suggest that the greater the deviation of the planned expenses from the benchmark arc to the left, the higher the danger of unforeseen developments due to some initial 'looseness' of plans. And the greater the deviation to the right, the higher the likelihood that the planner/project manager tends towards excessive regulation, and the project lacks sufficient adaptive potential to respond to the challenges it will inevitably face.
These assumptions are refined when considering average project expenses using quantum mechanics equations. But even without additional calculations, deviations from the benchmark curve can affect a well-founded investment decision. Either the project will be rejected due to increased risk, or the structure of the deal must account for the heightened risk of the project.
In conclusion
The simplest economic system is, in fact, a system with high uncertainty due to the variety of its components and the variable connections between them. The structure of estimated or current expenditures is not the only critical component of the system. However, it is one of those that can be regulated by managers. Regardless of the diverse conditions under which economic activities take place, it can be assumed that the optimal resource distribution (from the perspective of the survival and development of the economic entity) is described by the Lorenz curve. It can well be referred to as the 'golden section' in economics and serves as a valuable tool in economic planning and analysis.
"I have always found that plans are useless, but planning is indispensable."
D. Eisenhower, Supreme Commander of the Allied Forces in Europe (1944-1945)
For the sake of completeness:
Reference list cited by the authors http://www.leonarus.ruAntoniou, I., Ivanov, V. V., Korolev, Y. L., Kryanev, A. V., Matokhin, V. V., & Suchaneckia, Z. (2002). Analysis of resources distribution in economics based on entropy. Physica A, 304, 525-534.
Haritonov, V. V., Kryanev, A. V., & Matokhin, V. V. (2008). The adaptable potential of economic systems. International Journal of Nuclear Governance, Economy and Ecology, 2, 131-145.
Lorentz, M. O. (Jun 1905). Methods of Measuring the Concentration of Wealth. Publications of the American Statistical Association, 9(70), pp. 209-219.
Mintzberg, H. (1973). The Nature of Managerial Work. New-York: Harper & Row.
Prigogine, I. R. (1962). Non-equilibrium statistical mechanics. New York – London: Interscience Publishers a Division of John Wiley & Sons.
Rasche, R. H., Gaffney, J., Koo, A. Y., & Obst, N. (1980). Functional forms for estimating the Lorenz curve. Econometrica, 48, 1061–1062.
Robbins, L. (1969 [1935]). An Essay on the Nature and Significance of Economic Science (2nd edition ed.). London: Macmillan.
Alle, M. (1995). Economics as a Science. (Trans. I. A. E. from French by Yegorov) Moscow: RGGU.
Alle, M. (1998). The Equivalence Theorem.
Bueva, T. M. (2002). Application of Modified Lorenz Curves in Resource Distribution Tasks. Yoshkar-Ola.
Doroshchenko, M. E. (2000). Analysis of Non-Equilibrium States and Processes in Macroeconomic Models. Moscow: Economic Faculty of Lomonosov Moscow State University, TEIS.
Kotlyar, F. (1989). Foundations of Marketing. (Trans. from English) Moscow: Progress.
Kryanev, A. V., Matokhin, V. V., & Klimanov, S. G. (1998). Statistical Functions of Resource Distribution in Economics. Moscow: Preprint MIFI.
Prigogine, I. R. (1964). Non-Equilibrium Statistical Mechanics. (Trans. from English) Moscow: Mir.
Suvorov, A. V. (2014). Science of Victory. (M. Tereshina, Ed.) M: Eksmo.
Khelfert, E. (1996). Financial Analysis Techniques / Trans. from English. (L. P. Belykh, Trans.) M: Audit, UNITY.
Source: habr.com
