

The time required for reading is 11 minutes
Us and the Gartner Quadrant 2019 BI 🙂
The goal of this article is to compare three leading BI platforms that are leaders in the Gartner quadrant:
— Power BI (Microsoft)
— Tableau
— Qlik
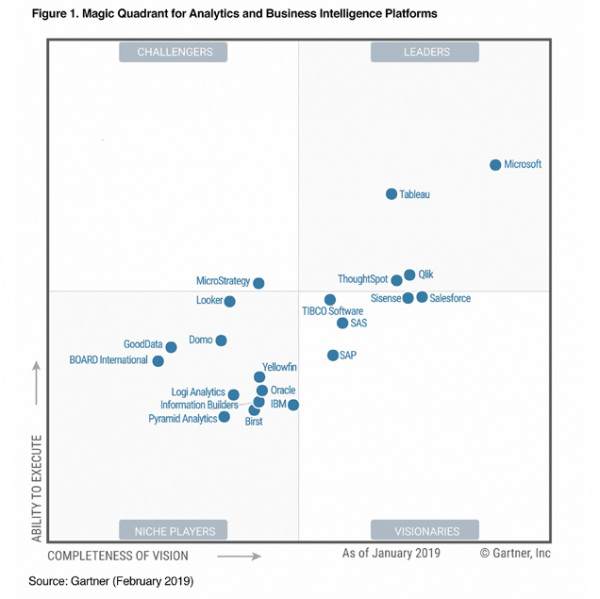
Figure 1. Gartner BI Magic Quadrant 2019
My name is Andrey Zhdanov, I am the head of the analytics department at Analytics Group (). We create visual reports on marketing, sales, finances, logistics, in other words, we deal with business analytics and data visualization.
My colleagues and I have been working with various BI platforms for several years now. We have quite a good experience in projects, which allows us to compare platforms from the perspective of developers, analysts, business users, and BI system implementers.
We will have a separate article comparing the prices and visual design of these BI systems, so here we will try to evaluate these systems specifically from the perspective of an analyst and developer.
Let's highlight several areas for analysis and evaluate them on a 3-point scale:
— The entry threshold and requirements for the analyst;
— Data sources;
— Data cleaning, ETL (Extract, Transform, Load)
— Visualizations and development
— Corporate environment — server, reports
— Support for mobile devices
— Embedded analytics in third-party applications/websites
1. The entry threshold and requirements for the analyst

Power BI
I have seen many Power BI users who were not IT specialists but could create a decent report. Power BI uses the same query language as Excel — Power Query and the DAX formula language. Many analysts are well-versed in Excel, so transitioning to this BI system is quite easy for them.
Most actions are not too difficult to perform in the query editor. Plus, there is an advanced editor with M language for professionals.
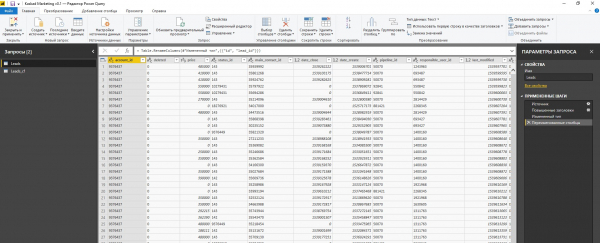
Figure 2. Power BI Query Builder
Qlik Sense
Qlik Sense looks very user-friendly — a small number of settings, quick ability to create a report, and a data loading builder can be used.
At first glance, it seems simpler than Power BI and Tableau. But from experience, I can say that after some time, when an analyst creates a couple of simple reports and needs something more complex, they will encounter the necessity of programming.
Qlik has a very powerful data loading and processing language. It has its own Set Analysis formula language. Therefore, an analyst must be able to write queries and joins, place data into virtual tables, and actively use variables. The capabilities of the language are quite broad, but it will require study. Probably all Qlik analysts I know have some serious IT background.
Qlik integrators, like us, often like to talk about the associative model, where upon loading data, everything is placed in memory, and the connection between data is managed by the platform's internal mechanism. This means that when selecting values, no internal subqueries are performed as in classical databases. Data is delivered almost instantaneously thanks to pre-indexed values and relationships.
In practice, this leads to the creation of automatic table connections when field names match. For example, you cannot have different tables without relationships that have the same field. You have to get used to this. You either have to rename the columns and ensure that names do not match, or consolidate all fact tables into one and surround them with reference tables like a 'star' schema. This might be convenient for beginners, but experienced analysts may not find it an issue.
A typical interface for data loading and processing for an analyst looks like this.
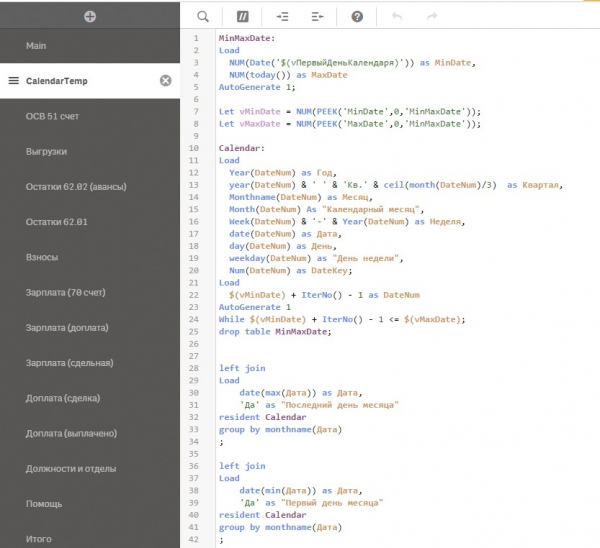
Figure 3. Qlik Sense Data Load Editor, Calendar table
Note: In Power BI, the situation usually looks different; you maintain different fact and reference tables and can manually join tables in the classical way, meaning you match columns to each other manually.
Because you are competing?
Developers of Tableau position it as BI with a user-friendly and approachable interface that allows analysts to explore their data independently. Yes, we had analysts in our company who could create their reports without IT experience. However, I would rate Tableau lower for several reasons:
— Poor localization for the Russian language
— Tableau Online servers are not located in Russia
— The quite simple data load builder starts causing problems when you need to construct a fairly complex data model.
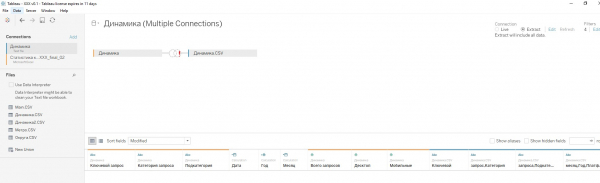
Figure 4. Tableau Data Load Builder
One of the questions we ask during an interview for Tableau analysts is, "How do you build a fact table model with reference tables without bringing everything into a single table?" Data Blending requires thoughtful use. I have repeatedly corrected my analysts' data duplication errors after such merges.
Additionally, Tableau has a rather unique system where you create each chart on a separate Sheet, and then you create a Dashboard to start placing the created sheets. Later, you can create a Story, which is a combination of different Dashboards. Development in Qlik and Power BI is simpler in this regard; you can quickly lay out chart templates on a sheet, set measures and dimensions, and the Dashboard is ready. I believe that the effort required for preparation in Tableau increases for this reason.
2. Data Sources and Loading

There is no clear leader in this section, but we will highlight Qlik due to a couple of nice features.
Tableau is limited in data sources in the free version, but in our articles, we focus more on business, and businesses can afford commercial products and analysts. Therefore, we did not lower Tableau's rating based on this parameter.
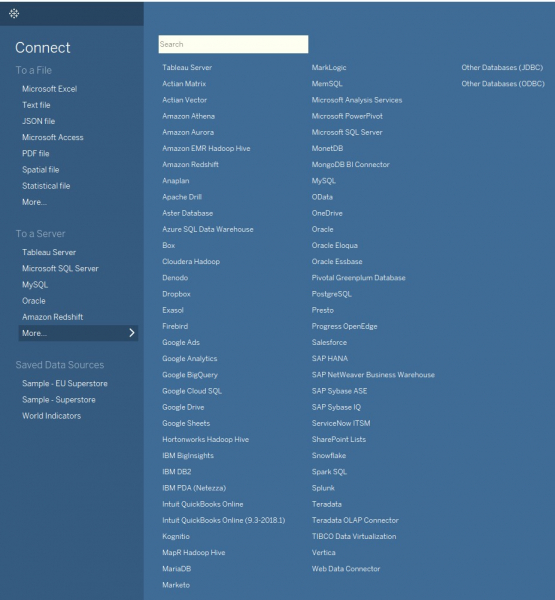
Figure 5. List of possible Tableau data sources
Overall, the list of sources is impressive everywhere — all table files, all standard databases, web connections, everything works everywhere. I haven't encountered non-standard data warehouses; there may be nuances, but in most cases, you won't have problems loading data. The only exception might be 1C. There are no direct connectors to 1C.
Qlik partners in Russia sell their own connectors for 100,000 — 200,000 rubles, but in most cases, it's cheaper to export data from 1C to FTP in Excel or an SQL database. You can also publish the 1C database on the web and connect to it via the Odata protocol.
Power BI and Tableau can do this by default, while Qlik will require a paid connector, so it’s easier to export to an intermediate database. In any case, all questions regarding connections can be resolved.
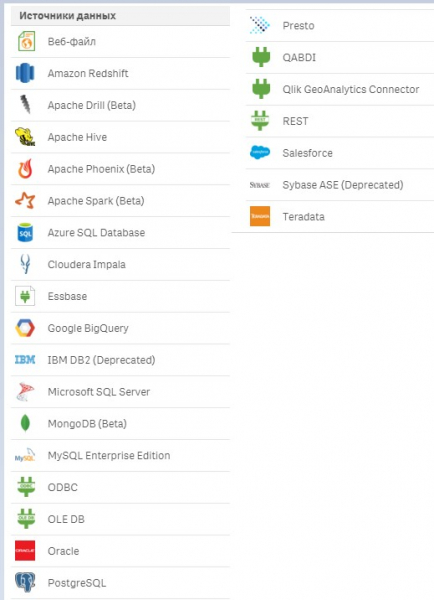
Figure 6. List of possible Qlik Sense data sources
It is also worth noting a feature of Qlik that they offer both paid and free connectors as a separate product.
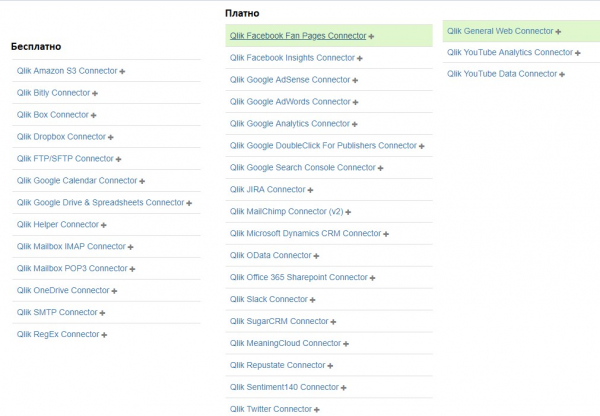
Figure 7. Additional connectors for Qlik Sense
From experience, I can add that when dealing with large volumes of data or numerous sources, it is not always practical to connect a BI system right away. Serious projects typically utilize a data warehouse, a database with data already prepared for analysis, etc. You can't just export, say, 1 billion records into a BI system; you need to carefully plan the architecture of the solution.
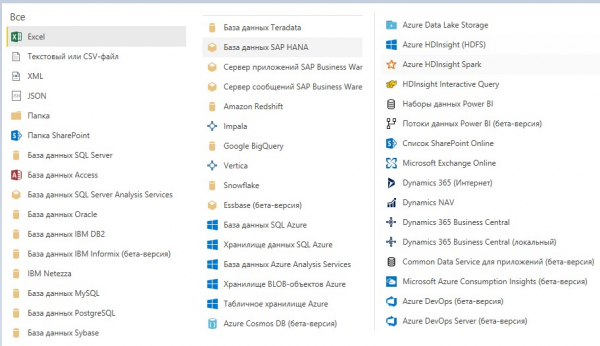
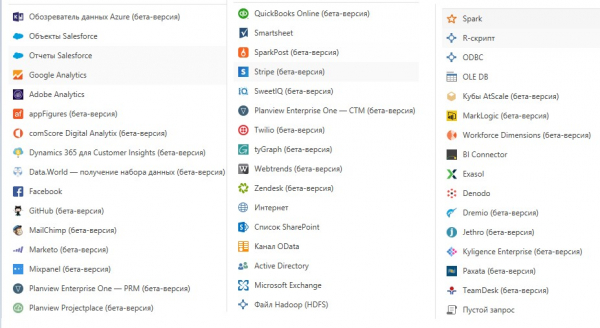
Figure 8. Power BI Data Sources
But why was Qlik highlighted? I really like three things:
— QVD files
A proprietary data storage format. It is sometimes possible to build serious commercial projects solely on QVD files. For example, the first level is raw data. The second level is processed files. The third level is aggregated data, and so on. These files can be used in various applications, and different employees and services can be responsible for them. The loading speed from these files is ten times faster than from ordinary data sources. This allows for savings on the database and sharing information between different Qlik applications.
— Incremental data loading
Yes, Power BI and Tableau can also do this. However, Power BI requires an expensive Premium version, and Tableau does not have the same flexibility as Qlik. In Qlik, you can create snapshots of systems at different times on QVD files and then process this data however you want.
— Connecting external scripts
In addition to QVD files for data storage, Qlik's script code can also be taken outside the application and included using the Include command. This allows for organized teamwork, the use of version control systems, and the management of unified code for different applications. Power BI has an advanced query editor, but we couldn't set up teamwork as effectively as in Qlik. In general, all BI tools face challenges in managing data, code, and visualizations simultaneously from a single location. The maximum we have managed to do is to separate QVD files and script code. Visual elements have to be edited within the reports themselves, which does not allow us to change visualizations across all clients simultaneously.
What about the mechanism called Live connection? Tableau and Power BI support LIVE connections to several sources, unlike Qlik. We are rather indifferent to this feature, as practice shows that when it comes to big data, working with a LIVE connection becomes simply impossible. BI is needed mostly for big data.
3. Data Cleaning, ETL (Extract, Transform, Load)

In this section, I have 2 leaders: Qlik Sense and Power BI.
Let's say Qlik is powerful but complex. Once you understand their SQL-like language, you can do almost anything — virtual tables, joins and merges, loop through a table and generate new tables, and a ton of string processing commands. For instance, a single cell field filled with data like “Ivanov 851 White” can be split not only into 3 columns (as everyone can do), but also immediately into 3 rows, for example. The same goes for merging 3 rows into 1 on the fly.

Figure 9. How to Load and Transpose a Table in Qlik Sense from Google Sheets
Power BI seems simpler in this regard, but most tasks are easily solved through the query editor. You set a number of parameters, transpose the table, work with the data, all without a single line of code.
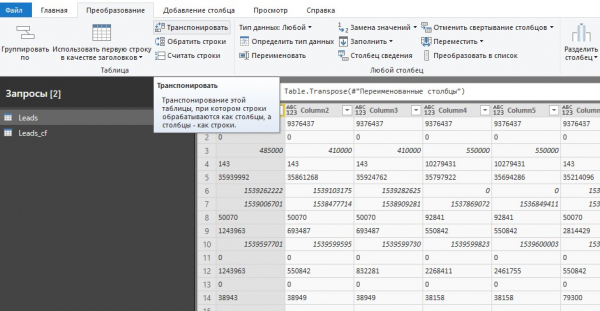
Figure 10. How to Load and Transpose a Table in Power BI from AmoCRM
I think Tableau has a different ideology. They emphasize beauty and design more. Connecting a bunch of different sources, merging them all, and processing within Tableau seems very cumbersome to me. In commercial projects, data for Tableau is usually prepared and accumulated in storage and databases in advance.
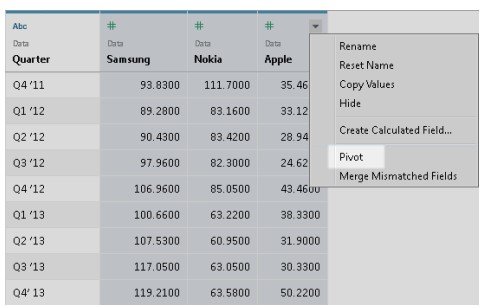
Figure 11. How to Load and Transpose a Table in Tableau
4. Visualizations

In this section, we did not designate a leader. We will have a separate article where we show the same report in all 3 systems using one case study. This is more about taste and the skill of the analyst. On the internet, you can find very beautiful images built on the basis of any of these systems. The basic visualization capabilities are quite similar across the board. Everything else is solved through the use of Extensions. There are both paid and free options. Extensions come from the vendors themselves as well as from freelancers and integrators. You can even write your own visualization extension for any platform.
I like the style of Tableau; I consider it strict and corporate. However, achieving a truly beautiful image in Tableau is difficult. A great example of Tableau visualization using only extensions. I won't be able to replicate this because I don't have those extensions, but it looks beautiful.
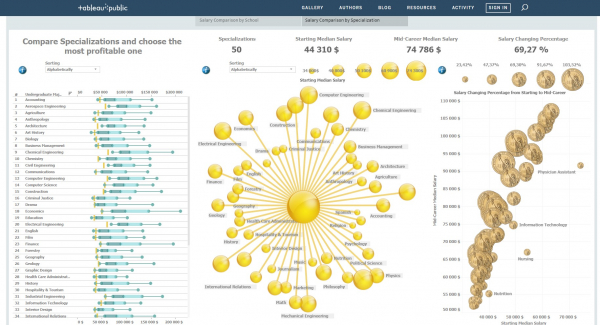
Figure 12. Appearance of Tableau reports with Extensions
You can also make Power BI interesting.
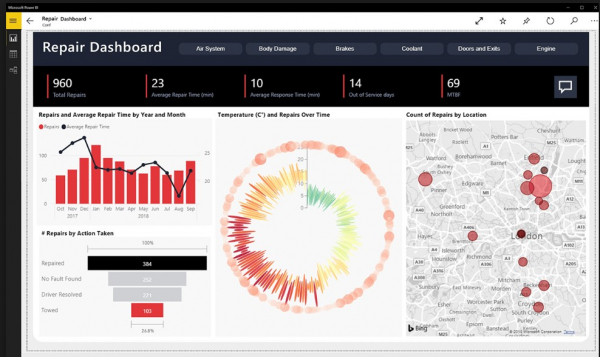
Figure 13. Appearance of Power BI reports with Extensions
The only thing I don't understand about Power BI is why they have such strange default colors. For any chart, I have to change the color to my corporate brand color and I'm surprised by the standard palette.
Qlik Sense also relies on Extensions. The use of add-ons can change reports beyond recognition. You can also apply your own theme and styling.
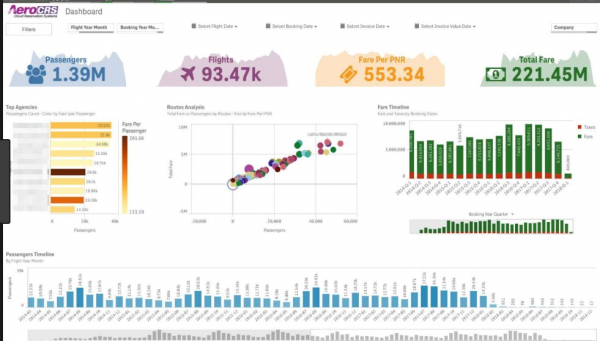
Figure 14. Appearance of Qlik Sense reports with Extensions
From a developer's perspective, I find Qlik Sense more convenient due to standard options like alternate dimensions and measures. You can set multiple dimensions and measures in the visualization settings, and the user can easily choose what to view on a given chart.
In Power BI and Tableau, I have to configure parameters, buttons, and program the system's behavior based on these parameters. I find it surprising how complicated it is. The same goes for the ability to change the appearance of visualizations.
In Qlik, you can hide different types of visualizations in one object, whereas in Power BI and Tableau this is more complicated. Again, it largely depends on the skill of the performer. A masterpiece can be created in any system, but without experience, the results will be unimpressive graphs everywhere.
5. Corporate environment - server, reports

All products have corporate server versions. I've worked with all editions and can say that each has its strengths and weaknesses. The choice of product should be based on your software requirements considering their nuances. All vendors allow permissions to be granted at both the account and group level, as well as at the Data Row Level Security level. Automatic report updates are available on a schedule.
Qlik Sense Enterprise offers an excellent opportunity to build analytics within your organization for medium-sized businesses. It may seem more expensive than Power BI Pro, but it's important to remember that Power BI Pro servers are hosted on Microsoft’s cloud, and you cannot influence performance. When you need Power BI Premium, which can be deployed on your servers, the price starts at $5,000 per month.
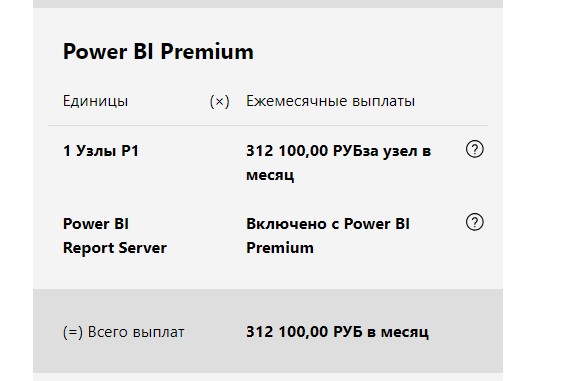
Qlik Sense Enterprise starts at 230,000 rubles for 5 licenses (annual fee, after that only technical support), which is much more affordable than Power BI Premium. And Qlik Sense Enterprise allows you to utilize all the features of Qlik, except for one. For some reason, Qlik decided that the functionality to send reports in PDF via email should be provided as a separate service called NPrinting.
However, Qlik Sense Enterprise is more powerful than Power BI Pro, so a comparison can be made here.
Qlik Sense Enterprise = Power BI Premium. For equal capabilities, it turns out to be cheaper for mid-sized implementations. Large implementations are usually calculated on the vendor's side, where they can offer individual terms for your company.
In this regard, we prefer Qlik Sense Enterprise, as it offers all the possibilities to construct serious analytics on large datasets. In our opinion, Qlik performs faster than Power BI on large volumes, and at Qlik conferences, clients have mentioned that when initially testing their data with billions of records, Power BI showed inferior results.
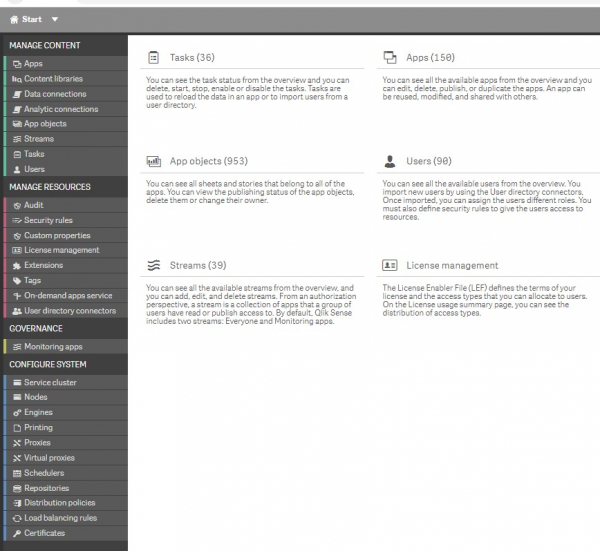
Figure 15. Appearance of Qlik Sense Enterprise server reports
Qlik Sense Cloud = Power BI Pro. Qlik Sense Cloud is 1.5 times more expensive* and there is a significant limitation that prevents us from using this platform. Extensions cannot be used, even built-in ones. Without extensions, Qlik somewhat loses its visual appeal.
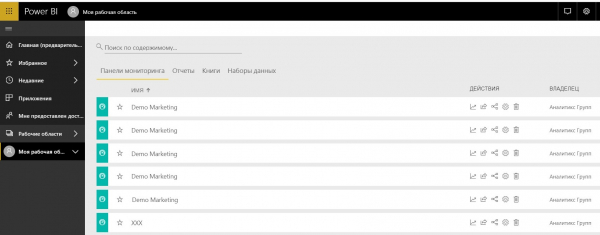
Figure 16. Appearance of the Power BI Pro dashboard
*An alternative option is using Qlik Sense Enterprise on a subscription basis. However, to ensure this article is not perceived as advertising, we will not discuss our pricing.
Tableau stands somewhat apart for us. They offer both cloud subscriptions at $70 for developers and $15 for viewers, as well as expensive server solutions. The main idea of Tableau is that for large data, data processing and storage need to be organized on the client side. Objectively, its limited functionality does not allow for serious data processing in Tableau. Visualization and analysis are possible, yes. However, creating a separate storage system is usually problematic for small and medium businesses. I would reduce the score for Tableau, if it weren't for their one standout feature. Tableau Server can easily send emails on a schedule with attachments in CSV or PDF format. Moreover, it allows for permission distribution, auto-filters, and more. Power BI and Qlik cannot do this for some reason, which can be critical for some users. Because of this, Tableau maintains its position in our debate.
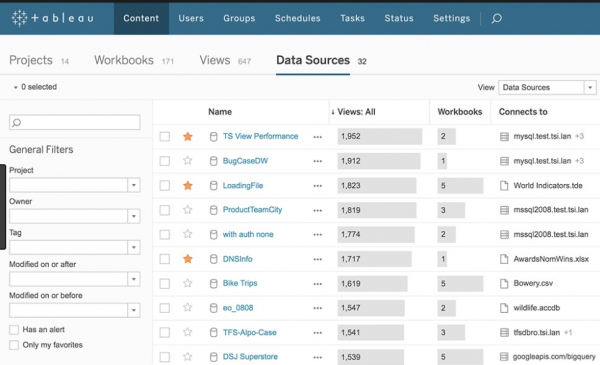
Figure 17. Appearance of the Tableau Server control panel.
In the corporate environment, it is also important to consider the costs of implementation and maintenance. In Russia, it has become common for Power BI to be more widespread in small businesses. This has led to a multitude of job vacancies and resumes, as well as the emergence of small integrators. This will make it easier to find specialists for small projects. However, most of them are unlikely to have experience with large implementations and working with big data. In contrast, there are fewer Qlik and Tableau partners. These partners specialize in large implementations with a higher average check. There are not many job vacancies and resumes for these products, and the entry threshold is more complex than with Power BI. Nevertheless, there are successful implementations of these products in Russia servicing thousands of users, and they perform well with big data. It is essential to understand the strengths and weaknesses of the products in relation to your business.
6. Mobile device support.

In this section, we will highlight Power BI and Tableau. You can install the mobile applications, and they look quite acceptable on mobile device screens. However, we believe that analytics on mobile devices lags behind that on PCs. It's still not as convenient to use filters, the images are small, and the numbers are hard to see, etc.
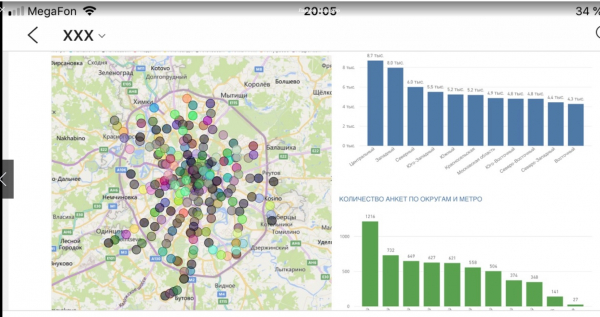
Figure 18. Appearance of the Power BI report on iPhone
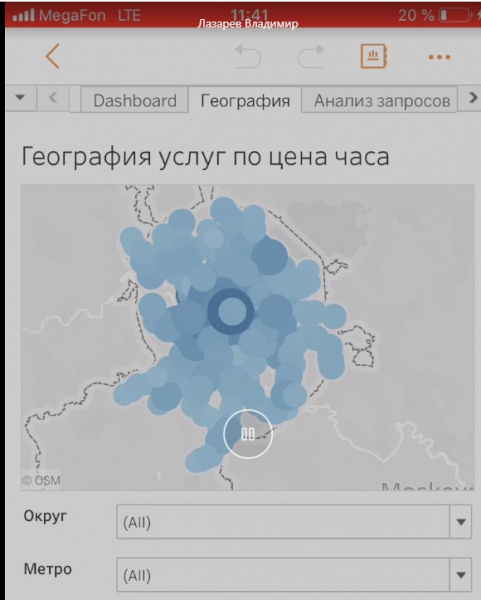
Figure 19. Appearance of the Tableau report on iPhone
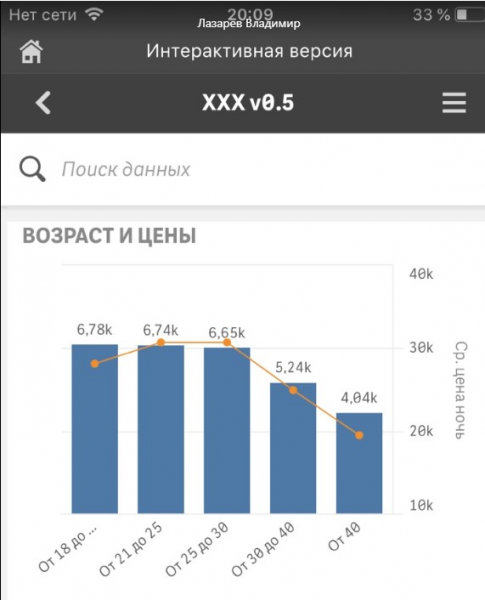
Figure 20. Appearance of the Qlik Sense report on iPhone
Why did we lower the Qlik scores? For reasons unknown to us, the mobile client is only available on iPhone; on Android, you have to use the regular browser. Additionally, when using Qlik, you have to understand that various extensions or visualizations do not resize or auto-position on mobile devices as expected. A report that looks very attractive on a PC appears much worse on a small screen. It is necessary to create a separate report for mobile devices, removing filters, KPIs, and other elements. This also applies to Power BI or Tableau, but it is particularly pronounced in Qlik. We hope Qlik will improve its mobile client.
If you plan to spend a lot of time analyzing data specifically from mobile devices, it makes sense to install all three clients and check their display on test reports. Any vendor has a gallery of test reports on their website for review.
7. Embedded analytics in third-party applications/sites

Using analytics as a third-party service is not always convenient. Perhaps you are developing your product but are not ready to embark on creating visualizations and an analytics engine from scratch. You might want to deploy analytics on your website for clients to register themselves, upload their data, and conduct analysis within their personal accounts. For this, you need embedded analytics.
All products allow this, but in this category, we will highlight Qlik.
Power BI and Tableau clearly state that for such purposes, you need to purchase a separate product, Tableau Embedded Analytics or Power BI Embedded. These are not cheap solutions, costing thousands of dollars per month, which immediately limits their usage. Most projects quickly become unprofitable for our clients. This means that you not only need to publish a report to the entire Internet but also ensure the publishing of reports according to specific access, with data protection, user authorization, etc.
Qlik will allow you to find a solution. Of course, they also have the Qlik Analytics Platform, which is licensed per server and provides unlimited connections. This will also be expensive, just like competitors Tableau and Power BI. And in the case of unlimited connections, there are not many options.
However, Qlik has a concept called Mashup. Suppose you have Qlik Sense Enterprise and 10 licenses. The standard analytics and interface have become tiresome. You set up your own website or application and can embed all your analytics directly there. The trick is that, simply put, a Mashup is visualization in programming code. Through the API, you can programmatically create visualizations within your application or website. Qlik Sense Enterprise will still be necessary for licensing (the licenses for connections to the site = licenses for connections to BI), for data loading, etc., but the visualizations will be displayed not on the side of that server but embedded in your application or website. You can use CSS styles, set new fonts, and colors. Your 10 users will no longer access the analytics server but will use your corporate portal or application. Analytics will reach a new level.
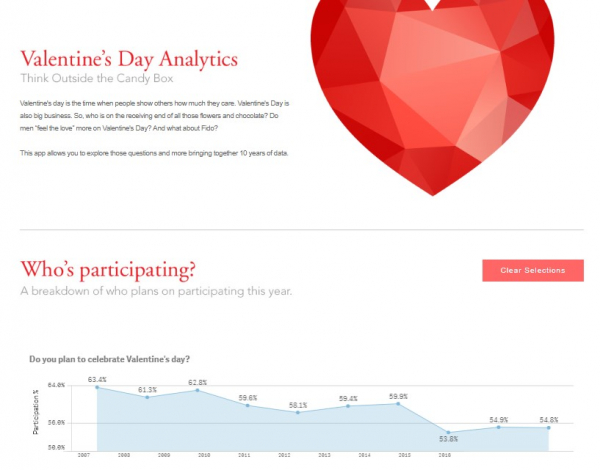
Figure 21. Appearance of the Qlik Sense report embedded on the website
It will be difficult to distinguish where the website elements are, and where Qlik Sense begins.
Of course, you will need a programmer, or rather several. One for web programming, one for working with the Qlik API. But the result is worth it.
Conclusions. Let’s summarize.
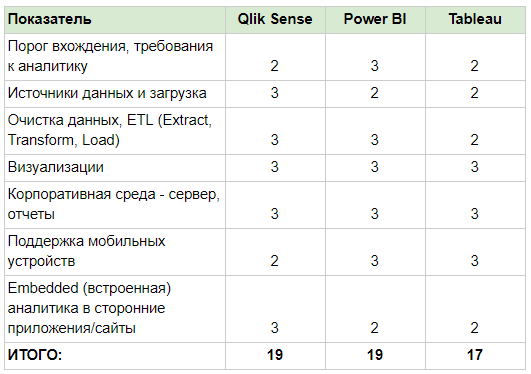
It’s hard to definitively say who is better and who is worse. Power BI and Qlik are on par in our competition, while Tableau is slightly behind. However, the result might differ for your business. The visual component is very important in BI platforms. If you've looked at dozens of demo reports and images online for all BI systems and you don't like the appearance of one of the platforms, chances are you won’t implement it, even if the price or technical specifications are satisfactory.
Next, you will definitely need to calculate the costs of licenses, implementation, and maintenance of the BI platform. In your case, a leader may be identified. The contractor or the ability to hire a suitable specialist plays a crucial role. Without professionals, the results on any platform will be disappointing.
Wishing you successful BI integrations, Andrey Zhdanov and Vladimir Lazarev, Analytics Group
Source: habr.com
