

Hola a todos. En mayo se lanza OTUS , tanto infraestructura como aplicaciones usando Zabbix, Prometheus, Grafana y ELK. En este sentido, tradicionalmente compartimos material útil sobre el tema.
para Prometheus le permite monitorear servicios externos a través de HTTP, HTTPS, DNS, TCP, ICMP. En este artículo, le mostraré cómo configurar el monitoreo HTTP/HTTPS usando el exportador Blackbox. Ejecutaremos el exportador Blackbox en Kubernetes.
Medio ambiente
Necesitaremos lo siguiente:
- Kubernetes
- Operador Prometeo
configuración del exportador de caja negra
Configurando Blackbox vía ConfigMap para la configuración http Módulo de monitorización de servicios web.
apiVersion: v1
kind: ConfigMap
metadata:
  name: prometheus-blackbox-exporter
  labels:
    app: prometheus-blackbox-exporter
data:
  blackbox.yaml: |
    modules:
      http_2xx:
        http:
          no_follow_redirects: false
          preferred_ip_protocol: ip4
          valid_http_versions:
          - HTTP/1.1
          - HTTP/2
          valid_status_codes: []
        prober: http
        timeout: 5s
Módulo http_2xx se utiliza para verificar que el servicio web devuelve un código de estado HTTP 2xx. La configuración del exportador de caja negra se describe con más detalle en .
Implementar el exportador de caja negra en el clúster de Kubernetes
Describir Deployment и Service para su implementación en Kubernetes.
---
kind: Service
apiVersion: v1
metadata:
  name: prometheus-blackbox-exporter
  labels:
    app: prometheus-blackbox-exporter
spec:
  type: ClusterIP
  ports:
    - name: http
      port: 9115
      protocol: TCP
  selector:
    app: prometheus-blackbox-exporter

---
apiVersion: apps/v1
kind: Deployment
metadata:
  name: prometheus-blackbox-exporter
  labels:
    app: prometheus-blackbox-exporter
spec:
  replicas: 1
  selector:
    matchLabels:
      app: prometheus-blackbox-exporter
  template:
    metadata:
      labels:
        app: prometheus-blackbox-exporter
    spec:
      restartPolicy: Always
      containers:
        - name: blackbox-exporter
          image: "prom/blackbox-exporter:v0.15.1"
          imagePullPolicy: IfNotPresent
          securityContext:
            readOnlyRootFilesystem: true
            runAsNonRoot: true
            runAsUser: 1000
          args:
            - "--config.file=/config/blackbox.yaml"
          resources:
            {}
          ports:
            - containerPort: 9115
              name: http
          livenessProbe:
            httpGet:
              path: /health
              port: http
          readinessProbe:
            httpGet:
              path: /health
              port: http
          volumeMounts:
            - mountPath: /config
              name: config
        - name: configmap-reload
          image: "jimmidyson/configmap-reload:v0.2.2"
          imagePullPolicy: "IfNotPresent"
          securityContext:
            runAsNonRoot: true
            runAsUser: 65534
          args:
            - --volume-dir=/etc/config
            - --webhook-url=http://localhost:9115/-/reload
          resources:
            {}
          volumeMounts:
            - mountPath: /etc/config
              name: config
              readOnly: true
      volumes:
        - name: config
          configMap:
            name: prometheus-blackbox-exporter
El exportador Blackbox se puede implementar con el siguiente comando. Espacio de nombres monitoring se refiere al Operador Prometheus.
kubectl --namespace=monitoring apply -f blackbox-exporter.yamlVerifique que todos los servicios se estén ejecutando usando el siguiente comando:
kubectl --namespace=monitoring get all --selector=app=prometheus-blackbox-exporterVerificación de caja negra
Puede acceder a la interfaz web de Blackbox Exporter con port-forward:
kubectl --namespace=monitoring port-forward svc/prometheus-blackbox-exporter 9115:9115Conéctese a la interfaz web de Blackbox Exporter a través de un navegador web en : 9115.
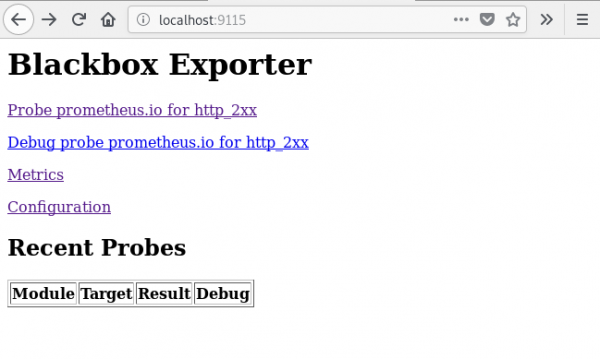
Si vas a , verá el resultado de verificar la URL especificada ().
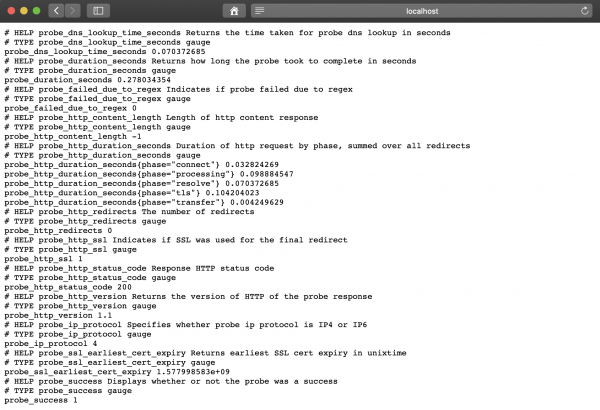
Valor métrico probe_success igual a 1 significa verificación exitosa. Un valor de 0 indica un error.
Configurando Prometeo
Después de implementar el exportador BlackBox, configure Prometheus en prometheus-additional.yaml.
- job_name: 'kube-api-blackbox'
  scrape_interval: 1w
  metrics_path: /probe
  params:
    module: [http_2xx]
  static_configs:
   - targets:
      - https://www.google.com
      - http://www.example.com
      - https://prometheus.io
  relabel_configs:
   - source_labels: [__address__]
     target_label: __param_target
   - source_labels: [__param_target]
     target_label: instance
   - target_label: __address__
     replacement: prometheus-blackbox-exporter:9115 # The blackbox exporter.
generamos Secretusando el siguiente comando.
PROMETHEUS_ADD_CONFIG=$(cat prometheus-additional.yaml | base64)
cat << EOF | kubectl --namespace=monitoring apply -f -
apiVersion: v1
kind: Secret
metadata:
  name: additional-scrape-configs
type: Opaque
data:
  prometheus-additional.yaml: $PROMETHEUS_ADD_CONFIG
EOF
Especificar additional-scrape-configs para el operador Prometheus usando additionalScrapeConfigs.
kubectl --namespace=monitoring edit prometheuses k8s
...
spec:
  additionalScrapeConfigs:
    key: prometheus-additional.yaml
    name: additional-scrape-configs
Nos dirigimos a la interfaz web de Prometheus, comprobamos las métricas y objetivos.
kubectl --namespace=monitoring port-forward svc/prometheus-k8s 9090:9090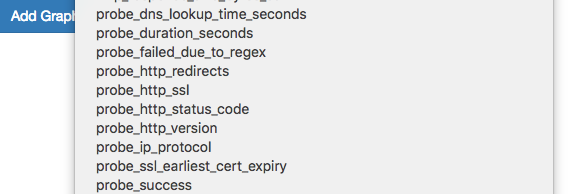
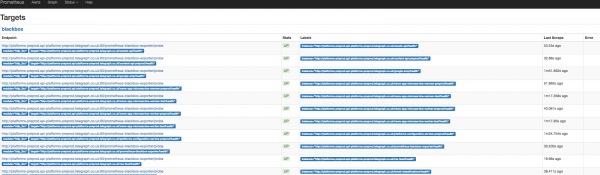
Vemos las métricas y objetivos de Blackbox.
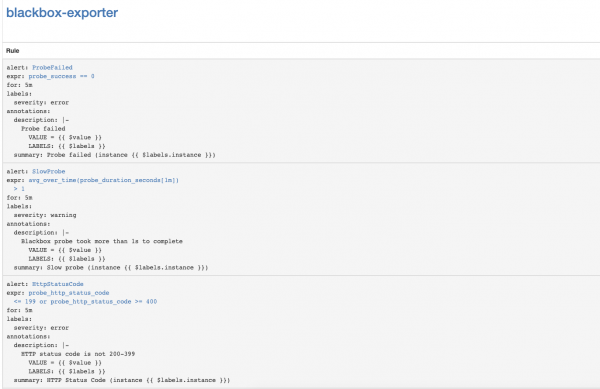
Agregar reglas para notificaciones (alerta)
Para recibir notificaciones del exportador de Blackbox, agreguemos reglas al Operador Prometheus.
kubectl --namespace=monitoring edit prometheusrules prometheus-k8s-rules
...
  - name: blackbox-exporter
    rules:
    - alert: ProbeFailed
      expr: probe_success == 0
      for: 5m
      labels:
        severity: error
      annotations:
        summary: "Probe failed (instance {{ $labels.instance }})"
        description: "Probe failedn  VALUE = {{ $value }}n  LABELS: {{ $labels }}"
    - alert: SlowProbe
      expr: avg_over_time(probe_duration_seconds[1m]) > 1
      for: 5m
      labels:
        severity: warning
      annotations:
        summary: "Slow probe (instance {{ $labels.instance }})"
        description: "Blackbox probe took more than 1s to completen  VALUE = {{ $value }}n  LABELS: {{ $labels }}"
    - alert: HttpStatusCode
      expr: probe_http_status_code <= 199 OR probe_http_status_code >= 400
      for: 5m
      labels:
        severity: error
      annotations:
        summary: "HTTP Status Code (instance {{ $labels.instance }})"
        description: "HTTP status code is not 200-399n  VALUE = {{ $value }}n  LABELS: {{ $labels }}"
    - alert: SslCertificateWillExpireSoon
      expr: probe_ssl_earliest_cert_expiry - time() < 86400 * 30
      for: 5m
      labels:
        severity: warning
      annotations:
        summary: "SSL certificate will expire soon (instance {{ $labels.instance }})"
        description: "SSL certificate expires in 30 daysn  VALUE = {{ $value }}n  LABELS: {{ $labels }}"
    - alert: SslCertificateHasExpired
      expr: probe_ssl_earliest_cert_expiry - time()  <= 0
      for: 5m
      labels:
        severity: error
      annotations:
        summary: "SSL certificate has expired (instance {{ $labels.instance }})"
        description: "SSL certificate has expired alreadyn  VALUE = {{ $value }}n  LABELS: {{ $labels }}"
    - alert: HttpSlowRequests
      expr: avg_over_time(probe_http_duration_seconds[1m]) > 1
      for: 5m
      labels:
        severity: warning
      annotations:
        summary: "HTTP slow requests (instance {{ $labels.instance }})"
        description: "HTTP request took more than 1sn  VALUE = {{ $value }}n  LABELS: {{ $labels }}"
    - alert: SlowPing
      expr: avg_over_time(probe_icmp_duration_seconds[1m]) > 1
      for: 5m
      labels:
        severity: warning
      annotations:
        summary: "Slow ping (instance {{ $labels.instance }})"
        description: "Blackbox ping took more than 1sn  VALUE = {{ $value }}n  LABELS: {{ $labels }}"
En la interfaz web de Prometheus, vaya a Estado => Reglas y busque las reglas de alerta para el exportador de blackbox.
Configuración de notificaciones de caducidad del certificado SSL del servidor API de Kubernetes
Configuremos el monitoreo de vencimiento del certificado SSL del servidor API de Kubernetes. Enviará notificaciones una vez por semana.
Agregar el módulo exportador de Blackbox para la autenticación del servidor API de Kubernetes.
kubectl --namespace=monitoring edit configmap prometheus-blackbox-exporter
...
      kube-api:
        http:
          method: GET
          no_follow_redirects: false
          preferred_ip_protocol: ip4
          tls_config:
            insecure_skip_verify: false
            ca_file: /var/run/secrets/kubernetes.io/serviceaccount/ca.crt
          bearer_token_file: /var/run/secrets/kubernetes.io/serviceaccount/token
          valid_http_versions:
          - HTTP/1.1
          - HTTP/2
          valid_status_codes: []
        prober: http
        timeout: 5s
Agregar la configuración de raspado de Prometheus
- job_name: 'kube-api-blackbox'
  metrics_path: /probe
  params:
    module: [kube-api]
  static_configs:
   - targets:
      - https://kubernetes.default.svc/api
  relabel_configs:
   - source_labels: [__address__]
     target_label: __param_target
   - source_labels: [__param_target]
     target_label: instance
   - target_label: __address__
     replacement: prometheus-blackbox-exporter:9115 # The blackbox exporter.
Aplicar el secreto de Prometeo
PROMETHEUS_ADD_CONFIG=$(cat prometheus-additional.yaml | base64)
cat << EOF | kubectl --namespace=monitoring apply -f -
apiVersion: v1
kind: Secret
metadata:
  name: additional-scrape-configs
type: Opaque
data:
  prometheus-additional.yaml: $PROMETHEUS_ADD_CONFIG
EOF
Agregar reglas de alerta
kubectl --namespace=monitoring edit prometheusrules prometheus-k8s-rules
...
  - name: k8s-api-server-cert-expiry
    rules:
    - alert: K8sAPIServerSSLCertExpiringAfterThreeMonths
      expr: probe_ssl_earliest_cert_expiry{job="kube-api-blackbox"} - time() < 86400 * 90
      for: 1w
      labels:
        severity: warning
      annotations:
        summary: "Kubernetes API Server SSL certificate will expire after three months (instance {{ $labels.instance }})"
        description: "Kubernetes API Server SSL certificate expires in 90 daysn  VALUE = {{ $value }}n  LABELS: {{ $labels }}"
Enlaces de interés
Fuente: habr.com
