

Tere kõigile. Mais käivitab OTUS , nii infrastruktuuri kui rakenduste jaoks, kasutades Zabbixit, Prometheust, Grafanat ja ELK-d. Seetõttu jagame traditsiooniliselt kasulikku teavet sellel teemal.
Prometheusele võimaldab väliste teenuste jälgimist läbi HTTP, HTTPS, DNS, TCP, ICMP. Selles artiklis näitan, kuidas seadistada HTTP/HTTPS jälgimist Blackbox eksportija abil. Käivitame Blackbox eksportija Kuberneteses.
Keskkond
Me vajame järgmist:
- Kubernetes
- Prometheus Operator
Blackbox eksportija konfiguratsioon
Seadistame Blackboxi läbi ConfigMap jälgimise seadistamiseks http veebiteenuste jälgimise mooduli.
apiVersion: v1
kind: ConfigMap
metadata:
  name: prometheus-blackbox-exporter
  labels:
    app: prometheus-blackbox-exporter
data:
  blackbox.yaml: |
    modules:
      http_2xx:
        http:
          no_follow_redirects: false
          preferred_ip_protocol: ip4
          valid_http_versions:
          - HTTP/1.1
          - HTTP/2
          valid_status_codes: []
        prober: http
        timeout: 5s
Moodul http_2xx kasutatakse selle kontrollimiseks, et veebiteenus tagastab HTTP 2xx staatusekoodi. Blackbox eksportija konfiguratsiooni kohta on rohkem teavet .
Blackbox eksportija juurutamine Kuberneteses
Kirjeldage Deployment ja Teenused Kuberneteses juurutamiseks.
---
kind: Service
apiVersion: v1
metadata:
  name: prometheus-blackbox-exporter
  labels:
    app: prometheus-blackbox-exporter
spec:
  type: ClusterIP
  ports:
    - name: http
      port: 9115
      protocol: TCP
  selector:
    app: prometheus-blackbox-exporter

---
apiVersion: apps/v1
kind: Deployment
metadata:
  name: prometheus-blackbox-exporter
  labels:
    app: prometheus-blackbox-exporter
spec:
  replicas: 1
  selector:
    matchLabels:
      app: prometheus-blackbox-exporter
  template:
    metadata:
      labels:
        app: prometheus-blackbox-exporter
    spec:
      restartPolicy: Always
      containers:
        - name: blackbox-exporter
          image: "prom/blackbox-exporter:v0.15.1"
          imagePullPolicy: IfNotPresent
          securityContext:
            readOnlyRootFilesystem: true
            runAsNonRoot: true
            runAsUser: 1000
          args:
            - "--config.file=/config/blackbox.yaml"
          resources:
            {}
          ports:
            - containerPort: 9115
              name: http
          livenessProbe:
            httpGet:
              path: /health
              port: http
          readinessProbe:
            httpGet:
              path: /health
              port: http
          volumeMounts:
            - mountPath: /config
              name: config
        - name: configmap-reload
          image: "jimmidyson/configmap-reload:v0.2.2"
          imagePullPolicy: "IfNotPresent"
          securityContext:
            runAsNonRoot: true
            runAsUser: 65534
          args:
            - --volume-dir=/etc/config
            - --webhook-url=http://localhost:9115/-/reload
          resources:
            {}
          volumeMounts:
            - mountPath: /etc/config
              name: config
              readOnly: true
      volumes:
        - name: config
          configMap:
            name: prometheus-blackbox-exporter
Blackbox eksportijat saab juurutada järgmise käsuga. Nimi ruum monitoring on seotud Prometheus Operatoriga.
kubectl --namespace=monitoring apply -f blackbox-exporter.yamlVeenduge, et kõik teenused on käimas, kasutades järgmist käsku:
kubectl --namespace=monitoring get all --selector=app=prometheus-blackbox-exporterBlackboxi kontrollimine
Saate pääseda Blackbox eksportija veebiliidesele, kasutades port-forward:
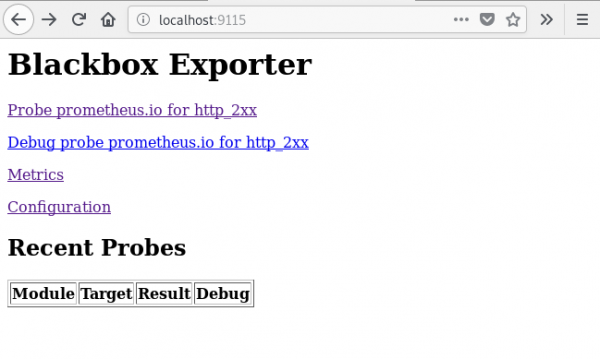
kubectl --namespace=monitoring port-forward svc/prometheus-blackbox-exporter 9115:9115Ühenduge Blackbox eksportija veebiliidesele veebibrauseri kaudu aadressil :9115.
Kui külastate aadressi , näete kontrolli tulemust antud URL-i jaoks ().
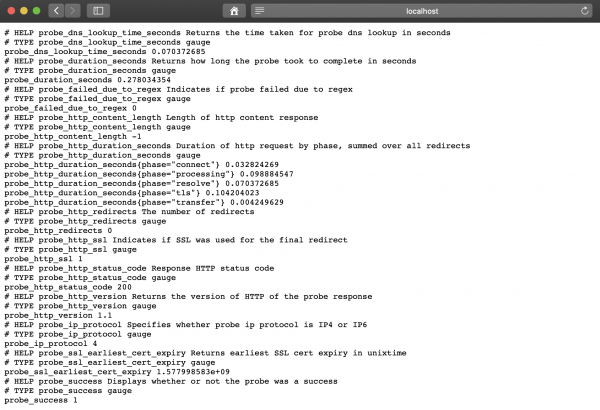
Mõõdiku väärtus probe_success mis on 1, tähendab edukat kontrolli. Väärtus 0 ütleb, et on viga.
Prometheuse seadistamine
Pärast BlackBox eksportija juurutamist seadistame Prometheuse failis prometheus-additional.yaml.
- job_name: 'kube-api-blackbox'
  scrape_interval: 1w
  metrics_path: /probe
  params:
    module: [http_2xx]
  static_configs:
   - targets:
      - https://www.google.com
      - http://www.example.com
      - https://prometheus.io
  relabel_configs:
   - source_labels: [__address__]
     target_label: __param_target
   - source_labels: [__param_target]
     target_label: instance
   - target_label: __address__
     replacement: prometheus-blackbox-exporter:9115 # Blackbox eksportija.
Genereerime Secret, kasutades järgmist käsku.
PROMETHEUS_ADD_CONFIG=$(cat prometheus-additional.yaml | base64)
cat << EOF | kubectl --namespace=monitoring apply -f -
apiVersion: v1
kind: Secret
metadata:
  name: additional-scrape-configs
type: Opaque
data:
  prometheus-additional.yaml: $PROMETHEUS_ADD_CONFIG
EOF
Määrame additional-scrape-configs Prometheuse operaatori jaoks, kasutades additionalScrapeConfigs.
kubectl --namespace=monitoring edit prometheuses k8s
...
spec:
  additionalScrapeConfigs:
    key: prometheus-additional.yaml
    name: additional-scrape-configs
Siseneme Prometheuse veebiliidesesse, kontrollime mõõdikuid ja sihte.
kubectl --namespace=monitoring port-forward svc/prometheus-k8s 9090:9090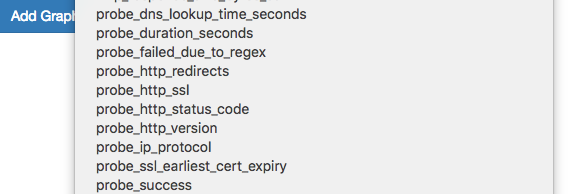
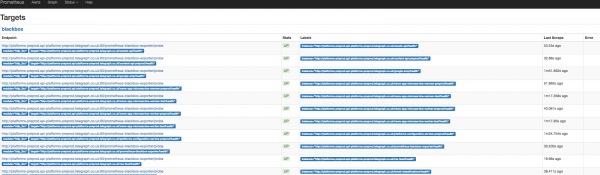
Näeme Blackboxi mõõdikuid ja sihte.
Hoiatusereeglite lisamine
Blackbox eksportijalt teavituste saamiseks lisame reeglid Prometheuse operaatorisse.
kubectl --namespace=monitoring edit prometheusrules prometheus-k8s-rules
...
  - name: blackbox-exporter
    rules:
    - alert: ProbeFailed
      expr: probe_success == 0
      for: 5m
      labels:
        severity: error
      annotations:
        summary: "Probe failed (instance {{ $labels.instance }})"
        description: "Probe failedn  VALUE = {{ $value }}n  LABELS: {{ $labels }}"
    - alert: SlowProbe
      expr: avg_over_time(probe_duration_seconds[1m]) > 1
      for: 5m
      labels:
        severity: warning
      annotations:
        summary: "Slow probe (instance {{ $labels.instance }})"
        description: "Blackbox probe took more than 1s to completen  VALUE = {{ $value }}n  LABELS: {{ $labels }}"
    - alert: HttpStatusCode
      expr: probe_http_status_code = 400
      for: 5m
      labels:
        severity: error
      annotations:
        summary: "HTTP Status Code (instance {{ $labels.instance }})"
        description: "HTTP status code is not 200-399n  VALUE = {{ $value }}n  LABELS: {{ $labels }}"
    - alert: SslCertificateWillExpireSoon
      expr: probe_ssl_earliest_cert_expiry - time() < 86400 * 30
      for: 5m
      labels:
        severity: warning
      annotations:
        summary: "SSL certificate will expire soon (instance {{ $labels.instance }})"
        description: "SSL certificate expires in 30 daysn  VALUE = {{ $value }}n  LABELS: {{ $labels }}"
    - alert: SslCertificateHasExpired
      expr: probe_ssl_earliest_cert_expiry - time()  1
      for: 5m
      labels:
        severity: warning
      annotations:
        summary: "HTTP slow requests (instance {{ $labels.instance }})"
        description: "HTTP request took more than 1sn  VALUE = {{ $value }}n  LABELS: {{ $labels }}"
    - alert: SlowPing
      expr: avg_over_time(probe_icmp_duration_seconds[1m]) > 1
      for: 5m
      labels:
        severity: warning
      annotations:
        summary: "Slow ping (instance {{ $labels.instance }})"
        description: "Blackbox ping took more than 1sn  VALUE = {{ $value }}n  LABELS: {{ $labels }}"
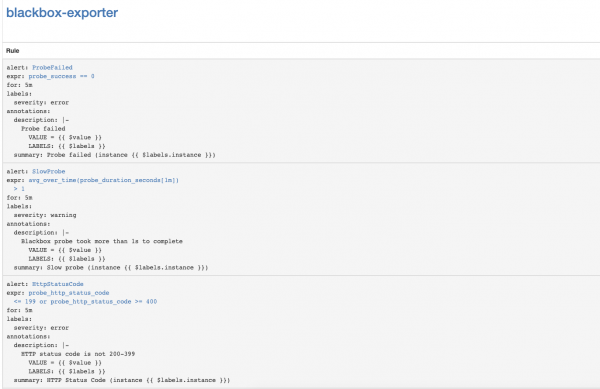
Prometheuse veebiliideses minge jaotisse Status => Rules ja leidke blackbox-exporteri alerting reeglid.
Kubernetes API Serveri SSL-sertifikaatide aegumise teadete seadistamine
Seame sisse Kubernetes API Serveri SSL-sertifikaatide aegumise jälgimise. See saadab teateid üks kord nädalas.
Lisame Blackbox eksportija mooduli Kubernetes API Serveri autentimise jaoks.
kubectl --namespace=monitoring edit configmap prometheus-blackbox-exporter
...
      kube-api:
        http:
          method: GET
          no_follow_redirects: false
          preferred_ip_protocol: ip4
          tls_config:
            insecure_skip_verify: false
            ca_file: /var/run/secrets/kubernetes.io/serviceaccount/ca.crt
          bearer_token_file: /var/run/secrets/kubernetes.io/serviceaccount/token
          valid_http_versions:
          - HTTP/1.1
          - HTTP/2
          valid_status_codes: []
        prober: http
        timeout: 5s
Lisame Prometheuse scrape-konfiguratsiooni
- job_name: 'kube-api-blackbox'
  metrics_path: /probe
  params:
    module: [kube-api]
  static_configs:
   - targets:
      - https://kubernetes.default.svc/api
  relabel_configs:
   - source_labels: [__address__]
     target_label: __param_target
   - source_labels: [__param_target]
     target_label: instance
   - target_label: __address__
     replacement: prometheus-blackbox-exporter:9115 # The blackbox exporter.
Rakendame Prometheust
PROMETHEUS_ADD_CONFIG=$(cat prometheus-additional.yaml | base64)
cat << EOF | kubectl --namespace=monitoring apply -f -
apiVersion: v1
kind: Secret
metadata:
  name: additional-scrape-configs
type: Opaque
data:
  prometheus-additional.yaml: $PROMETHEUS_ADD_CONFIG
EOF
Lisame häirereeglid
kubectl --namespace=monitoring edit prometheusrules prometheus-k8s-rules
...
  - name: k8s-api-server-cert-expiry
    rules:
    - alert: K8sAPIServerSSLCertExpiringAfterThreeMonths
      expr: probe_ssl_earliest_cert_expiry{job="kube-api-blackbox"} - time() < 86400 * 90
      for: 1w
      labels:
        severity: warning
      annotations:
        summary: "Kubernetes API serveri SSL-sertifikaat aegub kolme kuu pärast (instance {{ $labels.instance }})"
        description: "Kubernetes API serveri SSL-sertifikaat aegub 90 päeva pärastn  VALUE = {{ $value }}n  LABELS: {{ $labels }}"
Kasulikud lingid
Allikas: habr.com
