

Pozdrav svima. U svibnju OTUS pokreće , kako infrastrukture tako i aplikacija, koristeći Zabbix, Prometheus, Grafana i ELK. Tim povodom tradicionalno dijelimo korisne materijale o ovoj temi.
za Prometheus omogućuje praćenje vanjskih servisa putem HTTP, HTTPS, DNS, TCP, ICMP. U ovom članku ću vam pokazati kako postaviti praćenje HTTP/HTTPS pomoću Blackbox exportera. Pokretat ćemo Blackbox exporter u Kubernetesu.
Okruženje
Bit će nam potrebno sljedeće:
- Kubernetes
- Prometheus Operator
Konfiguracija blackbox exportera
Postavljamo Blackbox putem ConfigMap za konfiguraciju http modula za praćenje web servisa.
apiVersion: v1
kind: ConfigMap
metadata:
  name: prometheus-blackbox-exporter
  labels:
    app: prometheus-blackbox-exporter
data:
  blackbox.yaml: |
    modules:
      http_2xx:
        http:
          no_follow_redirects: false
          preferred_ip_protocol: ip4
          valid_http_versions:
          - HTTP/1.1
          - HTTP/2
          valid_status_codes: []
        prober: http
        timeout: 5s
Modul http_2xx koristi se za provjeru da li web servis vraća HTTP status kod 2xx. Detaljnija konfiguracija blackbox exportera opisuje se u .
Implementacija blackbox exportera u Kubernetes klaster
Definirajte Deployment i Service za implementaciju u Kubernetes.
---
kind: Service
apiVersion: v1
metadata:
  name: prometheus-blackbox-exporter
  labels:
    app: prometheus-blackbox-exporter
spec:
  type: ClusterIP
  ports:
    - name: http
      port: 9115
      protocol: TCP
  selector:
    app: prometheus-blackbox-exporter

---
apiVersion: apps/v1
kind: Deployment
metadata:
  name: prometheus-blackbox-exporter
  labels:
    app: prometheus-blackbox-exporter
spec:
  replicas: 1
  selector:
    matchLabels:
      app: prometheus-blackbox-exporter
  template:
    metadata:
      labels:
        app: prometheus-blackbox-exporter
    spec:
      restartPolicy: Always
      containers:
        - name: blackbox-exporter
          image: "prom/blackbox-exporter:v0.15.1"
          imagePullPolicy: IfNotPresent
          securityContext:
            readOnlyRootFilesystem: true
            runAsNonRoot: true
            runAsUser: 1000
          args:
            - "--config.file=/config/blackbox.yaml"
          resources:
            {}
          ports:
            - containerPort: 9115
              name: http
          livenessProbe:
            httpGet:
              path: /health
              port: http
          readinessProbe:
            httpGet:
              path: /health
              port: http
          volumeMounts:
            - mountPath: /config
              name: config
        - name: configmap-reload
          image: "jimmidyson/configmap-reload:v0.2.2"
          imagePullPolicy: "IfNotPresent"
          securityContext:
            runAsNonRoot: true
            runAsUser: 65534
          args:
            - --volume-dir=/etc/config
            - --webhook-url=http://localhost:9115/-/reload
          resources:
            {}
          volumeMounts:
            - mountPath: /etc/config
              name: config
              readOnly: true
      volumes:
        - name: config
          configMap:
            name: prometheus-blackbox-exporter
Blackbox exporter može se implementirati sljedećom naredbom. Imenski prostor monitoring odnosi se na Prometheus Operator.
kubectl --namespace=monitoring apply -f blackbox-exporter.yamlProvjerite jesu li sve usluge pokrenute pomoću sljedeće naredbe:
kubectl --namespace=monitoring get all --selector=app=prometheus-blackbox-exporterProvjera Blackboxa
Možete pristupiti web sučelju Blackbox eksportera putem port-forward:
kubectl --namespace=monitoring port-forward svc/prometheus-blackbox-exporter 9115:9115Priključite se na web sučelje Blackbox eksportera putem web preglednika na adresi :9115.
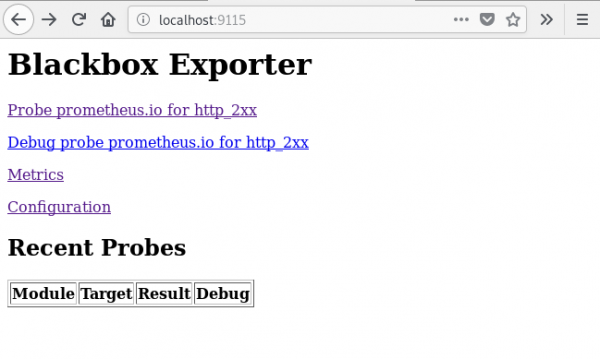
Ako odete na adresu , vidjet ćete rezultat provjere navedenog URL-a ().
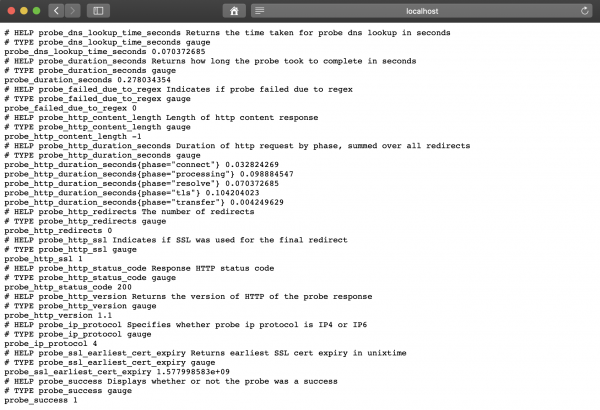
Vrijednost metrike probe_success jednaka 1 znači uspješnu provjeru. Vrijednost 0 označava grešku.
Postavke Prometheusa
Nakon implementacije BlackBox eksportera, konfiguriramo Prometheus u prometheus-additional.yaml.
- job_name: 'kube-api-blackbox'
  scrape_interval: 1w
  metrics_path: /probe
  params:
    module: [http_2xx]
  static_configs:
   - targets:
      - https://www.google.com
      - http://www.example.com
      - https://prometheus.io
  relabel_configs:
   - source_labels: [__address__]
     target_label: __param_target
   - source_labels: [__param_target]
     target_label: instance
   - target_label: __address__
     replacement: prometheus-blackbox-exporter:9115 # Blackbox exporter.
Generiramo Tajna, koristeći sljedeću naredbu.
PROMETHEUS_ADD_CONFIG=$(cat prometheus-additional.yaml | base64)
cat << EOF | kubectl --namespace=monitoring apply -f -
apiVersion: v1
kind: Secret
metadata:
  name: additional-scrape-configs
type: Opaque
data:
  prometheus-additional.yaml: $PROMETHEUS_ADD_CONFIG
EOF
Unesite additional-scrape-configs za Prometheus Operator, koristeći additionalScrapeConfigs.
kubectl --namespace=monitoring edit prometheuses k8s
...
spec:
  additionalScrapeConfigs:
    key: prometheus-additional.yaml
    name: additional-scrape-configs
Ulazimo u web sučelje Prometheusa, provjeravamo metrike i ciljeve.
kubectl --namespace=monitoring port-forward svc/prometheus-k8s 9090:9090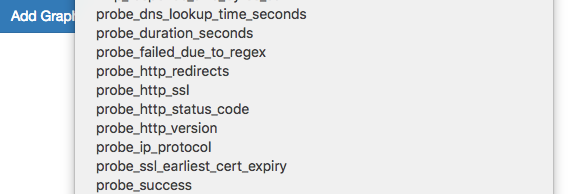
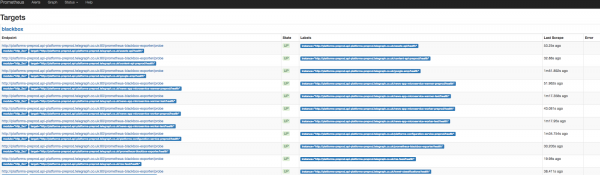
Vidimo metrike i ciljeve Blackboxa.
Dodavanje pravila za obavijesti (alert)
Za primanje obavijesti od Blackbox eksportera dodajemo pravila u Prometheus Operator.
kubectl --namespace=monitoring edit prometheusrules prometheus-k8s-rules
...
  - name: blackbox-exporter
    rules:
    - alert: ProbeFailed
      expr: probe_success == 0
      for: 5m
      labels:
        severity: error
      annotations:
        summary: "Probe failed (instance {{ $labels.instance }})"
        description: "Probe failedn  VALUE = {{ $value }}n  LABELS: {{ $labels }}"
    - alert: SlowProbe
      expr: avg_over_time(probe_duration_seconds[1m]) > 1
      for: 5m
      labels:
        severity: warning
      annotations:
        summary: "Slow probe (instance {{ $labels.instance }})"
        description: "Blackbox probe took more than 1s to completen  VALUE = {{ $value }}n  LABELS: {{ $labels }}"
    - alert: HttpStatusCode
      expr: probe_http_status_code = 400
      for: 5m
      labels:
        severity: error
      annotations:
        summary: "HTTP Status Code (instance {{ $labels.instance }})"
        description: "HTTP status code is not 200-399n  VALUE = {{ $value }}n  LABELS: {{ $labels }}"
    - alert: SslCertificateWillExpireSoon
      expr: probe_ssl_earliest_cert_expiry - time() < 86400 * 30
      for: 5m
      labels:
        severity: warning
      annotations:
        summary: "SSL certificate will expire soon (instance {{ $labels.instance }})"
        description: "SSL certificate expires in 30 daysn  VALUE = {{ $value }}n  LABELS: {{ $labels }}"
    - alert: SslCertificateHasExpired
      expr: probe_ssl_earliest_cert_expiry - time()   1
      for: 5m
      labels:
        severity: warning
      annotations:
        summary: "HTTP slow requests (instance {{ $labels.instance }})"
        description: "HTTP request took more than 1sn  VALUE = {{ $value }}n  LABELS: {{ $labels }}"
    - alert: SlowPing
      expr: avg_over_time(probe_icmp_duration_seconds[1m]) > 1
      for: 5m
      labels:
        severity: warning
      annotations:
        summary: "Slow ping (instance {{ $labels.instance }})"
        description: "Blackbox ping took more than 1sn  VALUE = {{ $value }}n  LABELS: {{ $labels }}"
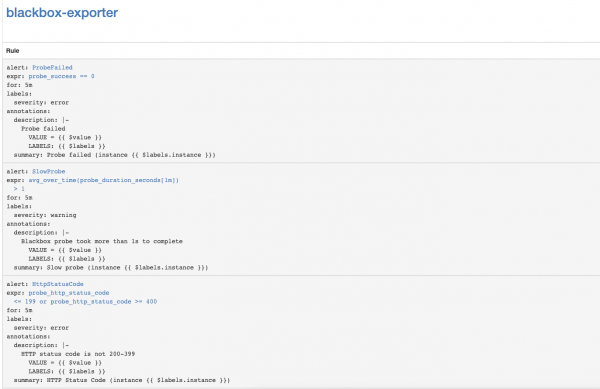
U promjenjivom sučelju Prometheusa pređite na Status => Pravila i pronađite pravila obavijesti za blackbox-exporter.
Postavljanje obavijesti o isteku SSL certifikata za Kubernetes API Server.
Postavimo nadzor isteka SSL certifikata za Kubernetes API Server. On će slati obavijesti jednom tjedno.
Dodajemo modul Blackbox eksportera za autentifikaciju Kubernetes API Servera.
kubectl --namespace=monitoring edit configmap prometheus-blackbox-exporter
...
      kube-api:
        http:
          method: GET
          no_follow_redirects: false
          preferred_ip_protocol: ip4
          tls_config:
            insecure_skip_verify: false
            ca_file: /var/run/secrets/kubernetes.io/serviceaccount/ca.crt
          bearer_token_file: /var/run/secrets/kubernetes.io/serviceaccount/token
          valid_http_versions:
          - HTTP/1.1
          - HTTP/2
          valid_status_codes: []
        prober: http
        timeout: 5s
Dodajemo scrape konfiguraciju za Prometheus
- job_name: 'kube-api-blackbox'
  metrics_path: /probe
  params:
    module: [kube-api]
  static_configs:
   - targets:
      - https://kubernetes.default.svc/api
  relabel_configs:
   - source_labels: [__address__]
     target_label: __param_target
   - source_labels: [__param_target]
     target_label: instance
   - target_label: __address__
     replacement: prometheus-blackbox-exporter:9115 # The blackbox exporter.
Primjena Prometheus Secret
PROMETHEUS_ADD_CONFIG=$(cat prometheus-additional.yaml | base64)
cat << EOF | kubectl --namespace=monitoring apply -f -
apiVersion: v1
kind: Secret
metadata:
  name: additional-scrape-configs
type: Opaque
data:
  prometheus-additional.yaml: $PROMETHEUS_ADD_CONFIG
EOF
Dodavanje pravila obavijesti
kubectl --namespace=monitoring edit prometheusrules prometheus-k8s-rules
...
  - name: k8s-api-server-cert-expiry
    rules:
    - alert: K8sAPIServerSSLCertExpiringAfterThreeMonths
      expr: probe_ssl_earliest_cert_expiry{job="kube-api-blackbox"} - time() < 86400 * 90
      for: 1w
      labels:
        severity: warning
      annotations:
        summary: "SSL certifikat Kubernetes API poslužitelja će isteći za tri mjeseca (instanca {{ $labels.instance }})"
        description: "SSL certifikat Kubernetes API poslužitelja istječe za 90 danan  VALUE = {{ $value }}n  LABELS: {{ $labels }}"
Koristitne veze
Izvor: habr.com
