

O semplicemente un po' di tetris applicato.
Tutto il nuovo è bene che sia dimenticato.
Epigrafi.

Definizione del compito
È necessario caricare periodicamente il file di log attuale di PostgreSQL dal cloud AWS su un host Linux locale. Non in tempo reale, ma, diciamo, con un leggero ritardo.
Il periodo di caricamento del file di log è di 5 minuti.
Il file di log, in AWS, ruota ogni ora.
Strumenti utilizzati
Per caricare il file di log sull'host, si utilizza uno script bash che chiama l'API AWS "».
Parametri:
- —db-instance-identifier: Nome dell'istanza in AWS;
- —log-file-name: nome del file di log attuale generato
- —max-item: Numero totale di elementi restituiti nei dati di output del comando.Dimensione della porzione del file che viene caricata.
- —starting-token: Token della porzione iniziale
In questo caso specifico, il compito di caricare i log è emerso durante il lavoro su
E semplicemente — è un compito interessante, per allenamenti e varietà durante il lavoro.
Suppongo che il compito, per ovvietà, sia già stato risolto. Ma una rapida ricerca su Google non ha fornito soluzioni, e cercare in modo più approfondito non era desiderato. In ogni caso, è un buon allenamento.
Formalizzazione del compito
Il file di log finale è composto da molte righe di lunghezza variabile. Graficalmente, il file di log può essere rappresentato, più o meno così:

Già qualcosa che ricorda? Cosa c'entra il "tetris"? Ecco perché.
Se si rappresentano graficamente le possibili combinazioni che emergono durante il caricamento di un file, (per semplicità, in questo caso, supponiamo che le righe abbiano tutte la stessa lunghezza), si ottengono le figure standard del tetris:
1) Il file è stato caricato completamente ed è finale. La dimensione della porzione è maggiore della dimensione del file finale:

2) Il file ha un seguito. La dimensione della porzione è minore della dimensione del file finale:

3) Il file è un seguito del file precedente e ha un seguito. La dimensione della porzione è minore della dimensione del resto del file finale:

4) Il file è un seguito del file precedente ed è finale. La dimensione della porzione è maggiore della dimensione del resto del file finale:

Il compito è raccogliere un rettangolo o giocare a tetris, a un nuovo livello.

Problemi che sorgono durante la risoluzione del compito
1) Unire le righe da 2 porzioni
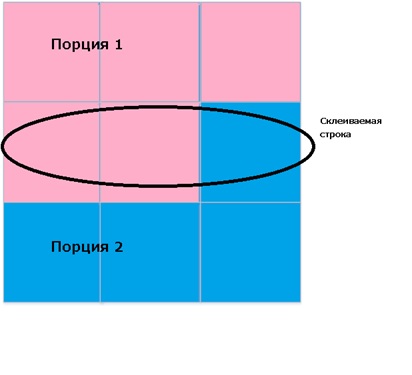
In linea di massima non ci sono stati problemi particolari. Compito standard del corso di programmazione introduttivo.
Dimensione ottimale della porzione
Ecco che questo è, leggermente più interessante.
Sfortunatamente, non è possibile utilizzare l'offset dopo il token di partenza:
Come già sapete, l'opzione —starting-token è utilizzata per specificare da dove iniziare a paginare. Questa opzione accetta valori di tipo String che significano che se provate ad aggiungere un valore di offset davanti alla stringa del Next Token, l'opzione non verrà presa in considerazione come un offset.
E quindi, è necessario leggere a pezzi.
Se si legge in grandi porzioni, il numero di letture sarà minimo, ma il volume sarà massimo.
Se si legge in piccole porzioni, al contrario, il numero di letture sarà massimo, ma il volume sarà minimo.
Pertanto, per ridurre il traffico e per la bellezza generale della soluzione, è stato necessario ideare una soluzione che, sfortunatamente, somiglia un po' a un ripiego.
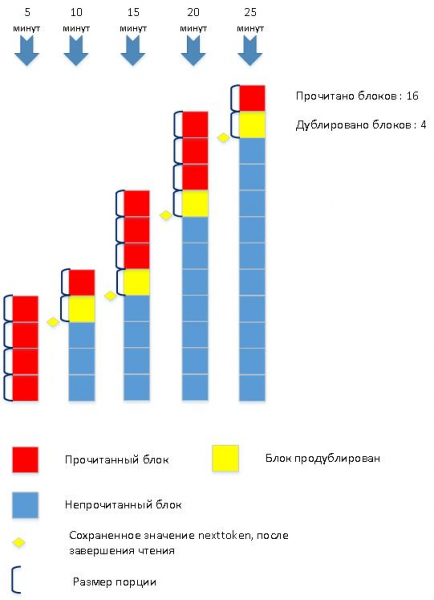
Per illustrare, consideriamo il processo di caricamento di un file di log in 2 varianti notevolmente semplificate. Il numero di letture in entrambi i casi dipende dalle dimensioni della porzione.
1) Carichiamo in piccole porzioni:
2) Carichiamo in grandi porzioni:
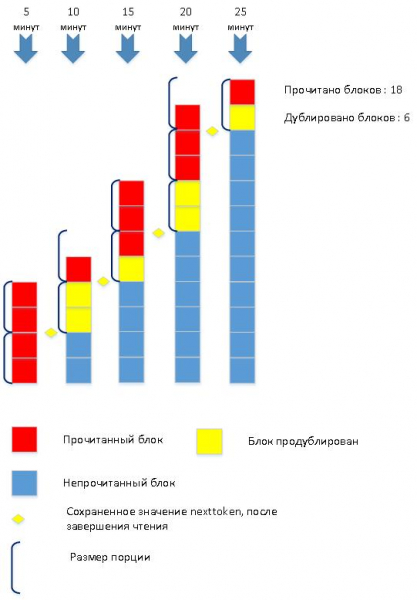
Come al solito, la soluzione ottimale è nel mezzo.
Le dimensioni della porzione sono minime, ma durante la lettura, le dimensioni possono essere aumentate, per ridurre il numero di letture.
Va notato che la questione della selezione delle dimensioni ottimali della porzione letta non è ancora risolta e richiede un'elaborazione e un'analisi più approfondite. Forse più tardi.
Descrizione generale dell'implementazione
Tabelle di servizio utilizzate
CREATE TABLE endpoint
(
id SERIAL ,
host text
);

TABLE database
(
id SERIAL ,
…
last_aws_log_time text ,
last_aws_nexttoken text ,
aws_max_item_size integer
);
last_aws_log_time — timestamp dell'ultimo file di log caricato nel formato YYYY-MM-DD-HH24.
last_aws_nexttoken — etichetta testuale dell'ultima porzione caricata.
aws_max_item_size - dimensione iniziale della porzione determinata empiricamente.
Testo completo dello script
download_aws_piece.sh
#!/bin/bash
#########################################################
# download_aws_piece.sh
# downloan piece of log from AWS
# version HABR
 let min_item_size=1024
 let max_item_size=1048576
 let growth_factor=3
 let growth_counter=1
 let growth_counter_max=3

 echo $(date +%Y%m%d%H%M)':    download_aws_piece.sh:''STARTED'

 AWS_LOG_TIME=$1
 echo $(date +%Y%m%d%H%M)':    download_aws_piece.sh:AWS_LOG_TIME='$AWS_LOG_TIME

 database_id=$2
 echo $(date +%Y%m%d%H%M)':    download_aws_piece.sh:database_id='$database_id
 RESULT_FILE=$3

 endpoint=`psql -h MONITOR_ENDPOINT.rds.amazonaws.com -U USER -d MONITOR_DATABASE_DATABASE -A -t -c "select e.host from endpoint e join database d on e.id = d.endpoint_id where d.id = $database_id "`
 echo $(date +%Y%m%d%H%M)':    download_aws_piece.sh:endpoint='$endpoint

 db_instance=`echo $endpoint | awk -F"." '{print toupper($1)}'`

 echo $(date +%Y%m%d%H%M)':    download_aws_piece.sh:db_instance='$db_instance

 LOG_FILE=$RESULT_FILE'.tmp_log'
 TMP_FILE=$LOG_FILE'.tmp'
 TMP_MIDDLE=$LOG_FILE'.tmp_mid'
 TMP_MIDDLE2=$LOG_FILE'.tmp_mid2'

 current_aws_log_time=`psql -h MONITOR_ENDPOINT.rds.amazonaws.com -U USER -d MONITOR_DATABASE -A -t -c "select last_aws_log_time from database where id = $database_id "`

 echo $(date +%Y%m%d%H%M)':      download_aws_piece.sh:current_aws_log_time='$current_aws_log_time

  if [[ $current_aws_log_time != $AWS_LOG_TIME  ]];
  then
    is_new_log='1'
	if ! psql -h MONITOR_ENDPOINT.rds.amazonaws.com -U USER -d MONITOR_DATABASE -v ON_ERROR_STOP=1 -A -t -q -c "update database set last_aws_log_time = '$AWS_LOG_TIME' where id = $database_id "
	then
	  echo $(date +%Y%m%d%H%M)':    download_aws_piece.sh: FATAL_ERROR - update database set last_aws_log_time .'
	  exit 1
	fi
  else
    is_new_log='0'
  fi

  echo $(date +%Y%m%d%H%M)':    download_aws_piece.sh:is_new_log='$is_new_log

  let last_aws_max_item_size=`psql -h MONITOR_ENDPOINT.rds.amazonaws.com -U USER -d MONITOR_DATABASE -A -t -c "select aws_max_item_size from database where id = $database_id "`
  echo $(date +%Y%m%d%H%M)':    download_aws_piece.sh: last_aws_max_item_size='$last_aws_max_item_size

  let count=1
  if [[ $is_new_log == '1' ]];
  then
	echo $(date +%Y%m%d%H%M)':    download_aws_piece.sh: START DOWNLOADING OF NEW AWS LOG'
	if ! aws rds download-db-log-file-portion
		--max-items $last_aws_max_item_size
		--region REGION
		--db-instance-identifier  $db_instance
		--log-file-name error/postgresql.log.$AWS_LOG_TIME > $LOG_FILE
	then
		echo $(date +%Y%m%d%H%M)':    download_aws_piece.sh: FATAL_ERROR - Could not get log from AWS .'
		exit 2
	fi
  else
    next_token=`psql -h MONITOR_ENDPOINT.rds.amazonaws.com -U USER -d MONITOR_DATABASE -v ON_ERROR_STOP=1 -A -t -c "select last_aws_nexttoken from database where id = $database_id "`

	if [[ $next_token == '' ]];
	then
	  next_token='0'
	fi

	echo $(date +%Y%m%d%H%M)':    download_aws_piece.sh: CONTINUE DOWNLOADING OF AWS LOG'
	if ! aws rds download-db-log-file-portion
	    --max-items $last_aws_max_item_size
		--starting-token $next_token
		--region REGION
		--db-instance-identifier  $db_instance
		--log-file-name error/postgresql.log.$AWS_LOG_TIME > $LOG_FILE
	then
		echo $(date +%Y%m%d%H%M)':    download_aws_piece.sh: FATAL_ERROR - Could not get log from AWS .'
		exit 3
	fi

	line_count=`cat  $LOG_FILE | wc -l`
	let lines=$line_count-1

	tail -$lines $LOG_FILE > $TMP_MIDDLE
	mv -f $TMP_MIDDLE $LOG_FILE
  fi

  next_token_str=`cat $LOG_FILE | grep NEXTTOKEN`
  next_token=`echo $next_token_str | awk -F" " '{ print $2}' `

  grep -v NEXTTOKEN $LOG_FILE  > $TMP_FILE

  if [[ $next_token == '' ]];
  then
	  cp $TMP_FILE $RESULT_FILE

	  echo $(date +%Y%m%d%H%M)':    download_aws_piece.sh:  NEXTTOKEN NOT FOUND - FINISH '
	  rm $LOG_FILE
	  rm $TMP_FILE
	  rm $TMP_MIDDLE
          rm $TMP_MIDDLE2
	  exit 0
  else
	psql -h MONITOR_ENDPOINT.rds.amazonaws.com -U USER -d MONITOR_DATABASE -v ON_ERROR_STOP=1 -A -t -q -c "update database set last_aws_nexttoken = '$next_token' where id = $database_id "
  fi

  first_str=`tail -1 $TMP_FILE`

  line_count=`cat  $TMP_FILE | wc -l`
  let lines=$line_count-1

  head -$lines $TMP_FILE  > $RESULT_FILE

###############################################
# MAIN CIRCLE
  let count=2
  while [[ $next_token != '' ]];
  do
    echo $(date +%Y%m%d%H%M)':    download_aws_piece.sh: count='$count

	echo $(date +%Y%m%d%H%M)':    download_aws_piece.sh: START DOWNLOADING OF AWS LOG'
	if ! aws rds download-db-log-file-portion
             --max-items $last_aws_max_item_size
             --starting-token $next_token
             --region REGION
             --db-instance-identifier  $db_instance
             --log-file-name error/postgresql.log.$AWS_LOG_TIME > $LOG_FILE
	then
		echo $(date +%Y%m%d%H%M)':    download_aws_piece.sh: FATAL_ERROR - Could not get log from AWS .'
		exit 4
	fi

	next_token_str=`cat $LOG_FILE | grep NEXTTOKEN`
	next_token=`echo $next_token_str | awk -F" " '{ print $2}' `

	TMP_FILE=$LOG_FILE'.tmp'
	grep -v NEXTTOKEN $LOG_FILE  > $TMP_FILE

	last_str=`head -1 $TMP_FILE`

    if [[ $next_token == '' ]];
	then
	  concat_str=$first_str$last_str

	  echo $concat_str >> $RESULT_FILE

	  line_count=`cat  $TMP_FILE | wc -l`
	  let lines=$line_count-1

	  tail -$lines $TMP_FILE >> $RESULT_FILE

	  echo $(date +%Y%m%d%H%M)':    download_aws_piece.sh:  NEXTTOKEN NOT FOUND - FINISH '
	  rm $LOG_FILE
	  rm $TMP_FILE
	  rm $TMP_MIDDLE
          rm $TMP_MIDDLE2
	  exit 0
	fi

    if [[ $next_token != '' ]];
	then
		let growth_counter=$growth_counter+1
		if [[ $growth_counter -gt $growth_counter_max ]];
		then
			let last_aws_max_item_size=$last_aws_max_item_size*$growth_factor
			let growth_counter=1
		fi

		if [[ $last_aws_max_item_size -gt $max_item_size ]];
		then
			let last_aws_max_item_size=$max_item_size
		fi

	  psql -h MONITOR_ENDPOINT.rds.amazonaws.com -U USER -d MONITOR_DATABASE -A -t -q -c "update database set last_aws_nexttoken = '$next_token' where id = $database_id "

	  concat_str=$first_str$last_str

	  echo $concat_str >> $RESULT_FILE

	  line_count=`cat  $TMP_FILE | wc -l`
	  let lines=$line_count-1

	  #############################
	  #Get middle of file
	  head -$lines $TMP_FILE > $TMP_MIDDLE

	  line_count=`cat  $TMP_MIDDLE | wc -l`
	  let lines=$line_count-1
	  tail -$lines $TMP_MIDDLE > $TMP_MIDDLE2

	  cat $TMP_MIDDLE2 >> $RESULT_FILE

	  first_str=`tail -1 $TMP_FILE`
	fi

    let count=$count+1

  done
#
#################################################################

exit 0
Fragmenti dello script con alcune spiegazioni:
Parametri di ingresso dello script:
- Timestamp del nome del file di log nel formato YYYY-MM-DD-HH24: AWS_LOG_TIME=$1
- ID Database: database_id=$2
- Nome del file di log raccolto: RESULT_FILE=$3
Ottenere il timestamp dell'ultimo file di log caricato:
current_aws_log_time=`psql -h MONITOR_ENDPOINT.rds.amazonaws.com -U USER -d MONITOR_DATABASE -A -t -c "select last_aws_log_time from database where id = $database_id "`Se il timestamp dell'ultimo file di log caricato non corrisponde al parametro di ingresso, viene caricato un nuovo file di log:
se [[ $current_aws_log_time != $AWS_LOG_TIME  ]];
  allora
    is_new_log='1'
	se ! psql -h ENDPOINT.rds.amazonaws.com -U USER -d MONITOR_DATABASE -v ON_ERROR_STOP=1 -A -t -c "update database set last_aws_log_time = '$AWS_LOG_TIME' where id = $database_id "
	allora
	  echo '***download_aws_piece.sh -ERRORE_FATALE - update database set last_aws_log_time .'
	  exit 1
	fi
  altrimenti
    is_new_log='0'
  fi
Otteniamo il valore dell'etichetta nexttoken dal file caricato:
  next_token_str=`cat $LOG_FILE | grep NEXTTOKEN`
  next_token=`echo $next_token_str | awk -F" " '{ print $2}' `
Un valore vuoto di nexttoken indica la fine del caricamento.
Nel ciclo consideriamo le porzioni del file, concatenando nel frattempo le righe e aumentando la dimensione della porzione:
Ciclo principale
# MAIN CIRCLE
  let count=2
  while [[ $next_token != '' ]];
  do
    echo $(date +%Y%m%d%H%M)':    download_aws_piece.sh: count='$count

	echo $(date +%Y%m%d%H%M)':    download_aws_piece.sh: START DOWNLOADING OF AWS LOG'
	if ! aws rds download-db-log-file-portion
     --max-items $last_aws_max_item_size
	 --starting-token $next_token
     --region REGION
     --db-instance-identifier  $db_instance
     --log-file-name error/postgresql.log.$AWS_LOG_TIME > $LOG_FILE
	then
		echo $(date +%Y%m%d%H%M)':    download_aws_piece.sh: FATAL_ERROR - Could not get log from AWS .'
		exit 4
	fi

	next_token_str=`cat $LOG_FILE | grep NEXTTOKEN`
	next_token=`echo $next_token_str | awk -F" " '{ print $2}' `

	TMP_FILE=$LOG_FILE'.tmp'
	grep -v NEXTTOKEN $LOG_FILE  > $TMP_FILE

	last_str=`head -1 $TMP_FILE`

    if [[ $next_token == '' ]];
	then
	  concat_str=$first_str$last_str

	  echo $concat_str >> $RESULT_FILE

	  line_count=`cat  $TMP_FILE | wc -l`
	  let lines=$line_count-1

	  tail -$lines $TMP_FILE >> $RESULT_FILE

	  echo $(date +%Y%m%d%H%M)':    download_aws_piece.sh:  NEXTTOKEN NOT FOUND - FINISH '
	  rm $LOG_FILE
	  rm $TMP_FILE
	  rm $TMP_MIDDLE
         rm $TMP_MIDDLE2
	  exit 0
	fi

    if [[ $next_token != '' ]];
	then
		let growth_counter=$growth_counter+1
		if [[ $growth_counter -gt $growth_counter_max ]];
		then
			let last_aws_max_item_size=$last_aws_max_item_size*$growth_factor
			let growth_counter=1
		fi

		if [[ $last_aws_max_item_size -gt $max_item_size ]];
		then
			let last_aws_max_item_size=$max_item_size
		fi

	  psql -h MONITOR_ENDPOINT.rds.amazonaws.com -U USER -d MONITOR_DATABASE -A -t -q -c "update database set last_aws_nexttoken = '$next_token' where id = $database_id "

	  concat_str=$first_str$last_str

	  echo $concat_str >> $RESULT_FILE

	  line_count=`cat  $TMP_FILE | wc -l`
	  let lines=$line_count-1

	  #############################
	  #Get middle of file
	  head -$lines $TMP_FILE > $TMP_MIDDLE

	  line_count=`cat  $TMP_MIDDLE | wc -l`
	  let lines=$line_count-1
	  tail -$lines $TMP_MIDDLE > $TMP_MIDDLE2

	  cat $TMP_MIDDLE2 >> $RESULT_FILE

	  first_str=`tail -1 $TMP_FILE`
	fi

    let count=$count+1

  done
E poi?
Quindi, il primo compito intermedio - «caricare il log dal cloud» è stato risolto. Cosa fare con il log caricato?
Per cominciare, è necessario analizzare il file di log ed estrarre le query.
Il compito non è molto complesso. Un semplice bash-script è più che sufficiente.
upload_log_query.sh
#!/bin/bash
#########################################################
# upload_log_query.sh
# Upload table table from dowloaded aws file
# version HABR
###########################################################
echo 'TIMESTAMP:'$(date +%c)' Upload log_query table '
source_file=$1
echo 'source_file='$source_file
database_id=$2
echo 'database_id='$database_id

beginer=' '
first_line='1'
let "line_count=0"
sql_line=' '
sql_flag=' '
space=' '
cat $source_file | while read line
do
  line="$space$line"

  if [[ $first_line == "1" ]]; then
    beginer=`echo $line | awk -F" " '{ print $1}' `
    first_line='0'
  fi

  current_beginer=`echo $line | awk -F" " '{ print $1}' `

  if [[ $current_beginer == $beginer ]]; then
    if [[ $sql_flag == '1' ]]; then
     sql_flag='0'
     log_date=`echo $sql_line | awk -F" " '{ print $1}' `
     log_time=`echo $sql_line | awk -F" " '{ print $2}' `
     duration=`echo $sql_line | awk -F" " '{ print $5}' `

     #replace ' to ''
     sql_modline=`echo "$sql_line" | sed 's/'''/''''''/g'`
     sql_line=' '

	 ################
	 #PROCESSING OF THE SQL-SELECT IS HERE
     if ! psql -h ENDPOINT.rds.amazonaws.com -U USER -d DATABASE -v ON_ERROR_STOP=1 -A -t -c "select log_query('$ip_port',$database_id , '$log_date' , '$log_time' , '$duration' , '$sql_modline' )"
     then
        echo 'FATAL_ERROR - log_query '
        exit 1
     fi
	 ################

    fi #if [[ $sql_flag == '1' ]]; then

    let "line_count=line_count+1"

    check=`echo $line | awk -F" " '{ print $8}' `
    check_sql=${check^^}

    #echo 'check_sql='$check_sql

    if [[ $check_sql == 'SELECT' ]]; then
     sql_flag='1'
     sql_line="$sql_line$line"
	 ip_port=`echo $sql_line | awk -F":" '{ print $4}' `
    fi
  else

    if [[ $sql_flag == '1' ]]; then
      sql_line="$sql_line$line"
    fi

  fi #if [[ $current_beginer == $beginer ]]; then

done
Ora con la query estratta dal file di log, è possibile lavorare.
E si aprono diverse opportunità utili.
Le query estratte devono essere memorizzate da qualche parte. A tal fine, si utilizza una tabella di servizio log_query
CREATE TABLE log_query
(
   id SERIAL ,
   queryid bigint ,
   query_md5hash text not null ,
   database_id integer not null ,
   timepoint timestamp without time zone not null,
   duration double precision not null ,
   query text not null ,
   explained_plan text[],
   plan_md5hash text  ,
   explained_plan_wo_costs text[],
   plan_hash_value text  ,
   baseline_id integer ,
   ip text ,
   port text
);
ALTER TABLE log_query ADD PRIMARY KEY (id);
ALTER TABLE log_query ADD CONSTRAINT queryid_timepoint_unique_key UNIQUE (queryid, timepoint );
ALTER TABLE log_query ADD CONSTRAINT query_md5hash_timepoint_unique_key UNIQUE (query_md5hash, timepoint );

CREATE INDEX log_query_timepoint_idx ON log_query (timepoint);
CREATE INDEX log_query_queryid_idx ON log_query (queryid);
ALTER TABLE log_query ADD CONSTRAINT database_id_fk FOREIGN KEY (database_id) REFERENCES database (id) ON DELETE CASCADE ;
L'elaborazione della query analizzata avviene in plpgsql funzione «log_query».
log_query.sql
--log_query.sql
--version HABR
CREATE OR REPLACE FUNCTION log_query( ip_port text ,log_database_id integer , log_date text , log_time text , duration text , sql_line text ) RETURNS boolean AS $$
DECLARE
  result boolean ;
  log_timepoint timestamp without time zone ;
  log_duration double precision ;
  pos integer ;
  log_query text ;
  activity_string text ;
  log_md5hash text ;
  log_explain_plan text[] ;

  log_planhash text ;
  log_plan_wo_costs text[] ;

  database_rec record ;

  pg_stat_query text ;
  test_log_query text ;
  log_query_rec record;
  found_flag boolean;

  pg_stat_history_rec record ;
  port_start integer ;
  port_end integer ;
  client_ip text ;
  client_port text ;
  log_queryid bigint ;
  log_query_text text ;
  pg_stat_query_text text ;
BEGIN
  result = TRUE ;

  RAISE NOTICE '***log_query';

  port_start = position('(' in ip_port);
  port_end = position(')' in ip_port);
  client_ip = substring( ip_port from 1 for port_start-1 );
  client_port = substring( ip_port from port_start+1 for port_end-port_start-1 );

  SELECT e.host , d.name , d.owner_pwd
  INTO database_rec
  FROM database d JOIN endpoint e ON e.id = d.endpoint_id
  WHERE d.id = log_database_id ;

  log_timepoint = to_timestamp(log_date||' '||log_time,'YYYY-MM-DD HH24-MI-SS');
  log_duration = duration:: double precision;


  pos = position ('SELECT' in UPPER(sql_line) );
  log_query = substring( sql_line from pos for LENGTH(sql_line));
  log_query = regexp_replace(log_query,' +',' ','g');
  log_query = regexp_replace(log_query,';+','','g');
  log_query = trim(trailing ' ' from log_query);


  log_md5hash = md5( log_query::text );

  --Spiegare il piano di esecuzione--
  EXECUTE 'SELECT dblink_connect(''LINK1'',''host='||database_rec.host||' dbname='||database_rec.name||' user=DATABASE password='||database_rec.owner_pwd||' '')';

  log_explain_plan = ARRAY ( SELECT * FROM dblink('LINK1', 'EXPLAIN '||log_query ) AS t (plan text) );
  log_plan_wo_costs = ARRAY ( SELECT * FROM dblink('LINK1', 'EXPLAIN ( COSTS FALSE ) '||log_query ) AS t (plan text) );

  PERFORM dblink_disconnect('LINK1');
  --------------------------
  BEGIN
	INSERT INTO log_query
	(
		query_md5hash ,
		database_id ,
		timepoint ,
		duration ,
		query ,
		explained_plan ,
		plan_md5hash ,
		explained_plan_wo_costs ,
		plan_hash_value ,
		ip ,
		port
	)
	VALUES
	(
		log_md5hash ,
		log_database_id ,
		log_timepoint ,
		log_duration ,
		log_query ,
		log_explain_plan ,
		md5(log_explain_plan::text) ,
		log_plan_wo_costs ,
		md5(log_plan_wo_costs::text),
		client_ip ,
		client_port
	);
	activity_string = 	'Nuova query registrata '||
						' database_id = '|| log_database_id ||
						' query_md5hash='||log_md5hash||
						' , timepoint = '||to_char(log_timepoint,'YYYYMMDD HH24:MI:SS');

	RAISE NOTICE '%',activity_string;

	PERFORM pg_log( log_database_id , 'log_query' , activity_string);

	EXCEPTION
	  WHEN unique_violation THEN
		RAISE NOTICE '*** unique_violation *** la query è già stata registrata';
	END;

	SELECT 	queryid
	INTO   	log_queryid
	FROM 	log_query
	WHERE 	query_md5hash = log_md5hash AND
			timepoint = log_timepoint;

	IF log_queryid IS NOT NULL
	THEN
	  RAISE NOTICE 'log_query con query_md5hash = % e timepoint = % ha già QUERYID = %',log_md5hash,log_timepoint , log_queryid ;
	  RETURN result;
	END IF;

	------------------------------------------------
	RAISE NOTICE 'Aggiorna queryid';

	SELECT *
	INTO log_query_rec
	FROM log_query
	WHERE query_md5hash = log_md5hash AND timepoint = log_timepoint ;

	log_query_rec.query=regexp_replace(log_query_rec.query,';+','','g');

	FOR pg_stat_history_rec IN
	 SELECT
         queryid ,
	  query
	 FROM
         pg_stat_db_queries
     WHERE
      database_id = log_database_id AND
       queryid is not null
	LOOP
	  pg_stat_query = pg_stat_history_rec.query ;
	  pg_stat_query=regexp_replace(pg_stat_query,'n+',' ','g');
	  pg_stat_query=regexp_replace(pg_stat_query,'t+',' ','g');
	  pg_stat_query=regexp_replace(pg_stat_query,' +',' ','g');
	  pg_stat_query=regexp_replace(pg_stat_query,'$.','%','g');

	  log_query_text = trim(trailing ' ' from log_query_rec.query);
	  pg_stat_query_text = pg_stat_query;


	  --SELECT log_query_rec.query like pg_stat_query INTO found_flag ;
	  IF (log_query_text LIKE pg_stat_query_text) THEN
		found_flag = TRUE ;
	  ELSE
		found_flag = FALSE ;
	  END IF;


	  IF found_flag THEN

		UPDATE log_query SET queryid = pg_stat_history_rec.queryid WHERE query_md5hash = log_md5hash AND timepoint = log_timepoint ;
		activity_string = 	' queryid aggiornato = '||pg_stat_history_rec.queryid||
		                    ' per log_query con id = '||log_query_rec.id
		   				    ;
	    RAISE NOTICE '%',activity_string;
		EXIT ;
	  END IF ;

	END LOOP ;

  RETURN result ;
END
$$ LANGUAGE plpgsql;
Durante l'elaborazione viene utilizzata una tabella di servizio pg_stat_db_queries, contenente un'istantanea delle query correnti dalla tabella pg_stat_history (L'uso della tabella è descritto qui — )
TABLE pg_stat_db_queries
(
   database_id integer,
   queryid bigint ,
   query text ,
   max_time double precision
);
TABLE pg_stat_history
(
…
database_id integer ,
…
queryid bigint ,
…
max_time double precision	 ,
…
);
La funzione consente di implementare una serie di funzionalità utili per l'elaborazione delle query dal file di log. In particolare:
Possibilità n. 1 — Storia dell'esecuzione delle query
Molto utile per iniziare a risolvere un incidente di prestazioni. Iniziare a esaminare la storia — e quando è iniziato il rallentamento?
Poi, come da tradizione, cercare cause esterne. Potrebbe essere semplicemente aumentato improvvisamente il carico del database e una specifica query non ha nulla a che fare.
Aggiungi una nuova registrazione nella tabella log_query
  port_start = position('(' in ip_port);
  port_end = position(')' in ip_port);
  client_ip = substring( ip_port from 1 for port_start-1 );
  client_port = substring( ip_port from port_start+1 for port_end-port_start-1 );

  SELECT e.host , d.name , d.owner_pwd
  INTO database_rec
  FROM database d JOIN endpoint e ON e.id = d.endpoint_id
  WHERE d.id = log_database_id ;

  log_timepoint = to_timestamp(log_date||' '||log_time,'YYYY-MM-DD HH24-MI-SS');
  log_duration = to_number(duration,'99999999999999999999D9999999999');


  pos = position ('SELECT' in UPPER(sql_line) );
  log_query = substring( sql_line from pos for LENGTH(sql_line));
  log_query = regexp_replace(log_query,' +',' ','g');
  log_query = regexp_replace(log_query,';+','','g');
  log_query = trim(trailing ' ' from log_query);

  RAISE NOTICE 'log_query=%',log_query ;

  log_md5hash = md5( log_query::text );

  --Spiega il piano di esecuzione--
  EXECUTE 'SELECT dblink_connect(''LINK1'',''host='||database_rec.host||' dbname='||database_rec.name||' user=DATABASE password='||database_rec.owner_pwd||' '')';

  log_explain_plan = ARRAY ( SELECT * FROM dblink('LINK1', 'EXPLAIN '||log_query ) AS t (plan text) );
  log_plan_wo_costs = ARRAY ( SELECT * FROM dblink('LINK1', 'EXPLAIN ( COSTS FALSE ) '||log_query ) AS t (plan text) );

  PERFORM dblink_disconnect('LINK1');
  --------------------------
  BEGIN
	INSERT INTO log_query
	(
		query_md5hash ,
		database_id ,
		timepoint ,
		duration ,
		query ,
		explained_plan ,
		plan_md5hash ,
		explained_plan_wo_costs ,
		plan_hash_value ,
		ip ,
		port
	)
	VALUES
	(
		log_md5hash ,
		log_database_id ,
		log_timepoint ,
		log_duration ,
		log_query ,
		log_explain_plan ,
		md5(log_explain_plan::text) ,
		log_plan_wo_costs ,
		md5(log_plan_wo_costs::text),
		client_ip ,
		client_port
	);
Possibilità n. 2 — Conservare i piani di esecuzione delle query
A questo punto potrebbe sorgere un'obiezione-precisione-commento: «Ma ci sono già autoexplain». C'è, ma a cosa serve, se il piano di esecuzione è memorizzato nello stesso file di log e per conservarlo per un'analisi successiva sarà necessario analizzare il file di log?
Per me, invece, era necessario:
in primo luogo: memorizzare il piano di esecuzione nella tabella di servizio del database di monitoraggio;
In secondo luogo: avere la possibilità di confrontare i piani di esecuzione tra loro, in modo da vedere immediatamente che il piano di esecuzione della query è cambiato.
Esiste una query con parametri specifici di esecuzione. Ottenere e salvare il piano di esecuzione utilizzando EXPLAIN è un compito elementare.
Inoltre, utilizzando l'espressione EXPLAIN (COSTS FALSE), è possibile ottenere una struttura del piano che sarà utilizzata per ottenere il valore hash del piano, il che aiuterà nell'analisi successiva della storia delle modifiche del piano di esecuzione.
Ottenere il modello del piano di esecuzione
  --Spiega il piano di esecuzione--
  EXECUTE 'SELECT dblink_connect(''LINK1'',''host='||database_rec.host||' dbname='||database_rec.name||' user=DATABASE password='||database_rec.owner_pwd||' '')';

  log_explain_plan = ARRAY ( SELECT * FROM dblink('LINK1', 'EXPLAIN '||log_query ) AS t (plan text) );
  log_plan_wo_costs = ARRAY ( SELECT * FROM dblink('LINK1', 'EXPLAIN ( COSTS FALSE ) '||log_query ) AS t (plan text) );

  PERFORM dblink_disconnect('LINK1');
Opzione n. 3 - Utilizzo del log delle query per il monitoraggio
Poiché le metriche di prestazione sono configurate non sul testo della query, ma sul suo ID, è necessario collegare le query dal file di log alle query per le quali sono impostate le metriche di prestazione.
Almeno per avere il tempo esatto in cui si è verificato l'incidente di prestazione.
In questo modo, quando si verifica un incidente di prestazione per l'ID della query, ci sarà un riferimento alla specifica query con i valori specifici dei parametri e il tempo esatto di esecuzione e durata della query. Ottenere queste informazioni utilizzando solo la vista pg_stat_statements non è possibile.
Trovare l'ID della query e aggiornare la voce nella tabella log_query
SELECT *
	INTO log_query_rec
	FROM log_query
	WHERE query_md5hash = log_md5hash AND timepoint = log_timepoint ;

	log_query_rec.query=regexp_replace(log_query_rec.query,';+','','g');

	FOR pg_stat_history_rec IN
	 SELECT
      queryid ,
	  query
	 FROM
       pg_stat_db_queries
     WHERE
	   database_id = log_database_id AND
       queryid is not null
	LOOP
	  pg_stat_query = pg_stat_history_rec.query ;
	  pg_stat_query=regexp_replace(pg_stat_query,'n+',' ','g');
	  pg_stat_query=regexp_replace(pg_stat_query,'t+',' ','g');
	  pg_stat_query=regexp_replace(pg_stat_query,' +',' ','g');
	  pg_stat_query=regexp_replace(pg_stat_query,'$.','%','g');

	  log_query_text = trim(trailing ' ' from log_query_rec.query);
	  pg_stat_query_text = pg_stat_query;

	  --SELECT log_query_rec.query like pg_stat_query INTO found_flag ;
	  IF (log_query_text LIKE pg_stat_query_text) THEN
		found_flag = TRUE ;
	  ELSE
		found_flag = FALSE ;
	  END IF;


	  IF found_flag THEN

		UPDATE log_query SET queryid = pg_stat_history_rec.queryid WHERE query_md5hash = log_md5hash AND timepoint = log_timepoint ;
		activity_string = 	' updated queryid = '||pg_stat_history_rec.queryid||
		                    ' for log_query with id = '||log_query_rec.id
		   				    ;

	    RAISE NOTICE '%',activity_string;
		EXIT ;
	  END IF ;

	END LOOP ;
Postfazione
La metodologia descritta alla fine ha trovato applicazione in , consentendo di avere maggiori informazioni per l'analisi nella risoluzione degli incidenti di prestazioni delle richieste.
Tuttavia, a mio avviso personale, sarà necessario lavorare ancora sull'algoritmo di selezione e modifica delle dimensioni del pacchetto caricato. La questione non è ancora risolta in generale. Sarà probabilmente interessante.
Ma questa è un'altra storia …
Fonte: habr.com
