

Ciao a tutti. A maggio OTUS lancia , sia delle infrastrutture che delle applicazioni, utilizzando Zabbix, Prometheus, Grafana ed ELK. In tal senso, condividiamo tradizionalmente materiali utili sull'argomento.
per Prometheus permette di monitorare i servizi esterni tramite HTTP, HTTPS, DNS, TCP e ICMP. In questo articolo vi mostrerò come configurare il monitoraggio HTTP/HTTPS con il blackbox exporter. Avvieremo il blackbox exporter in Kubernetes.
Ambiente
Avremo bisogno di quanto segue:
- Kubernetes
- Prometheus Operator
Configurazione del blackbox exporter
Configuriamo il Blackbox tramite ConfigMap per la configurazione http del modulo di monitoraggio dei servizi web.
apiVersion: v1
kind: ConfigMap
metadata:
  name: prometheus-blackbox-exporter
  labels:
    app: prometheus-blackbox-exporter
data:
  blackbox.yaml: |
    modules:
      http_2xx:
        http:
          no_follow_redirects: false
          preferred_ip_protocol: ip4
          valid_http_versions:
          - HTTP/1.1
          - HTTP/2
          valid_status_codes: []
        prober: http
        timeout: 5s
Modulo http_2xx viene utilizzato per verificare che il servizio web restituisca un codice di stato HTTP 2xx. Maggiori dettagli sulla configurazione del blackbox exporter sono descritti in .
Deploy del blackbox exporter nel cluster Kubernetes
Descrivi Deployment e Servizio per il deployment in Kubernetes.
---
kind: Service
apiVersion: v1
metadata:
  name: prometheus-blackbox-exporter
  labels:
    app: prometheus-blackbox-exporter
spec:
  type: ClusterIP
  ports:
    - name: http
      port: 9115
      protocol: TCP
  selector:
    app: prometheus-blackbox-exporter

---
apiVersion: apps/v1
kind: Deployment
metadata:
  name: prometheus-blackbox-exporter
  labels:
    app: prometheus-blackbox-exporter
spec:
  replicas: 1
  selector:
    matchLabels:
      app: prometheus-blackbox-exporter
  template:
    metadata:
      labels:
        app: prometheus-blackbox-exporter
    spec:
      restartPolicy: Always
      containers:
        - name: blackbox-exporter
          image: "prom/blackbox-exporter:v0.15.1"
          imagePullPolicy: IfNotPresent
          securityContext:
            readOnlyRootFilesystem: true
            runAsNonRoot: true
            runAsUser: 1000
          args:
            - "--config.file=/config/blackbox.yaml"
          resources:
            {}
          ports:
            - containerPort: 9115
              name: http
          livenessProbe:
            httpGet:
              path: /health
              port: http
          readinessProbe:
            httpGet:
              path: /health
              port: http
          volumeMounts:
            - mountPath: /config
              name: config
        - name: configmap-reload
          image: "jimmidyson/configmap-reload:v0.2.2"
          imagePullPolicy: "IfNotPresent"
          securityContext:
            runAsNonRoot: true
            runAsUser: 65534
          args:
            - --volume-dir=/etc/config
            - --webhook-url=http://localhost:9115/-/reload
          resources:
            {}
          volumeMounts:
            - mountPath: /etc/config
              name: config
              readOnly: true
      volumes:
        - name: config
          configMap:
            name: prometheus-blackbox-exporter
Il blackbox exporter può essere distribuito utilizzando il seguente comando. Lo spazio dei nomi monitoring si riferisce a Prometheus Operator.
kubectl --namespace=monitoring apply -f blackbox-exporter.yamlAssicurati che tutti i servizi siano attivi utilizzando il seguente comando:
kubectl --namespace=monitoring get all --selector=app=prometheus-blackbox-exporterVerifica Blackbox
Puoi accedere all'interfaccia web dell'esportatore Blackbox tramite port-forward:
kubectl --namespace=monitoring port-forward svc/prometheus-blackbox-exporter 9115:9115Collegati all'interfaccia web dell'esportatore Blackbox tramite il browser all'indirizzo :9115.
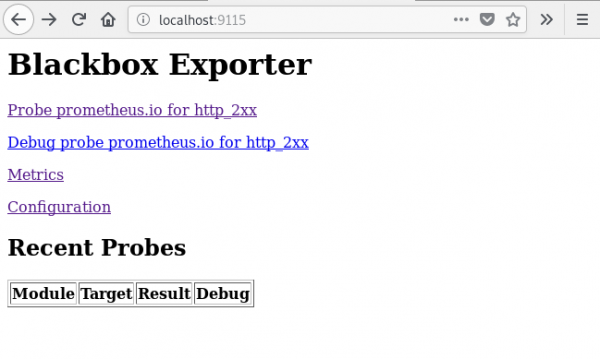
Se accedi all'indirizzo , vedrai il risultato della verifica dell'URL specificato ().
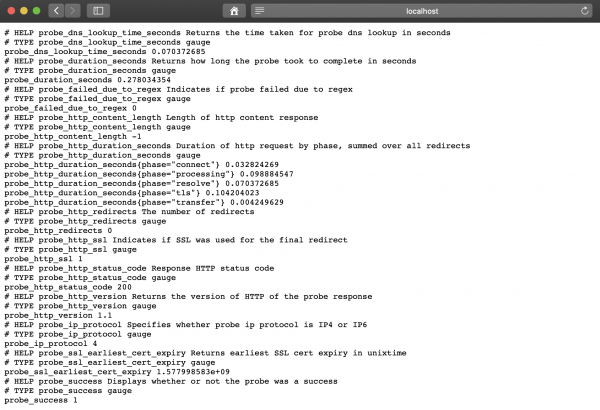
Valore della metrica probe_success uguale a 1 indica una verifica riuscita. Un valore di 0 indica un errore.
Configurazione di Prometheus
Dopo aver distribuito l'esportatore BlackBox, configuriamo Prometheus in prometheus-additional.yaml.
- job_name: 'kube-api-blackbox'
  scrape_interval: 1w
  metrics_path: /probe
  params:
    module: [http_2xx]
  static_configs:
   - targets:
      - https://www.google.com
      - http://www.example.com
      - https://prometheus.io
  relabel_configs:
   - source_labels: [__address__]
     target_label: __param_target
   - source_labels: [__param_target]
     target_label: instance
   - target_label: __address__
     replacement: prometheus-blackbox-exporter:9115 # L'esportatore blackbox.
Generiamo Secret, utilizzando il seguente comando.
PROMETHEUS_ADD_CONFIG=$(cat prometheus-additional.yaml | base64)
cat << EOF | kubectl --namespace=monitoring apply -f -
apiVersion: v1
kind: Secret
metadata:
  name: additional-scrape-configs
type: Opaque
data:
  prometheus-additional.yaml: $PROMETHEUS_ADD_CONFIG
EOF
Specifichiamo additional-scrape-configs per l'Operatore Prometheus, utilizzando additionalScrapeConfigs.
kubectl --namespace=monitoring edit prometheuses k8s
...
spec:
  additionalScrapeConfigs:
    key: prometheus-additional.yaml
    name: additional-scrape-configs
Accediamo all'interfaccia web di Prometheus, verifichiamo le metriche e gli obiettivi.
kubectl --namespace=monitoring port-forward svc/prometheus-k8s 9090:9090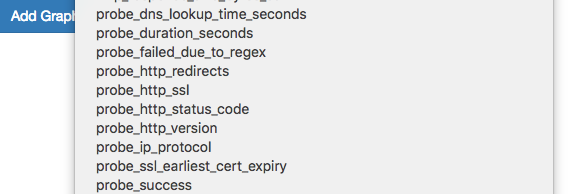
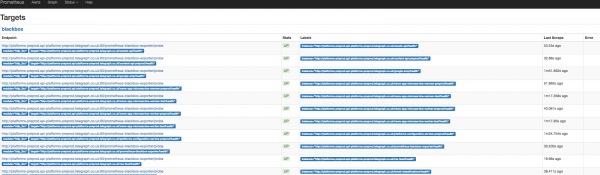
Vediamo le metriche e gli obiettivi Blackbox.
Aggiunta di regole per le notifiche (alert)
Per ricevere notifiche dall'esportatore Blackbox, aggiungeremo regole nell'Operatore Prometheus.
kubectl --namespace=monitoring edit prometheusrules prometheus-k8s-rules
...
  - name: blackbox-exporter
    rules:
    - alert: ProbeFailed
      expr: probe_success == 0
      for: 5m
      labels:
        severity: error
      annotations:
        summary: "Probe fallita (istanza {{ $labels.instance }})"
        description: "Probe fallita
  VALORE = {{ $value }}
  ETICHETTE: {{ $labels }}"
    - alert: SlowProbe
      expr: avg_over_time(probe_duration_seconds[1m]) > 1
      for: 5m
      labels:
        severity: warning
      annotations:
        summary: "Probe lenta (istanza {{ $labels.instance }})"
        description: "La probe blackbox ha impiegato più di 1s per completarsi
  VALORE = {{ $value }}
  ETICHETTE: {{ $labels }}"
    - alert: HttpStatusCode
      expr: probe_http_status_code = 400
      for: 5m
      labels:
        severity: error
      annotations:
        summary: "Codice di stato HTTP (istanza {{ $labels.instance }})"
        description: "Il codice di stato HTTP non è compreso tra 200-399
  VALORE = {{ $value }}
  ETICHETTE: {{ $labels }}"
    - alert: SslCertificateWillExpireSoon
      expr: probe_ssl_earliest_cert_expiry - time() < 86400 * 30
      for: 5m
      labels:
        severity: warning
      annotations:
        summary: "Il certificato SSL scade presto (istanza {{ $labels.instance }})"
        description: "Il certificato SSL scade in 30 giorni
  VALORE = {{ $value }}
  ETICHETTE: {{ $labels }}"
    - alert: SslCertificateHasExpired
      expr: probe_ssl_earliest_cert_expiry - time()  1
      for: 5m
      labels:
        severity: warning
      annotations:
        summary: "Richieste HTTP lente (istanza {{ $labels.instance }})"
        description: "La richiesta HTTP ha impiegato più di 1s
  VALORE = {{ $value }}
  ETICHETTE: {{ $labels }}"
    - alert: SlowPing
      expr: avg_over_time(probe_icmp_duration_seconds[1m]) > 1
      for: 5m
      labels:
        severity: warning
      annotations:
        summary: "Ping lento (istanza {{ $labels.instance }})"
        description: "Il ping blackbox ha impiegato più di 1s
  VALORE = {{ $value }}
  ETICHETTE: {{ $labels }}"
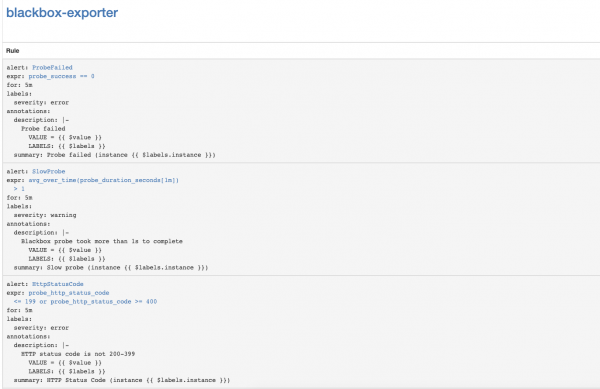
Nell'interfaccia web di Prometheus, vai alla sezione Status => Rules e cerca le regole di allerta per blackbox-exporter.
Configurazione delle notifiche per la scadenza dei certificati SSL del Kubernetes API Server
Impostiamo il monitoraggio della scadenza dei certificati SSL del Kubernetes API Server. Invierà notifiche una volta alla settimana.
Aggiungiamo il modulo Blackbox exporter per l'autenticazione del Kubernetes API Server.
kubectl --namespace=monitoring edit configmap prometheus-blackbox-exporter
...
      kube-api:
        http:
          method: GET
          no_follow_redirects: false
          preferred_ip_protocol: ip4
          tls_config:
            insecure_skip_verify: false
            ca_file: /var/run/secrets/kubernetes.io/serviceaccount/ca.crt
          bearer_token_file: /var/run/secrets/kubernetes.io/serviceaccount/token
          valid_http_versions:
          - HTTP/1.1
          - HTTP/2
          valid_status_codes: []
        prober: http
        timeout: 5s
Aggiungiamo la configurazione di scrape di Prometheus
- job_name: 'kube-api-blackbox'
  metrics_path: /probe
  params:
    module: [kube-api]
  static_configs:
   - targets:
      - https://kubernetes.default.svc/api
  relabel_configs:
   - source_labels: [__address__]
     target_label: __param_target
   - source_labels: [__param_target]
     target_label: instance
   - target_label: __address__
     replacement: prometheus-blackbox-exporter:9115 # L'exporter blackbox.
Applichiamo il segreto di Prometheus
PROMETHEUS_ADD_CONFIG=$(cat prometheus-additional.yaml | base64)
cat << EOF | kubectl --namespace=monitoring apply -f -
apiVersion: v1
kind: Secret
metadata:
  name: additional-scrape-configs
type: Opaque
data:
  prometheus-additional.yaml: $PROMETHEUS_ADD_CONFIG
EOF
Aggiungiamo le regole di allerta
kubectl --namespace=monitoring edit prometheusrules prometheus-k8s-rules
...
  - name: k8s-api-server-cert-expiry
    rules:
    - alert: K8sAPIServerSSLCertExpiringAfterThreeMonths
      expr: probe_ssl_earliest_cert_expiry{job="kube-api-blackbox"} - time() < 86400 * 90
      for: 1w
      labels:
        severity: warning
      annotations:
        summary: "Il certificato SSL del server API di Kubernetes scadrà tra tre mesi (istanza {{ $labels.instance }})"
        description: "Il certificato SSL del server API di Kubernetes scade in 90 giornin  VALORE = {{ $value }}n  ETICHETTE: {{ $labels }}"
Link utili
Fonte: habr.com
