

Questo articolo esamina il progetto , che legge i log di nginx e li invia al cluster Clickhouse. Di solito per i log si utilizza ElasticSearch. Clickhouse richiede meno risorse (spazio su disco, RAM, CPU). Clickhouse scrive i dati più rapidamente. Clickhouse comprime i dati, rendendoli ancora più compatti su disco. I vantaggi di Clickhouse sono evidenti in due diapositive della presentazione.


Per visualizzare l'analisi dei log, creeremo un dashboard per Grafana.
Chi è interessato, è il benvenuto.
Installiamo nginx e grafana nel modo standard.
Installiamo un cluster Clickhouse utilizzando il playbook Ansible di .
Creazione di database e tabelle in Clickhouse
In questo sono descritti i comandi SQL per creare database e tabelle per nginx-log-collector in Clickhouse.
Eseguiamo ogni query una dopo l'altra su ciascun server del cluster Clickhouse.
Nota importante: in questa riga logs_cluster deve essere sostituito con il nome del tuo cluster dal file clickhouse_remote_servers.xml tra "remote_servers" e "shard".
ENGINE = Distributed('logs_cluster', 'nginx', 'access_log_shard', rand())Installazione e configurazione di nginx-log-collector-rpm
Nginx-log-collector non ha il formato rpm. Qui creiamo il suo rpm. La creazione dell'rpm avverrà tramite
Installiamo il pacchetto rpm nginx-log-collector-rpm
yum -y install yum-plugin-copr
yum copr enable antonpatsev/nginx-log-collector-rpm
yum -y install nginx-log-collector
systemctl start nginx-log-collector
Modifichiamo il config /etc/nginx-log-collector/config.yaml:
  .......
  upload:
    table: nginx.access_log
    dsn: http://ip-indirizzo-cluster-clickhouse:8123/

- tag: "nginx_error:"
  format: error  # access | error
  buffer_size: 1048576
  upload:
    table: nginx.error_log
    dsn: http://ip-indirizzo-cluster-clickhouse:8123/
Configurazione di nginx
Configurazione generale di nginx:
user  nginx;
worker_processes  auto;

#error_log  /var/log/nginx/error.log warn;
pid        /var/run/nginx.pid;

events {
    worker_connections  1024;
}

http {
    include       /etc/nginx/mime.types;
    default_type  application/octet-stream;

    log_format  main  '$remote_addr - $remote_user [$time_local] "$request" '
                      '$status $body_bytes_sent "$http_referer" '
                      '"$http_user_agent" "$http_x_forwarded_for"';

    log_format avito_json escape=json
                     '{'
                     '"event_datetime": "$time_iso8601", '
                     '"server_name": "$server_name", '
                     '"remote_addr": "$remote_addr", '
                     '"remote_user": "$remote_user", '
                     '"http_x_real_ip": "$http_x_real_ip", '
                     '"status": "$status", '
                     '"scheme": "$scheme", '
                     '"request_method": "$request_method", '
                     '"request_uri": "$request_uri", '
                     '"server_protocol": "$server_protocol", '
                     '"body_bytes_sent": $body_bytes_sent, '
                     '"http_referer": "$http_referer", '
                     '"http_user_agent": "$http_user_agent", '
                     '"request_bytes": "$request_length", '
                     '"request_time": "$request_time", '
                     '"upstream_addr": "$upstream_addr", '
                     '"upstream_response_time": "$upstream_response_time", '
                     '"hostname": "$hostname", '
                     '"host": "$host"'
                     '}';

    access_log     syslog_server=unix:/var/run/nginx_log.sock,nohostname,tag=nginx avito_json; #ClickHouse
    error_log      syslog_server=unix:/var/run/nginx_log.sock,nohostname,tag=nginx_error; #ClickHouse

    #access_log  /var/log/nginx/access.log  main;

    proxy_ignore_client_abort on;
    sendfile        on;
    keepalive_timeout  65;
    include /etc/nginx/conf.d/*.conf;
}
Virtual host uno:
vhost1.conf:
upstream backend {
    server indirizzo-ip-del-server-con-stub_http_server:8080;
    server indirizzo-ip-del-server-con-stub_http_server:8080;
    server indirizzo-ip-del-server-con-stub_http_server:8080;
    server indirizzo-ip-del-server-con-stub_http_server:8080;
    server indirizzo-ip-del-server-con-stub_http_server:8080;
}

server {
    listen   80;
    server_name vhost1;
    location / {
        proxy_pass http://backend;
    }
}
Aggiungiamo al file /etc/hosts gli host virtuali:
indirizzo-ip-del-server-con-nginx vhost1Emulatore di server HTTP
Utilizzeremo come emulatore di server HTTP da
Nodejs-stub-server non ha rpm. Qui creiamo il suo rpm. La creazione dell'rpm avverrà tramite
Installiamo il pacchetto rpm nodejs-stub-server su upstream nginx
yum -y install yum-plugin-copr
yum copr enable antonpatsev/nodejs-stub-server
yum -y install stub_http_server
systemctl start stub_http_server
Carico di test
Il test viene effettuato con Apache benchmark.
Lo installiamo:
yum install -y httpd-toolsAvviamo il test utilizzando Apache benchmark da 5 server diversi:
while true; do ab -H "User-Agent: 1server" -c 10 -n 10 -t 10 http://vhost1/; sleep 1; done
while true; do ab -H "User-Agent: 2server" -c 10 -n 10 -t 10 http://vhost1/; sleep 1; done
while true; do ab -H "User-Agent: 3server" -c 10 -n 10 -t 10 http://vhost1/; sleep 1; done
while true; do ab -H "User-Agent: 4server" -c 10 -n 10 -t 10 http://vhost1/; sleep 1; done
while true; do ab -H "User-Agent: 5server" -c 10 -n 10 -t 10 http://vhost1/; sleep 1; done
Configurazione di Grafana
Sul sito ufficiale di Grafana non troverete un dashboard.
Pertanto lo faremo manualmente.
Puoi trovare il mio dashboard salvato .
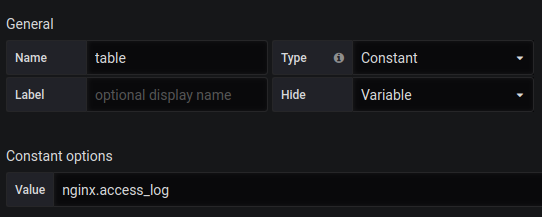
Devi anche creare una variabile table con il contenuto nginx.access_log.
Singlestat Totale Richieste:
SELECT
 1 as t,
 count(*) as c
 FROM $table
 WHERE $timeFilter GROUP BY t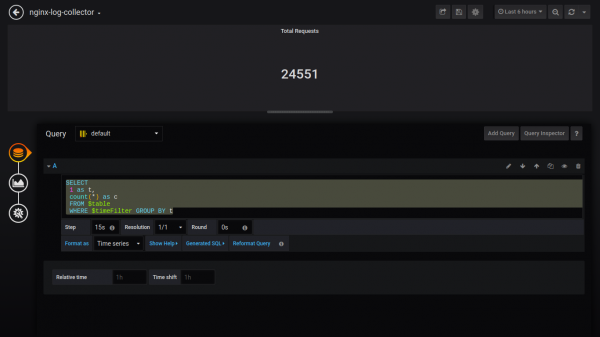
Singlestat Richieste Fallite:
SELECT
 1 as t,
 count(*) as c
 FROM $table
 WHERE $timeFilter AND status NOT IN (200, 201, 401) GROUP BY t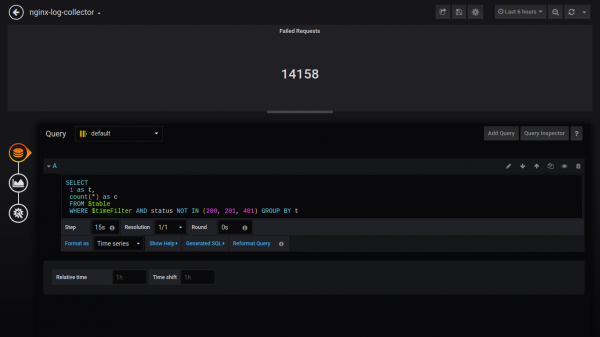
Singlestat Percentuale di Fallimento:
SELECT
 1 as t, (sum(status = 500 or status = 499)/sum(status = 200 or status = 201 or status = 401))*100 FROM $table
 WHERE $timeFilter GROUP BY t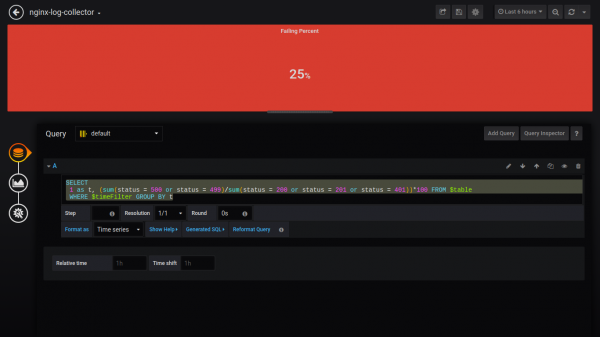
Singlestat Tempo di Risposta Medio:
SELECT
 1, avg(request_time) FROM $table
 WHERE $timeFilter GROUP BY 1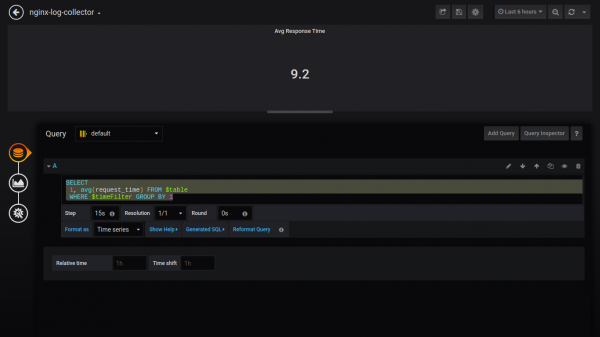
Singlestat Tempo di Risposta Massimo:
SELECT
 1 as t, max(request_time) as c
 FROM $table
 WHERE $timeFilter GROUP BY t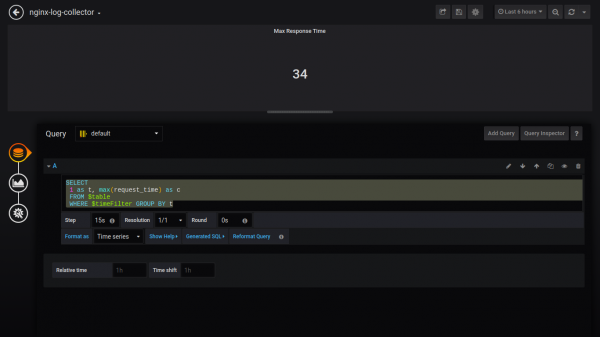
Conteggio Stato:
$columns(status, count(*) as c) from $table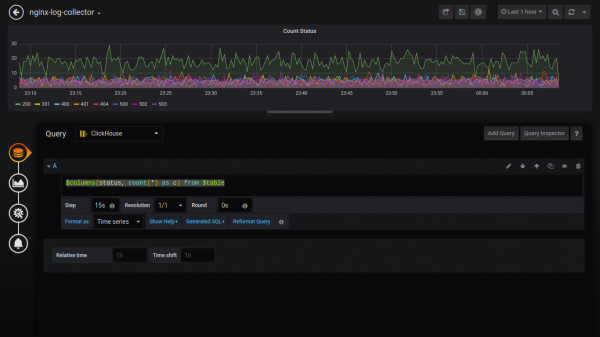
Per visualizzare i dati come un grafico a torta, è necessario installare un plugin e riavviare grafana.
grafana-cli plugins install grafana-piechart-panel
service grafana-server restart
Grafico a Torta TOP 5 Stato:
SELECT
    1, /* valore temporale fittizio */
    status,
    sum(status) AS Reqs
FROM $table
WHERE $timeFilter
GROUP BY status
ORDER BY Reqs desc
LIMIT 5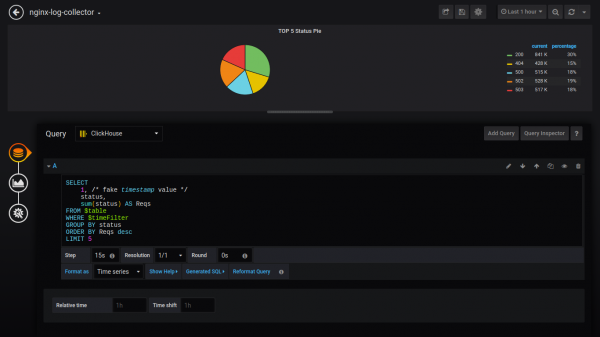
Procederò a fornire le query senza screenshot:
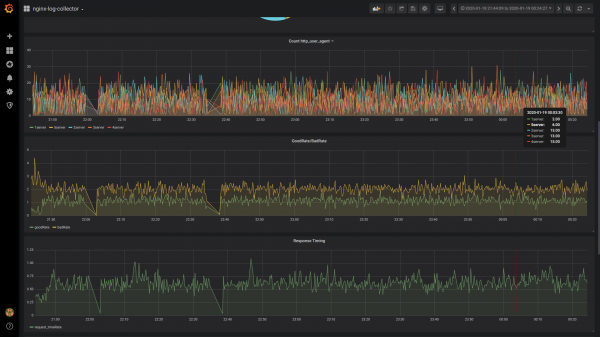
Conteggio http_user_agent:
$columns(http_user_agent, count(*) c) FROM $tableBuon Tasso/Cattivo Tasso:
$rate(countIf(status = 200) AS good, countIf(status != 200) AS bad) FROM $tableTempi di Risposta:
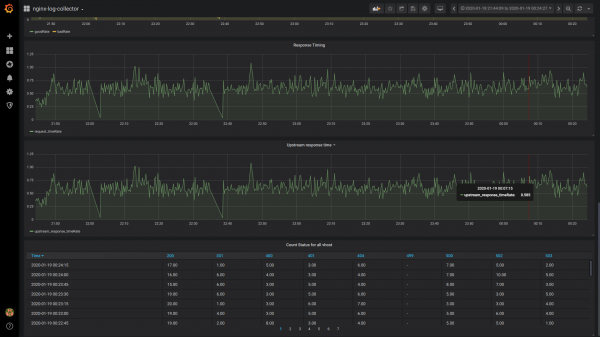
$rate(avg(request_time) as request_time) FROM $tableTempo di risposta upstream (tempo di risposta del 1° upstream):
$rate(avg(arrayElement(upstream_response_time,1)) as upstream_response_time) FROM $tableConteggio Stato della Tabella per tutti i vhost:
$columns(status, count(*) as c) from $tablePanoramica del dashboard

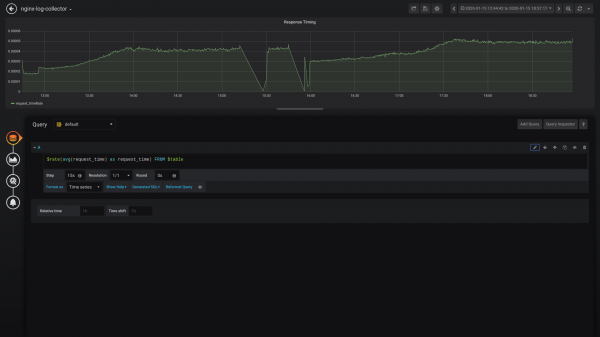
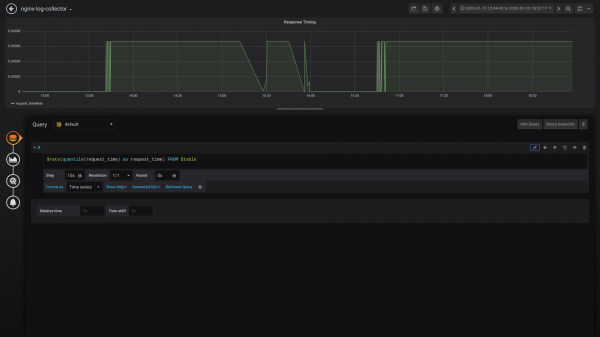
Confronto avg() e quantile()
avg()
quantile()
Risultato:
Spero che la comunità partecipi allo sviluppo/test e utilizzo di nginx-log-collector.
E qualcuno che implementerà nginx-log-collector racconterà quanto ha risparmiato in disco, RAM e CPU.
Canali Telegram:
Millisecondi:
Per chi tiene ai millisecondi, vi prego di scrivere o votare in questo .
Fonte: habr.com
