

မှတ်တမ်း၊ မက်ထရစ်များနှင့် ဖြစ်ရပ်ဒေတာများကို စုဆောင်း၊ အသွင်ပြောင်းပြီး ပေးပို့ရန် ဒီဇိုင်းထုတ်ထားသည်။
→
Rust ဘာသာစကားဖြင့် ရေးသားထားခြင်းဖြစ်ပြီး ၎င်းသည် ၎င်း၏ analogues များနှင့် နှိုင်းယှဉ်ပါက မြင့်မားသောစွမ်းဆောင်ရည်နှင့် RAM သုံးစွဲမှုနည်းပါးခြင်းတို့ကြောင့် ထင်ရှားသည်။ ထို့အပြင်၊ အထူးသဖြင့်၊ ဒစ်ခ်ပေါ်ရှိ ကြားခံတစ်ခုသို့ မပို့ရသေးသောဖြစ်ရပ်များကို သိမ်းဆည်းရန်နှင့် ဖိုင်များကို လှည့်ခြင်းဆိုင်ရာ မှန်ကန်မှုနှင့်ပတ်သက်သည့် လုပ်ဆောင်ချက်များကို များစွာအာရုံစိုက်ထားသည်။
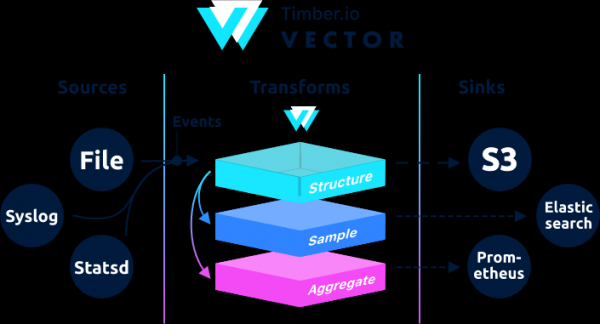
ဗိသုကာအရ၊ Vector သည် တစ်ခု သို့မဟုတ် တစ်ခုထက်ပိုသော မက်ဆေ့ချ်များကို လက်ခံသည့် event router တစ်ခုဖြစ်သည်။ အရင်းအမြစ်များဤစာများပေါ်တွင် စိတ်ကြိုက်ရွေးချယ်နိုင်သည်။ အသွင်ပြောင်းမှုများ၊ တစ်ခု သို့မဟုတ် တစ်ခုထက်ပိုသောထံသို့ ပေးပို့ပါ။ မြောင်းများ.
Vector သည် filebeat နှင့် logstash တို့အတွက် အစားထိုးတစ်ခုဖြစ်ပြီး ၎င်းသည် အခန်းကဏ္ဍနှစ်ခုလုံးတွင် လုပ်ဆောင်နိုင်သည် (မှတ်တမ်းများကို လက်ခံခြင်းနှင့် ပေးပို့ခြင်း) တွင် ၎င်းတို့၏အသေးစိတ်အချက်အလက်များ .
Logstash တွင် ကွင်းဆက်အား input → filter → output အဖြစ်တည်ဆောက်ထားလျှင်၊ ထို့နောက် Vector တွင် ၎င်းသည် ရှိနေသည်။ → →
ဥပမာများကို စာရွက်စာတမ်းများတွင် တွေ့နိုင်သည်။
ဤညွှန်ကြားချက်သည် ပြန်လည်ပြင်ဆင်ထားသော ညွှန်ကြားချက်ဖြစ်သည်။ . မူရင်းညွှန်ကြားချက်များတွင် geoip လုပ်ဆောင်ခြင်း ပါဝင်သည်။ အတွင်းကွန်ယက်မှ geoip ကိုစမ်းသပ်သောအခါ vector သည်အမှားတစ်ခုပေးခဲ့သည်။
Aug 05 06:25:31.889 DEBUG transform{name=nginx_parse_rename_fields type=rename_fields}: vector::transforms::rename_fields: Field did not exist field=«geoip.country_name» rate_limit_secs=30အကယ်၍ တစ်စုံတစ်ယောက်သည် geoip ကိုလုပ်ဆောင်ရန် လိုအပ်ပါက၊ ထို့နောက် မူရင်းညွှန်ကြားချက်များကို ကိုးကားပါ။ .
ကျွန်ုပ်တို့သည် Nginx (ဝင်ရောက်ခွင့်မှတ်တမ်းများ) → Vector (Client | Filebeat) → Vector (Server | Logstash) → Clickhouse တွင် သီးခြားစီနှင့် Elasticsearch တွင် သီးခြားစီ စီစဉ်ပေးပါမည်။ ဆာဗာ 4 ခု တပ်ဆင်ပါမည်။ ဆာဗာ 3 ခုဖြင့် ချိတ်ဆက်နိုင်သော်လည်း၊
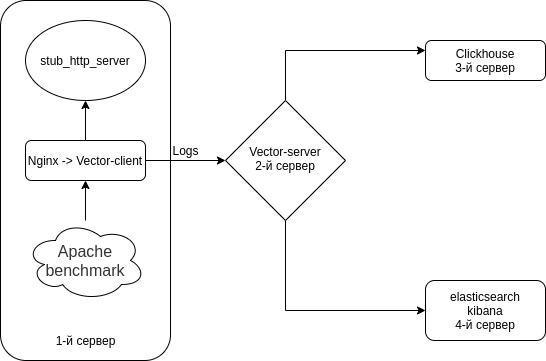
အကြမ်းဖျင်းအားဖြင့် အောက်ပါအတိုင်းဖြစ်သည်။
သင်၏ဆာဗာများအားလုံးတွင် Selinux ကိုပိတ်ပါ။
sed -i 's/^SELINUX=.*/SELINUX=disabled/g' /etc/selinux/config
reboot
ကျွန်ုပ်တို့သည် ဆာဗာအားလုံးတွင် HTTP ဆာဗာ emulator + အသုံးအဆောင်ပစ္စည်းများကို ထည့်သွင်းပါသည်။
HTTP server emulator အဖြစ်ကျွန်ုပ်တို့အသုံးပြုပါမည်။ от
Nodejs-stub-server တွင် rpm မရှိပါ။ ၎င်းအတွက် rpm ဖန်တီးပါ။ rpm ကိုအသုံးပြု၍ စုစည်းပေးပါမည်။
repository antonpatsev/nodejs-stub-server ကိုထည့်ခြင်း။
yum -y install yum-plugin-copr epel-release
yes | yum copr enable antonpatsev/nodejs-stub-server
ဆာဗာအားလုံးတွင် nodejs-stub-server၊ Apache စံညွှန်းနှင့် terminal multiplexer မျက်နှာပြင်ကို ထည့်သွင်းပါ
yum -y install stub_http_server screen mc httpd-tools screenမှတ်တမ်းများပိုမိုရှိစေရန် stub_http_server တုံ့ပြန်မှုအချိန်ကို /var/lib/stub_http_server/stub_http_server.js တွင် ပြုပြင်ခဲ့သည်။
var max_sleep = 10;stub_http_server ကို စလိုက်ရအောင်။
systemctl start stub_http_server
systemctl enable stub_http_serverဆာဗာ ၃ တွင်
ClickHouse သည် SSE 4.2 ညွှန်ကြားချက်အစုံကိုအသုံးပြုသည်၊ ထို့ကြောင့် အခြားနည်းဖြင့်သတ်မှတ်ထားခြင်းမရှိပါက၊ အသုံးပြုထားသောပရိုဆက်ဆာတွင် ၎င်း၏ပံ့ပိုးမှုသည် နောက်ထပ်စနစ်လိုအပ်ချက်တစ်ခုဖြစ်လာသည်။ ဤသည်မှာ လက်ရှိ ပရိုဆက်ဆာသည် SSE 4.2 ကို ပံ့ပိုးခြင်း ရှိ၊ မရှိ စစ်ဆေးရန် ညွှန်ကြားချက်ဖြစ်သည်။
grep -q sse4_2 /proc/cpuinfo && echo "SSE 4.2 supported" || echo "SSE 4.2 not supported"ပထမဆုံး တရားဝင် repository ကို ချိတ်ဆက်ရန် လိုအပ်သည် ။
sudo yum install -y yum-utils
sudo rpm --import https://repo.clickhouse.tech/CLICKHOUSE-KEY.GPG
sudo yum-config-manager --add-repo https://repo.clickhouse.tech/rpm/stable/x86_64
ပက်ကေ့ဂျ်များ ထည့်သွင်းရန် အောက်ပါ command များကို လုပ်ဆောင်ရန် လိုအပ်သည်-
sudo yum install -y clickhouse-server clickhouse-clientဖိုင် /etc/clickhouse-server/config.xml ရှိ ကွန်ရက်ကတ်ကို နားထောင်ရန် clickhouse-ဆာဗာအား ခွင့်ပြုပါ။
<listen_host>0.0.0.0</listen_host>မှတ်တမ်းတင်ခြင်းအဆင့်ကို ခြေရာခံခြင်းမှ အမှားရှာပြင်ခြင်းသို့ ပြောင်းလဲပါ။
ဒီဘာဂ်
Compression ဆက်တင်များသည် ပုံမှန်ဖြစ်သည်-
min_compress_block_size  65536
max_compress_block_size  1048576
Zstd ကိုအသက်သွင်းရန်၊ config ကိုမထိဘဲ DDL ကိုအသုံးပြုရန်အကြံပြုထားသည်။

Google တွင် DDL မှတစ်ဆင့် zstd compression ကို မည်သို့အသုံးပြုရမည်ကို ကျွန်ုပ် ရှာမတွေ့ပါ။ ဒါနဲ့ ကျွန်တော်လည်း ဒီအတိုင်းထားခဲ့လိုက်တယ်။
Clickhouse တွင် zstd compression ကိုအသုံးပြုသော လုပ်ဖော်ကိုင်ဖက်များ - ကျေးဇူးပြု၍ ညွှန်ကြားချက်များကို မျှဝေပါ။
ဆာဗာကို daemon အဖြစ်စတင်ရန်၊ run ပါ။
service clickhouse-server startအခု Clickhouse ကို စဖွင့်ကြရအောင်
Clickhouse ကို သွားကြရအောင်
clickhouse-client -h 172.26.10.109 -m172.26.10.109 — Clickhouse ထည့်သွင်းသည့် ဆာဗာ၏ IP။
vector DB တစ်ခုဖန်တီးကြည့်ရအောင်
CREATE DATABASE vector;ဒေတာဘေ့စ်ရှိမရှိ စစ်ဆေးကြည့်ရအောင်။
show databases;vector.logs ဇယားကိုဖန်တီးပါ။
/* Это таблица где хранятся логи как есть */

CREATE TABLE vector.logs
(
    `node_name` String,
    `timestamp` DateTime,
    `server_name` String,
    `user_id` String,
    `request_full` String,
    `request_user_agent` String,
    `request_http_host` String,
    `request_uri` String,
    `request_scheme` String,
    `request_method` String,
    `request_length` UInt64,
    `request_time` Float32,
    `request_referrer` String,
    `response_status` UInt16,
    `response_body_bytes_sent` UInt64,
    `response_content_type` String,
    `remote_addr` IPv4,
    `remote_port` UInt32,
    `remote_user` String,
    `upstream_addr` IPv4,
    `upstream_port` UInt32,
    `upstream_bytes_received` UInt64,
    `upstream_bytes_sent` UInt64,
    `upstream_cache_status` String,
    `upstream_connect_time` Float32,
    `upstream_header_time` Float32,
    `upstream_response_length` UInt64,
    `upstream_response_time` Float32,
    `upstream_status` UInt16,
    `upstream_content_type` String,
    INDEX idx_http_host request_http_host TYPE set(0) GRANULARITY 1
)
ENGINE = MergeTree()
PARTITION BY toYYYYMMDD(timestamp)
ORDER BY timestamp
TTL timestamp + toIntervalMonth(1)
SETTINGS index_granularity = 8192;
ဇယားများကို ဖန်တီးထားကြောင်း ကျွန်ုပ်တို့ စစ်ဆေးပါသည်။ ကျနော်တို့ ပစ်လွှတ်တယ်။ clickhouse-client ငါတို့တောင်းဆိုချက်တစ်ခုလုပ်တယ်။
vector database ကိုသွားကြည့်ရအောင်။
use vector;

Ok.

0 rows in set. Elapsed: 0.001 sec.
စားပွဲတွေကို ကြည့်ရအောင်။
show tables;

┌─name────────────────┐
│ logs                │
└─────────────────────┘
Clickhouse နှင့် နှိုင်းယှဉ်ရန်အတွက် Elasticsearch သို့ အလားတူဒေတာပေးပို့ရန် 4th ဆာဗာတွင် elasticsearch ကိုထည့်သွင်းခြင်း
အများသူငှာ rpm ကီးတစ်ခု ထည့်ကြည့်ရအောင်
rpm --import https://artifacts.elastic.co/GPG-KEY-elasticsearchRepos 2 ခု ဖန်တီးကြည့်ရအောင်။
/etc/yum.repos.d/elasticsearch.repo
[elasticsearch]
name=Elasticsearch repository for 7.x packages
baseurl=https://artifacts.elastic.co/packages/7.x/yum
gpgcheck=1
gpgkey=https://artifacts.elastic.co/GPG-KEY-elasticsearch
enabled=0
autorefresh=1
type=rpm-md
/etc/yum.repos.d/kibana.repo
[kibana-7.x]
name=Kibana repository for 7.x packages
baseurl=https://artifacts.elastic.co/packages/7.x/yum
gpgcheck=1
gpgkey=https://artifacts.elastic.co/GPG-KEY-elasticsearch
enabled=1
autorefresh=1
type=rpm-md
elasticsearch နှင့် kibana ကိုထည့်သွင်းပါ။
yum install -y kibana elasticsearchမိတ္တူ 1 ခုရှိမည်ဖြစ်သောကြောင့်၊ သင်သည် အောက်ပါတို့ကို /etc/elasticsearch/elasticsearch.yml ဖိုင်သို့ ထည့်ရန် လိုအပ်သည်-
discovery.type: single-nodeအခြားဆာဗာမှ elasticsearch သို့ဒေတာပေးပို့ရန် vector ကိုဖွင့်ရန်၊ network.host ကိုပြောင်းကြပါစို့။
network.host: 0.0.0.0kibana သို့ ချိတ်ဆက်ရန် /etc/kibana/kibana.yml ဖိုင်ရှိ server.host ပါရာမီတာကို ပြောင်းပါ
server.host: "0.0.0.0"ကျွန်ုပ်တို့သည် အသက်ကြီးပြီဖြစ်၍ autostart တွင် elasticsearch ကိုဖွင့်ပါ။
systemctl enable elasticsearch
systemctl start elasticsearch
နှင့် kibana
systemctl enable kibana
systemctl start kibana
single-node မုဒ် 1 shard၊ 0 ပုံစံတူအတွက် Elasticsearch ကို စနစ်ထည့်သွင်းခြင်း။ ဖြစ်နိုင်ချေများသောအားဖြင့် သင့်တွင် ဆာဗာအများအပြား၏အစုအဝေးတစ်ခုရှိမည်ဖြစ်ပြီး ၎င်းကိုသင်လုပ်ဆောင်ရန်မလိုအပ်ပါ။
အနာဂတ်အညွှန်းများအတွက်၊ မူရင်းပုံစံပုံစံကို အပ်ဒိတ်လုပ်ပါ-
curl -X PUT http://localhost:9200/_template/default -H 'Content-Type: application/json' -d '{"index_patterns": ["*"],"order": -1,"settings": {"number_of_shards": "1","number_of_replicas": "0"}}' ustanovka ဆာဗာ 2 ရှိ Logstash အတွက် အစားထိုးမှုအဖြစ်
yum install -y https://packages.timber.io/vector/0.9.X/vector-x86_64.rpm mc httpd-tools screenLogstash အတွက် အစားထိုးအဖြစ် Vector ကို သတ်မှတ်ကြပါစို့။ /etc/vector/vector.toml ဖိုင်ကို တည်းဖြတ်ပါ။
# /etc/vector/vector.toml

data_dir = "/var/lib/vector"

[sources.nginx_input_vector]
  # General
  type                          = "vector"
  address                       = "0.0.0.0:9876"
  shutdown_timeout_secs         = 30

[transforms.nginx_parse_json]
  inputs                        = [ "nginx_input_vector" ]
  type                          = "json_parser"

[transforms.nginx_parse_add_defaults]
  inputs                        = [ "nginx_parse_json" ]
  type                          = "lua"
  version                       = "2"

  hooks.process = """
  function (event, emit)

    function split_first(s, delimiter)
      result = {};
      for match in (s..delimiter):gmatch("(.-)"..delimiter) do
          table.insert(result, match);
      end
      return result[1];
    end

    function split_last(s, delimiter)
      result = {};
      for match in (s..delimiter):gmatch("(.-)"..delimiter) do
          table.insert(result, match);
      end
      return result[#result];
    end

    event.log.upstream_addr             = split_first(split_last(event.log.upstream_addr, ', '), ':')
    event.log.upstream_bytes_received   = split_last(event.log.upstream_bytes_received, ', ')
    event.log.upstream_bytes_sent       = split_last(event.log.upstream_bytes_sent, ', ')
    event.log.upstream_connect_time     = split_last(event.log.upstream_connect_time, ', ')
    event.log.upstream_header_time      = split_last(event.log.upstream_header_time, ', ')
    event.log.upstream_response_length  = split_last(event.log.upstream_response_length, ', ')
    event.log.upstream_response_time    = split_last(event.log.upstream_response_time, ', ')
    event.log.upstream_status           = split_last(event.log.upstream_status, ', ')

    if event.log.upstream_addr == "" then
        event.log.upstream_addr = "127.0.0.1"
    end

    if (event.log.upstream_bytes_received == "-" or event.log.upstream_bytes_received == "") then
        event.log.upstream_bytes_received = "0"
    end

    if (event.log.upstream_bytes_sent == "-" or event.log.upstream_bytes_sent == "") then
        event.log.upstream_bytes_sent = "0"
    end

    if event.log.upstream_cache_status == "" then
        event.log.upstream_cache_status = "DISABLED"
    end

    if (event.log.upstream_connect_time == "-" or event.log.upstream_connect_time == "") then
        event.log.upstream_connect_time = "0"
    end

    if (event.log.upstream_header_time == "-" or event.log.upstream_header_time == "") then
        event.log.upstream_header_time = "0"
    end

    if (event.log.upstream_response_length == "-" or event.log.upstream_response_length == "") then
        event.log.upstream_response_length = "0"
    end

    if (event.log.upstream_response_time == "-" or event.log.upstream_response_time == "") then
        event.log.upstream_response_time = "0"
    end

    if (event.log.upstream_status == "-" or event.log.upstream_status == "") then
        event.log.upstream_status = "0"
    end

    emit(event)

  end
  """

[transforms.nginx_parse_remove_fields]
    inputs                              = [ "nginx_parse_add_defaults" ]
    type                                = "remove_fields"
    fields                              = ["data", "file", "host", "source_type"]

[transforms.nginx_parse_coercer]

    type                                = "coercer"
    inputs                              = ["nginx_parse_remove_fields"]

    types.request_length = "int"
    types.request_time = "float"

    types.response_status = "int"
    types.response_body_bytes_sent = "int"

    types.remote_port = "int"

    types.upstream_bytes_received = "int"
    types.upstream_bytes_send = "int"
    types.upstream_connect_time = "float"
    types.upstream_header_time = "float"
    types.upstream_response_length = "int"
    types.upstream_response_time = "float"
    types.upstream_status = "int"

    types.timestamp = "timestamp"

[sinks.nginx_output_clickhouse]
    inputs   = ["nginx_parse_coercer"]
    type     = "clickhouse"

    database = "vector"
    healthcheck = true
    host = "http://172.26.10.109:8123" #  Адрес Clickhouse
    table = "logs"

    encoding.timestamp_format = "unix"

    buffer.type = "disk"
    buffer.max_size = 104900000
    buffer.when_full = "block"

    request.in_flight_limit = 20

[sinks.elasticsearch]
    type = "elasticsearch"
    inputs   = ["nginx_parse_coercer"]
    compression = "none"
    healthcheck = true
    # 172.26.10.116 - сервер где установен elasticsearch
    host = "http://172.26.10.116:9200"
    index = "vector-%Y-%m-%d"
transforms.nginx_parse_add_defaults ကဏ္ဍကို သင် ချိန်ညှိနိုင်သည်။
မှစ. CDN အသေးတစ်ခုအတွက် ဤ configs ကိုအသုံးပြုပြီး တန်ဖိုးများစွာသည် upstream_* သို့ရောက်ရှိနိုင်သည်
ဥပမာ:
"upstream_addr": "128.66.0.10:443, 128.66.0.11:443, 128.66.0.12:443"
"upstream_bytes_received": "-, -, 123"
"upstream_status": "502, 502, 200"
ဒါက သင့်အခြေအနေမဟုတ်ရင် ဒီအပိုင်းကို ရိုးရှင်းအောင် လုပ်နိုင်ပါတယ်။
systemd /etc/systemd/system/vector.service အတွက် ဝန်ဆောင်မှုဆက်တင်များကို ဖန်တီးကြပါစို့
# /etc/systemd/system/vector.service

[Unit]
Description=Vector
After=network-online.target
Requires=network-online.target

[Service]
User=vector
Group=vector
ExecStart=/usr/bin/vector
ExecReload=/bin/kill -HUP $MAINPID
Restart=no
StandardOutput=syslog
StandardError=syslog
SyslogIdentifier=vector

[Install]
WantedBy=multi-user.target
ဇယားများကိုဖန်တီးပြီးသည်နှင့် Vector ကို run နိုင်သည်။
systemctl enable vector
systemctl start vector
Vector မှတ်တမ်းများကို ဤကဲ့သို့ ကြည့်ရှုနိုင်ပါသည်။
journalctl -f -u vectorမှတ်တမ်းများတွင် ဤကဲ့သို့သော ထည့်သွင်းမှုများ ပါဝင်သင့်သည်။
INFO vector::topology::builder: Healthcheck: Passed.
INFO vector::topology::builder: Healthcheck: Passed.
ကလိုင်းယင့် (ဝဘ်ဆာဗာ) တွင် - 1st ဆာဗာ
clickhouse ရှိ မှတ်တမ်းဇယားသည် အကွက်ကို အသုံးပြုထားသောကြောင့် nginx ဖြင့် ဆာဗာတွင် ipv6 ကို ပိတ်ရန် လိုအပ်ပါသည်။ upstream_addr IPv4၊ အဘယ်ကြောင့်ဆိုသော် ကျွန်ုပ်သည် ကွန်ရက်အတွင်း ipv6 ကို အသုံးမပြုပါ။ ipv6 ကို disable လုပ်မထားပါက errors များ ရှိလိမ့်မည် ။
DB::Exception: Invalid IPv4 value.: (while read the value of key upstream_addr)စာဖတ်သူများ၊ ipv6 ပံ့ပိုးမှုထည့်ပါ။
/etc/sysctl.d/98-disable-ipv6.conf ဖိုင်ကို ဖန်တီးပါ။
net.ipv6.conf.all.disable_ipv6 = 1
net.ipv6.conf.default.disable_ipv6 = 1
net.ipv6.conf.lo.disable_ipv6 = 1
ဆက်တင်များကို အသုံးပြုပါ။
sysctl --systemnginx ကို install လုပ်ရအောင်။
nginx repository ဖိုင် /etc/yum.repos.d/nginx.repo ကို ထည့်ထားသည်
[nginx-stable]
name=nginx stable repo
baseurl=http://nginx.org/packages/centos/$releasever/$basearch/
gpgcheck=1
enabled=1
gpgkey=https://nginx.org/keys/nginx_signing.key
module_hotfixes=true
nginx အထုပ်ကို install လုပ်ပါ။
yum install -y nginxဦးစွာ၊ ကျွန်ုပ်တို့သည် /etc/nginx/nginx.conf ဖိုင်တွင် Nginx ရှိ မှတ်တမ်းဖော်မတ်ကို သတ်မှတ်ရန် လိုအပ်သည်။
user  nginx;
# you must set worker processes based on your CPU cores, nginx does not benefit from setting more than that
worker_processes auto; #some last versions calculate it automatically

# number of file descriptors used for nginx
# the limit for the maximum FDs on the server is usually set by the OS.
# if you don't set FD's then OS settings will be used which is by default 2000
worker_rlimit_nofile 100000;

error_log  /var/log/nginx/error.log warn;
pid        /var/run/nginx.pid;

# provides the configuration file context in which the directives that affect connection processing are specified.
events {
    # determines how much clients will be served per worker
    # max clients = worker_connections * worker_processes
    # max clients is also limited by the number of socket connections available on the system (~64k)
    worker_connections 4000;

    # optimized to serve many clients with each thread, essential for linux -- for testing environment
    use epoll;

    # accept as many connections as possible, may flood worker connections if set too low -- for testing environment
    multi_accept on;
}

http {
    include       /etc/nginx/mime.types;
    default_type  application/octet-stream;

    log_format  main  '$remote_addr - $remote_user [$time_local] "$request" '
                      '$status $body_bytes_sent "$http_referer" '
                      '"$http_user_agent" "$http_x_forwarded_for"';

log_format vector escape=json
    '{'
        '"node_name":"nginx-vector",'
        '"timestamp":"$time_iso8601",'
        '"server_name":"$server_name",'
        '"request_full": "$request",'
        '"request_user_agent":"$http_user_agent",'
        '"request_http_host":"$http_host",'
        '"request_uri":"$request_uri",'
        '"request_scheme": "$scheme",'
        '"request_method":"$request_method",'
        '"request_length":"$request_length",'
        '"request_time": "$request_time",'
        '"request_referrer":"$http_referer",'
        '"response_status": "$status",'
        '"response_body_bytes_sent":"$body_bytes_sent",'
        '"response_content_type":"$sent_http_content_type",'
        '"remote_addr": "$remote_addr",'
        '"remote_port": "$remote_port",'
        '"remote_user": "$remote_user",'
        '"upstream_addr": "$upstream_addr",'
        '"upstream_bytes_received": "$upstream_bytes_received",'
        '"upstream_bytes_sent": "$upstream_bytes_sent",'
        '"upstream_cache_status":"$upstream_cache_status",'
        '"upstream_connect_time":"$upstream_connect_time",'
        '"upstream_header_time":"$upstream_header_time",'
        '"upstream_response_length":"$upstream_response_length",'
        '"upstream_response_time":"$upstream_response_time",'
        '"upstream_status": "$upstream_status",'
        '"upstream_content_type":"$upstream_http_content_type"'
    '}';

    access_log  /var/log/nginx/access.log  main;
    access_log  /var/log/nginx/access.json.log vector;      # Новый лог в формате json

    sendfile        on;
    #tcp_nopush     on;

    keepalive_timeout  65;

    #gzip  on;

    include /etc/nginx/conf.d/*.conf;
}
သင်၏ လက်ရှိဖွဲ့စည်းပုံကို ချိုးဖောက်ခြင်းမှ ရှောင်ရှားရန် Nginx သည် သင့်အား access_log လမ်းညွှန်ချက်များစွာကို ရရှိစေမည်ဖြစ်သည်။
access_log  /var/log/nginx/access.log  main;            # Стандартный лог
access_log  /var/log/nginx/access.json.log vector;      # Новый лог в формате json
မှတ်တမ်းအသစ်များအတွက် logrotate လုပ်ရန် စည်းမျဉ်းတစ်ခုထည့်ရန် မမေ့ပါနှင့် (မှတ်တမ်းဖိုင်သည် .log တွင် မဆုံးပါက)
default.conf ကို /etc/nginx/conf.d/ မှ ဖယ်ရှားပါ
rm -f /etc/nginx/conf.d/default.confvirtual host /etc/nginx/conf.d/vhost1.conf ထည့်ပါ။
server {
    listen 80;
    server_name vhost1;
    location / {
        proxy_pass http://172.26.10.106:8080;
    }
}
virtual host /etc/nginx/conf.d/vhost2.conf ထည့်ပါ။
server {
    listen 80;
    server_name vhost2;
    location / {
        proxy_pass http://172.26.10.108:8080;
    }
}
virtual host /etc/nginx/conf.d/vhost3.conf ထည့်ပါ။
server {
    listen 80;
    server_name vhost3;
    location / {
        proxy_pass http://172.26.10.109:8080;
    }
}
virtual host /etc/nginx/conf.d/vhost4.conf ထည့်ပါ။
server {
    listen 80;
    server_name vhost4;
    location / {
        proxy_pass http://172.26.10.116:8080;
    }
}
ဆာဗာအားလုံးတွင် /etc/hosts ဖိုင် (172.26.10.106 IP ကို nginx ထည့်သွင်းထား) တွင် virtual host များကို ထည့်ပါ-
172.26.10.106 vhost1
172.26.10.106 vhost2
172.26.10.106 vhost3
172.26.10.106 vhost4
အားလုံးအဆင်သင့်ဖြစ်လျှင်
nginx -t
systemctl restart nginx
ယခုကျွန်ုပ်တို့ကိုယ်တိုင် install လုပ်ပါမည်။
yum install -y https://packages.timber.io/vector/0.9.X/vector-x86_64.rpmsystemd /etc/systemd/system/vector.service အတွက် ဆက်တင်ဖိုင်တစ်ခု ဖန်တီးကြပါစို့
[Unit]
Description=Vector
After=network-online.target
Requires=network-online.target

[Service]
User=vector
Group=vector
ExecStart=/usr/bin/vector
ExecReload=/bin/kill -HUP $MAINPID
Restart=no
StandardOutput=syslog
StandardError=syslog
SyslogIdentifier=vector

[Install]
WantedBy=multi-user.target
ထို့အပြင် ကျွန်ုပ်တို့သည် config /etc/vector/vector.toml တွင် Filebeat အစားထိုးမှုကို configure လုပ်ပါမည်။ IP လိပ်စာ 172.26.10.108 သည် မှတ်တမ်းဆာဗာ (Vector-Server) ၏ IP လိပ်စာဖြစ်သည်
data_dir = "/var/lib/vector"

[sources.nginx_file]
  type                          = "file"
  include                       = [ "/var/log/nginx/access.json.log" ]
  start_at_beginning            = false
  fingerprinting.strategy       = "device_and_inode"

[sinks.nginx_output_vector]
  type                          = "vector"
  inputs                        = [ "nginx_file" ]

  address                       = "172.26.10.108:9876"
log file တွေကို ဖတ်နိုင်အောင် user vector ကို သင့်တော်တဲ့ group ထဲ ထည့်ဖို့ မမေ့ပါနဲ့။ ဥပမာ၊ nginx မှာ centos adm group rights များဖြင့် logs များကို ဖန်တီးသည်။
usermod -a -G adm vectorvector ဝန်ဆောင်မှုကို စတင်လိုက်ရအောင်
systemctl enable vector
systemctl start vector
Vector မှတ်တမ်းများကို ဤကဲ့သို့ ကြည့်ရှုနိုင်ပါသည်။
journalctl -f -u vectorမှတ်တမ်းများတွင် ဤကဲ့သို့သော ဝင်ခွင့်တစ်ခု ရှိသင့်သည်။
INFO vector::topology::builder: Healthcheck: Passed.စိတ်ဖိစီးမှုစမ်းသပ်ခြင်း။
ကျွန်ုပ်တို့သည် Apache စံညွှန်းကို အသုံးပြု၍ စမ်းသပ်မှုများ လုပ်ဆောင်ပါသည်။
httpd-tools package ကို ဆာဗာအားလုံးတွင် ထည့်သွင်းထားသည်။
ကျွန်ုပ်တို့သည် မျက်နှာပြင်ရှိ မတူညီသောဆာဗာ 4 ခုမှ Apache စံနှုန်းဖြင့် စမ်းသပ်ခြင်းကို လုပ်ဆောင်ပါသည်။ ပထမဦးစွာ၊ ကျွန်ုပ်တို့သည် terminal multiplexer မျက်နှာပြင်ကို လုပ်ဆောင်ပြီး၊ ထို့နောက် Apache စံနှုန်းဖြင့် စမ်းသပ်ခြင်းကို လုပ်ဆောင်ပါသည်။ ဖန်သားပြင်ဖြင့် မည်သို့လုပ်ဆောင်ရမည်ကို သင်ရှာဖွေနိုင်ပါသည်။ .
1st server မှ
while true; do ab -H "User-Agent: 1server" -c 100 -n 10 -t 10 http://vhost1/; sleep 1; done2st server မှ
while true; do ab -H "User-Agent: 2server" -c 100 -n 10 -t 10 http://vhost2/; sleep 1; done3st server မှ
while true; do ab -H "User-Agent: 3server" -c 100 -n 10 -t 10 http://vhost3/; sleep 1; done4st server မှ
while true; do ab -H "User-Agent: 4server" -c 100 -n 10 -t 10 http://vhost4/; sleep 1; doneClickhouse တွင်ဒေတာကိုစစ်ဆေးကြပါစို့
Clickhouse ကို သွားကြရအောင်
clickhouse-client -h 172.26.10.109 -mကျွန်ုပ်တို့သည် SQL query တစ်ခုပြုလုပ်သည်။
SELECT * FROM vector.logs;

┌─node_name────┬───────────timestamp─┬─server_name─┬─user_id─┬─request_full───┬─request_user_agent─┬─request_http_host─┬─request_uri─┬─request_scheme─┬─request_method─┬─request_length─┬─request_time─┬─request_referrer─┬─response_status─┬─response_body_bytes_sent─┬─response_content_type─┬───remote_addr─┬─remote_port─┬─remote_user─┬─upstream_addr─┬─upstream_port─┬─upstream_bytes_received─┬─upstream_bytes_sent─┬─upstream_cache_status─┬─upstream_connect_time─┬─upstream_header_time─┬─upstream_response_length─┬─upstream_response_time─┬─upstream_status─┬─upstream_content_type─┐
│ nginx-vector │ 2020-08-07 04:32:42 │ vhost1      │         │ GET / HTTP/1.0 │ 1server            │ vhost1            │ /           │ http           │ GET            │             66 │        0.028 │                  │             404 │                       27 │                       │ 172.26.10.106 │       45886 │             │ 172.26.10.106 │             0 │                     109 │                  97 │ DISABLED              │                     0 │                0.025 │                       27 │                  0.029 │             404 │                       │
└──────────────┴─────────────────────┴─────────────┴─────────┴────────────────┴────────────────────┴───────────────────┴─────────────┴────────────────┴────────────────┴────────────────┴──────────────┴──────────────────┴─────────────────┴──────────────────────────┴───────────────────────┴───────────────┴─────────────┴─────────────┴───────────────┴───────────────┴─────────────────────────┴─────────────────────┴───────────────────────┴───────────────────────┴──────────────────────┴──────────────────────────┴────────────────────────┴─────────────────┴───────────────────────
Clickhouse ရှိ ဇယားများ၏ အရွယ်အစားကို ရှာဖွေပါ။
select concat(database, '.', table)                         as table,
       formatReadableSize(sum(bytes))                       as size,
       sum(rows)                                            as rows,
       max(modification_time)                               as latest_modification,
       sum(bytes)                                           as bytes_size,
       any(engine)                                          as engine,
       formatReadableSize(sum(primary_key_bytes_in_memory)) as primary_keys_size
from system.parts
where active
group by database, table
order by bytes_size desc;
Clickhouse တွင် space log မည်မျှရှိသည်ကို ရှာကြည့်ကြပါစို့။
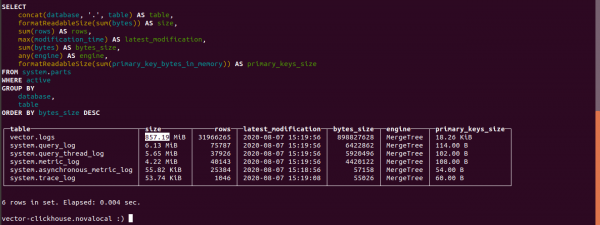
မှတ်တမ်းဇယားအရွယ်အစားမှာ 857.19 MB ဖြစ်သည်။
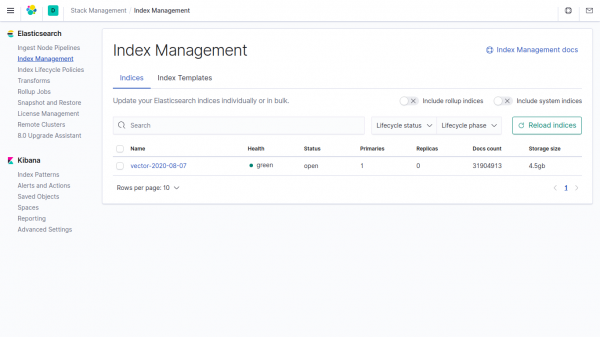
Elasticsearch ရှိ အညွှန်းကိန်းရှိ တူညီသောဒေတာအရွယ်အစားမှာ 4,5 GB ဖြစ်သည်။
ကန့်သတ်ဘောင်များတွင် vector ကို သင်မသတ်မှတ်ပါက၊ Clickhouse ဒေတာသည် Elasticsearch ထက် 4500/857.19 = 5.24 ဆ လျော့နည်းသည်။
vector တွင်၊ compression field ကို မူရင်းအတိုင်းအသုံးပြုသည်။
Telegram တွင် စကားပြောပါ။
Telegram တွင် စကားပြောပါ။
တယ်လီဂရမ် chat တွင် ""
source: www.habr.com
